Discover the latest business news, Sensex, and Nifty updates. Obtain Personal Finance insights, tax queries, and expert opinions on Moneycontrol or download the Moneycontrol App to stay updated!
Experts line up top 10 stock ideas with 3-4 week perspective as the market slips into correction.
The market turned cautious after an upward rally through the last three weeks, and ended the last week flat after the simmering tension between Iran and Israel triggered a spate of corrections on the back of soaring crude oil prices. Technically, the Nifty 50 has negated the higher-high-higher-low formation of previous three days and formed a long bearish candlestick pattern on the daily charts, while on the weekly scale, there was shooting star kind of a candlestick pattern at the top, raising the possibility for further weakness in price in the near term.
Hence, considering the technical weakness with a bearish divergence on the weekly scale and rising Iran-Israel tensions, experts feel the index is likely to correct up to 22,300-22,200 area and breaking of the same can take the index down up to 22,000 mark, but in case of recovery, 22,700-22,800 is expected to be key hurdle on the higher side.
For the week ended April 12, the Nifty 50 climbed 6 points to 22,519.
"Although the overall loss was minimal, just 0.02 percent from the previous week, the sentiment turned somewhat tense towards the end of the session. This could suggest some caution among investors amidst the uncertain global market conditions," Jigar S Patel, senior manager - equity research at Anand Rathi, said.
Further upside in both the indices and individual stocks is anticipated only if it breaches the 22,800 mark. On the downside, 22,300 is identified as a significant support level for the upcoming week, he feels.
Rajesh Bhosale, technical analyst at Angel One, also feels the range of 22,700 to 22,800 on the Nifty 50 throws up a significant resistance. Conversely, a breach of the 22,500-22,450 zone may trigger further profit-booking, potentially towards 22,300 and beyond in the near term.
Hence, Jigar advised traders to exercise caution and maintain light positions as even a moderate correction in the indices could trigger a substantial downturn in stocks.
Moneycontrol collated a list of top 10 stock ideas from experts, with 3-4 weeks perspective. The closing price of April 12 is considered for the calculation of stock price return.
Expert: Jigar S Patel, senior manager - equity research at Anand Rathi
Navin Fluorine International: Buy | LTP: Rs 3,297 | Stop-Loss: Rs 3,075 | Target: Rs 3,600 | Return: 9 percent
Following its Double Top formation near Rs 4,900-4,800 zone, Navin Fluorine has experienced a significant downturn, falling 41 percent. However, in the last 5-6 trading sessions, it has found support near Rs 3,000 mark. Concurrently, a Bullish Crab pattern has materialized on Navin Fluorine's daily chart, signaling a potential reversal in trend.
Moreover, "regular bull divergence"* has been identified on the relative strength index (RSI) daily scale, indicating strengthening bullish momentum.
Based on these technical indicators, investors may consider initiating long positions within the range of Rs 3,200-3,300. The upside target for this trade is set at Rs 3,600. To manage risk, a stop-loss order should be placed near Rs 3,075, helping to limit potential losses in case the trade doesn't perform as expected.
*NOTE: If the price is making lower lows, but the oscillator is making higher lows, this is considered to be regular bullish divergence.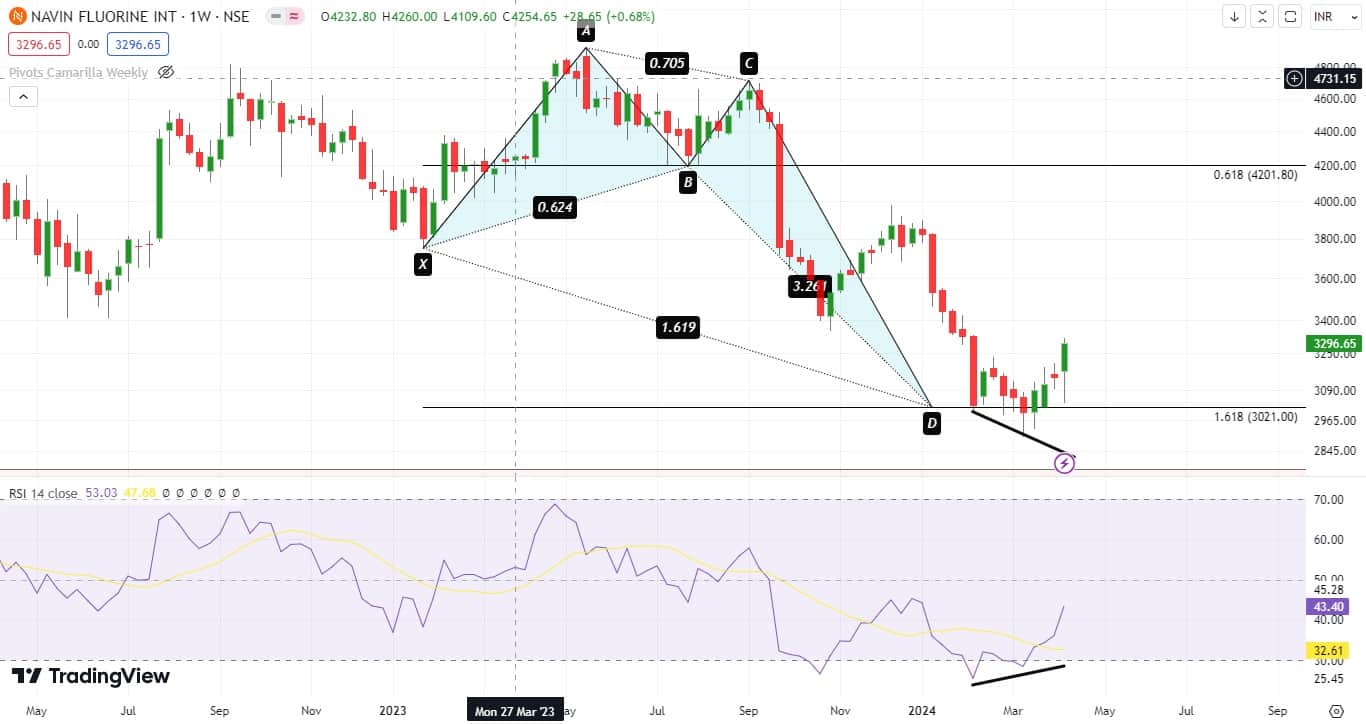
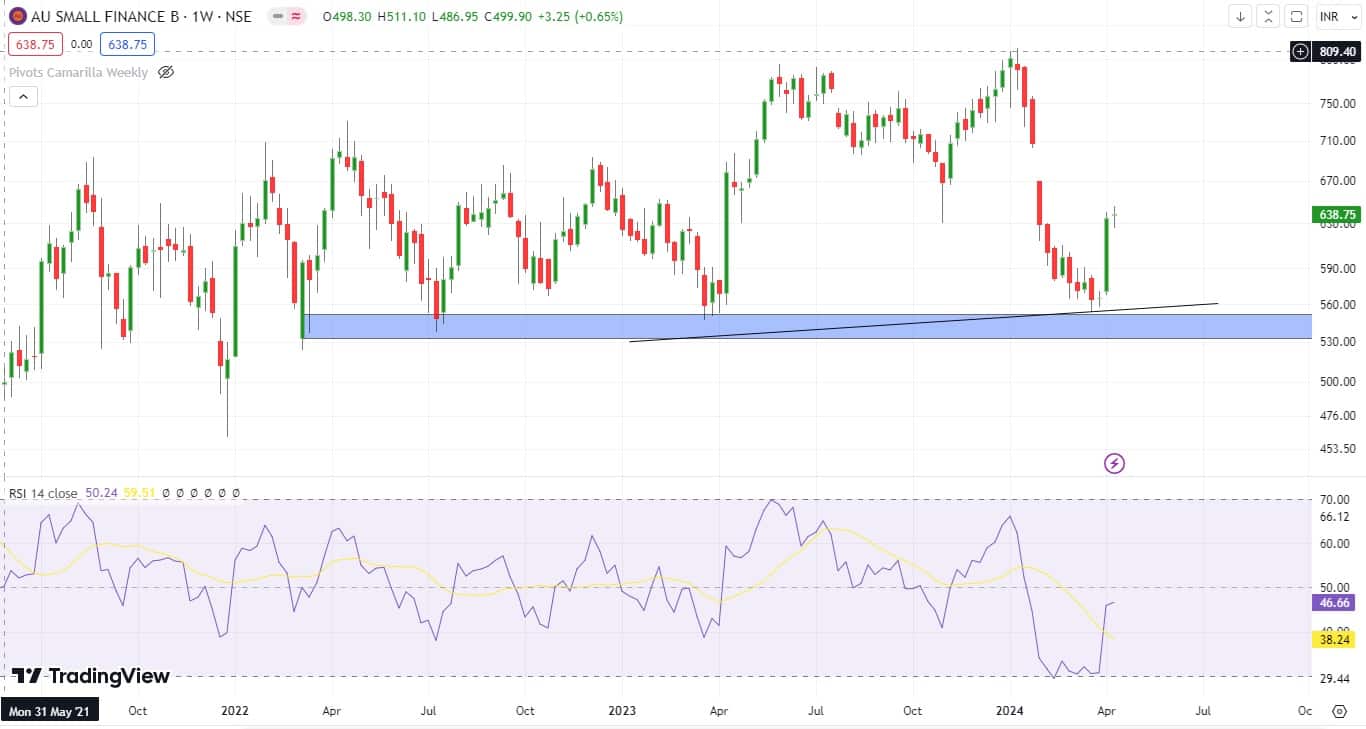
AU Small Finance Bank: Buy | LTP: Rs 639 | Stop-Loss: Rs 585 | Target: Rs 725 | Return: 13 percent
AU Small Finance Bank reached a peak around Rs 813 on January 9, 2024, but since then experienced a decline of about 32 percent. However, in the past two weeks, the stock has shown a significant recovery and is currently trading near Rs 620 mark, indicating a bullish sentiment.
On the indicator side, the weekly scale RSI indicator has identified a "hidden Bull Divergence"* close to its previous low point recorded on March 20, 2023 (as shown on the chart). This divergence suggests the possibility of upward momentum and indicates a potential bullish sentiment.
Therefore, investors may consider adding long positions in the range of Rs 620-640, with an upside target set at Rs 725. It's recommended to set a stop-loss near Rs 585 on a daily closing basis to manage risk.
*NOTE: A hidden bullish divergence is a setup where the oscillator forms progressively lower lows at the same time that the price is forming higher lows.
SBI Cards and Payment Services: Buy | LTP: Rs 738 | Stop-Loss: Rs 665 | Target: Rs 840 | Return: 14 percent
Following a peak near Rs 933 level, the SBI Card underwent a significant downturn, experiencing a sharp decline of 27 percent in its overall value. However, over the course of last week, SBI Card has managed to stabilize around Rs 675 levels, forming a sustained support base.
Notably, during this period, a bullish Alternate pattern has emerged near Rs 680-710 level, providing further confirmation of positive market sentiment. Additionally, analysis of the daily RSI indicator reveals a bear trendline violation, indicating a favourable outlook for the stock.
Considering these factors alongside chart patterns, investors may find it prudent to consider initiating buy positions within the range of Rs 710-740, with an upside objective targeted at Rs 840. To manage risk, a stop-loss order should be set at Rs 665 on a daily closing basis, providing protection against potential downside movements.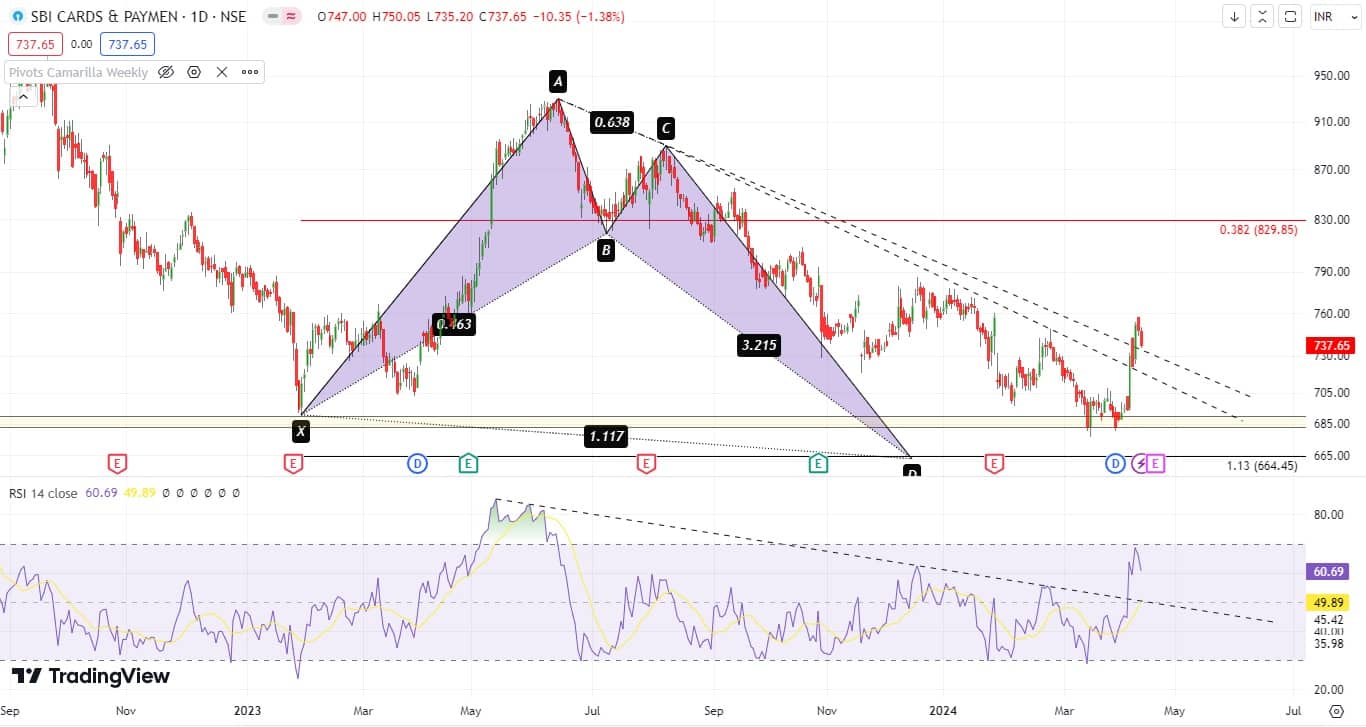
Expert: Shrikant Chouhan, head equity research at Kotak Securities
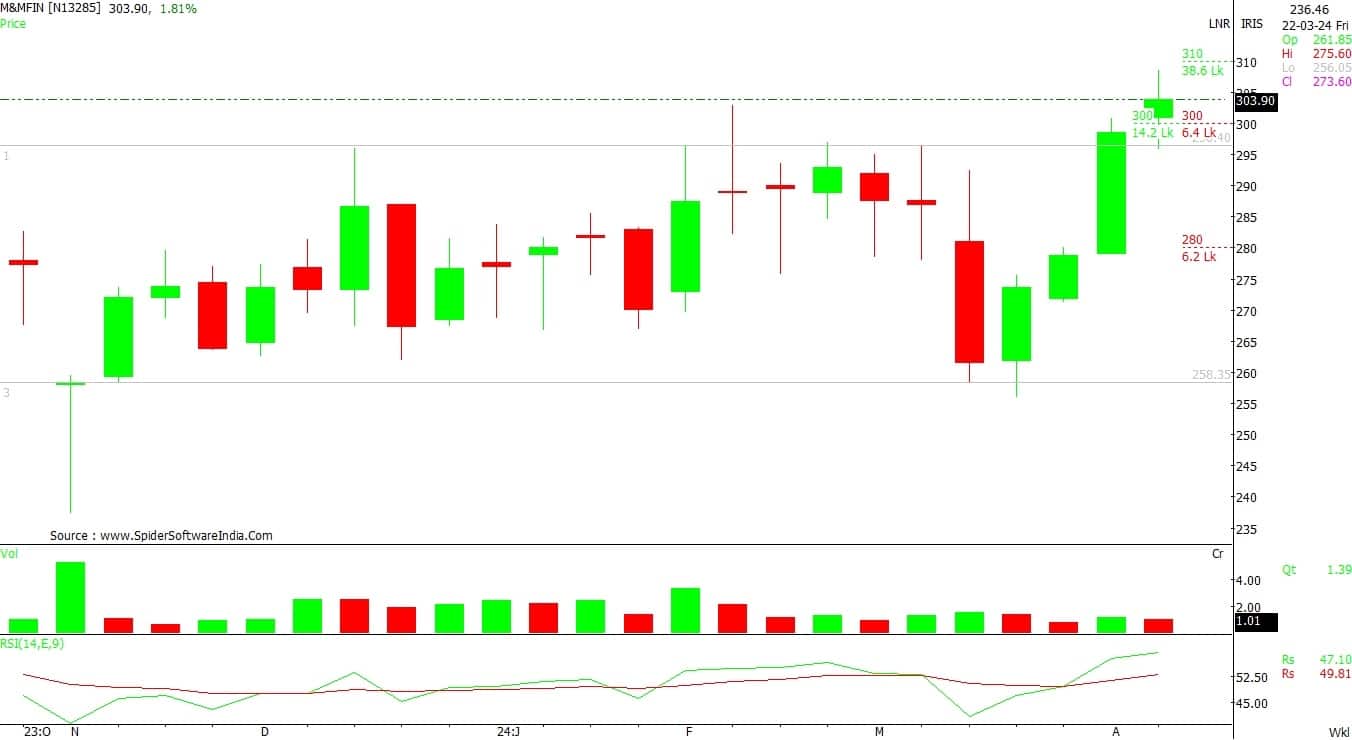
M&M Financial Services: BUY | LTP: Rs 303 | Stop-Loss: Rs 292 | Target: Rs 325 | Return: 7 percent
On the weekly scale, post correction from the higher levels, the counter was trading in a rangebound mode. Moreover, the counter has formed higher bottom series and it has given the range breakout.
Therefore, the closing above the resistance line indicates further bullish momentum to continue from the current levels.
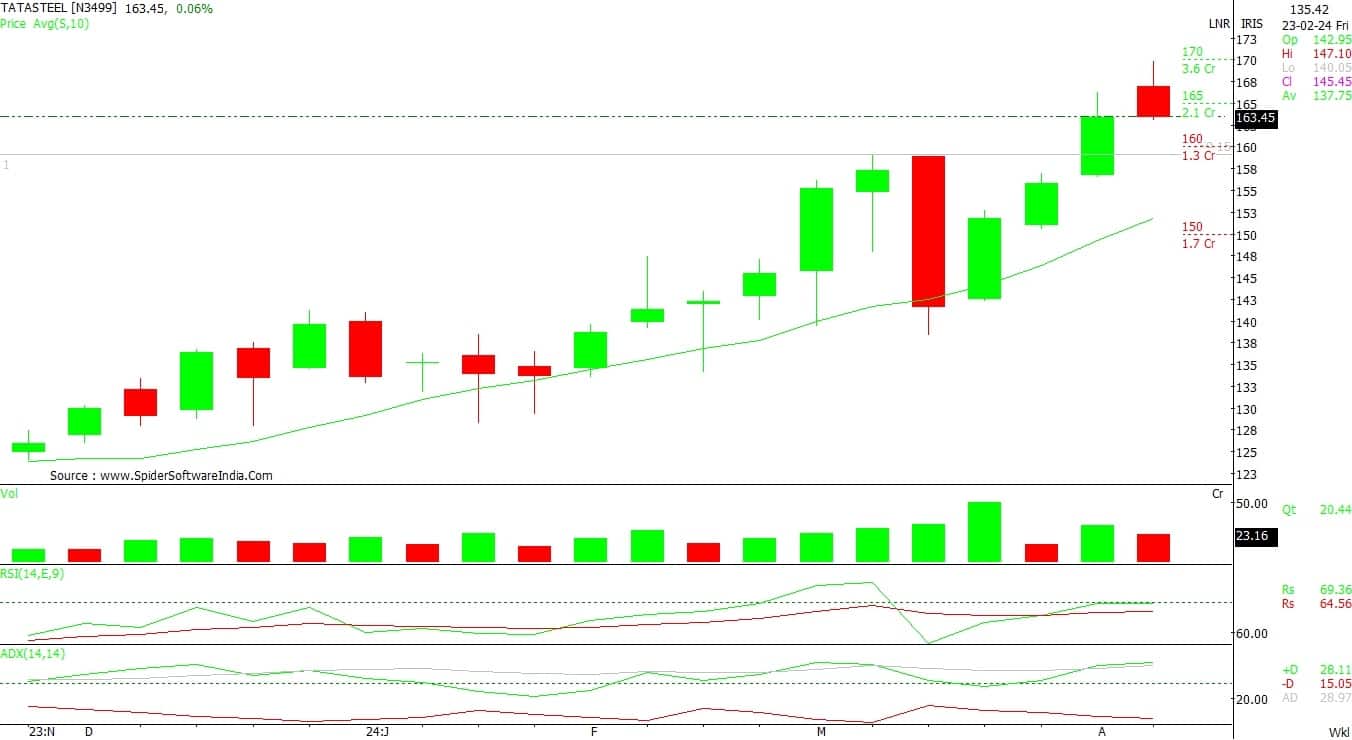
Tata Steel: Buy | LTP: Rs 163.5 | Stop-Loss: Rs 156 | Target: Rs 175 | Return: 7 percent
On the weekly charts, the counter is into a rising channel chart formation with higher high and higher low series pattern. Additionally, the technical indicators like ADX (average directional index) and RSI (relative strength index) is also indicating further up trend from current levels which could boost the bullish momentum in the near future.
Jubilant Fooworks: Buy | LTP: Rs 461 | Stop-Loss: Rs 444 | Target: Rs 494 | Return: 7 percent
The counter is in the accumulation zone where it is trading in a rangebound mode for the past few sessions. The texture of the chart formation and technical indicator RSI is indicating that the counter is in oversold territory.
Therefore, it is very likely to rebound from current levels for a new leg of the up move in the near term.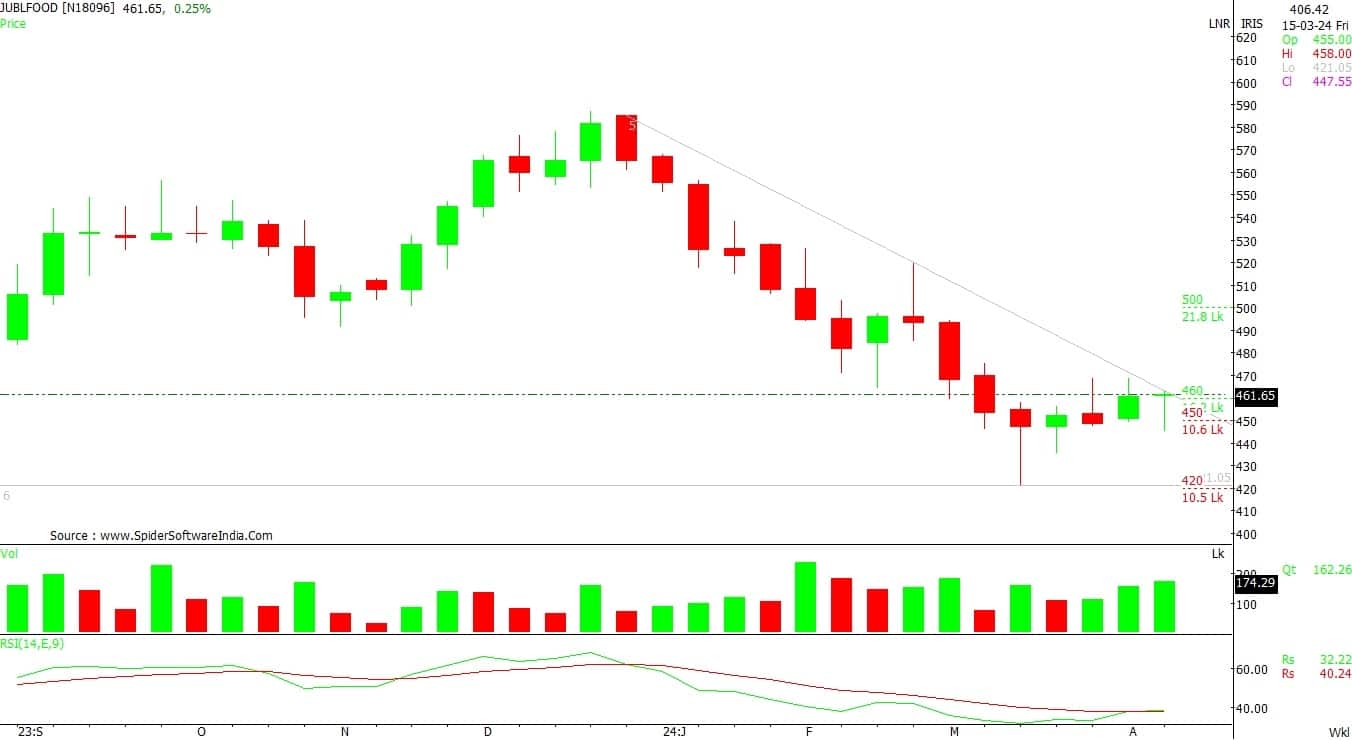
Expert: Riyank Arora technical analyst at Mehta Equities
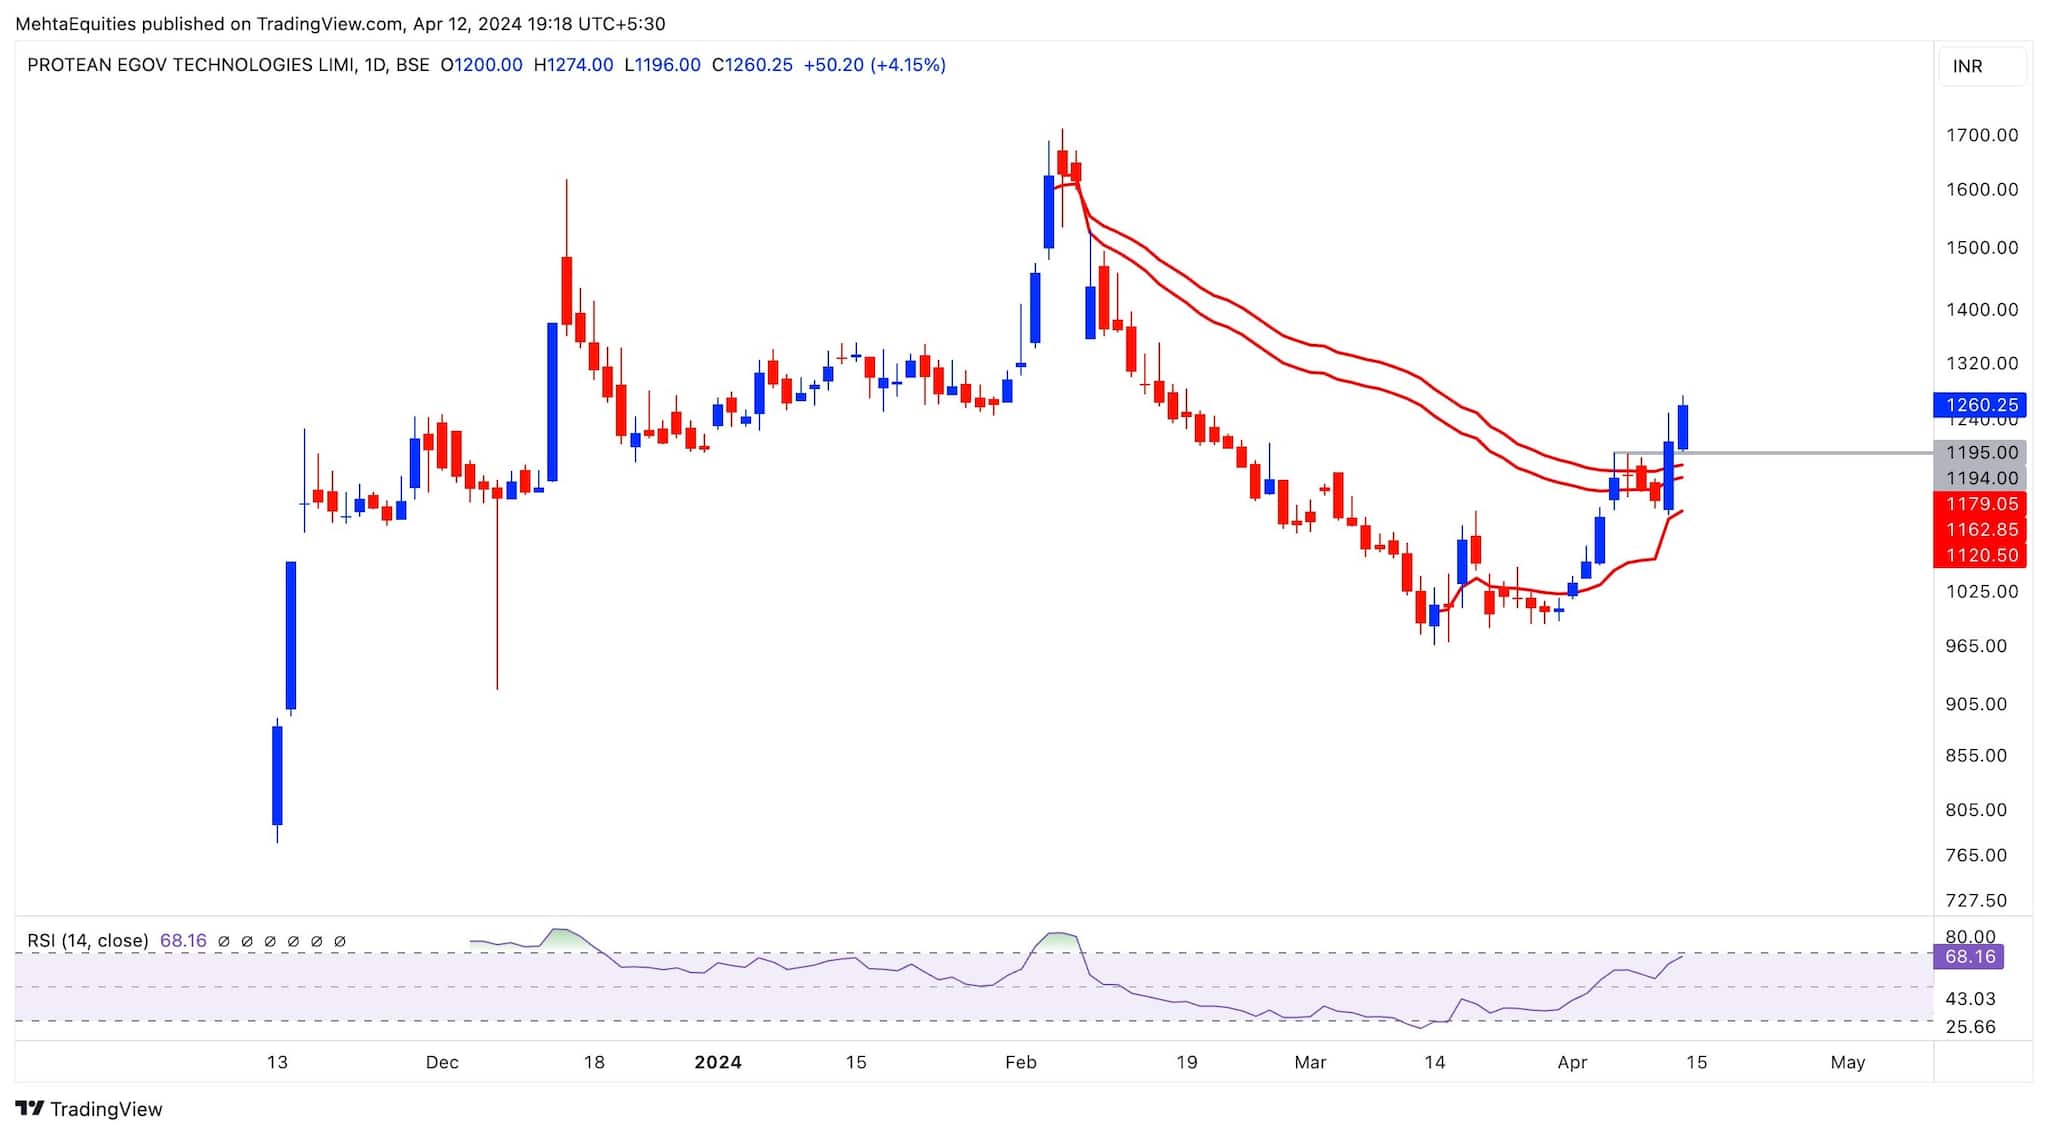
Protean eGov Technologies: Buy | LTP: Rs 1,260 | Stop-Loss: Rs 1,115 | Target: Rs 1,650 | Return: 31 percent
The stock has given a good breakout above its anchor VWAP (volume-weighted average price) resistance mark of Rs 1,195 on its daily timeframe charts. With the RSI (14) being near 68.16, the overall momentum looks strong, and any pullback towards Rs 1,180-1,200 should offer a good buying opportunity on the stock for potential target of Rs 1,650 and above, with a set stop loss at Rs 1,115 mark.
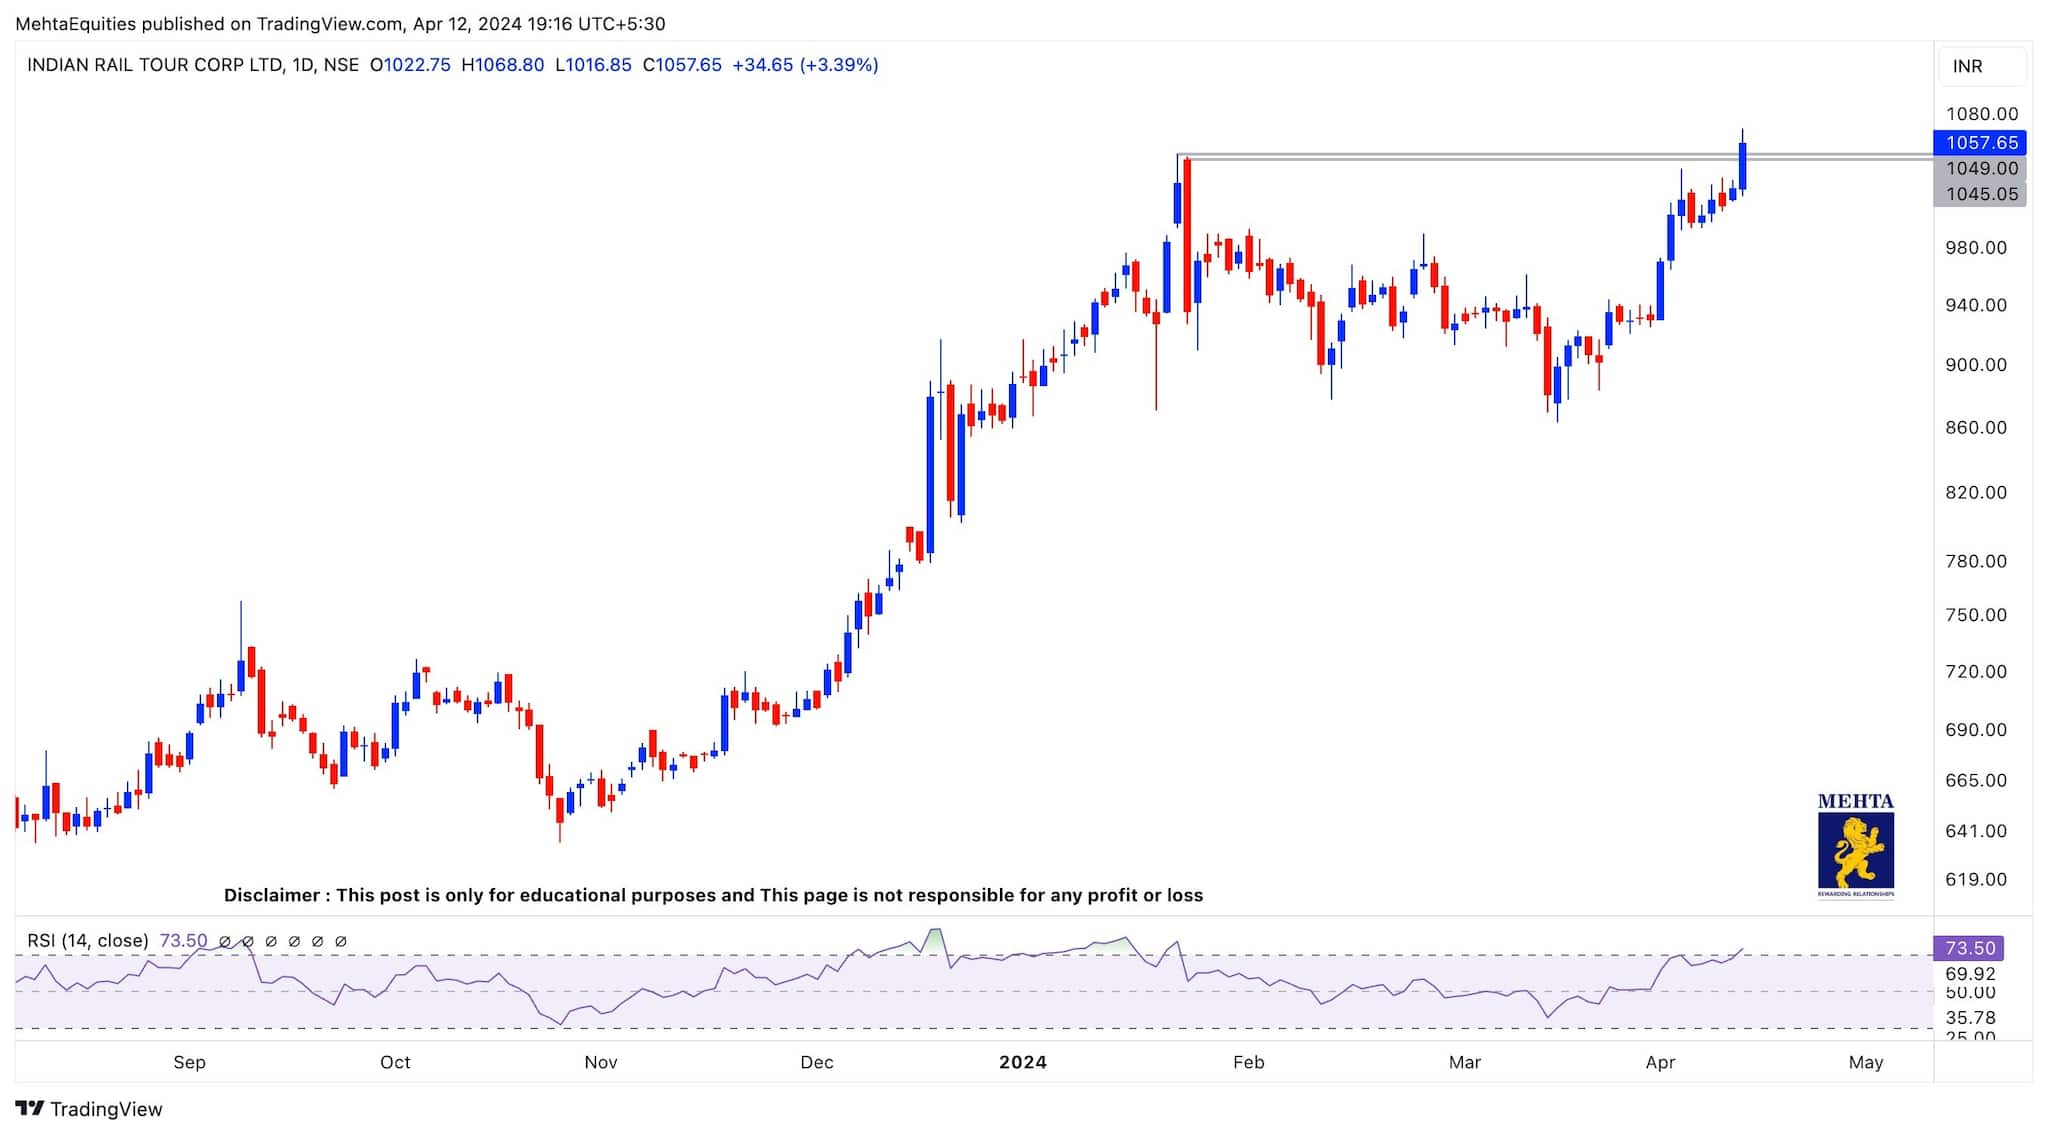
Indian Railway Catering and Tourism Corporation: Buy | LTP: Rs 1,058 | Stop-Loss: Rs 1,015 | Target: Rs 1,120 | Return: 6 percent
The stock has given a good breakout above its 52-week high mark of Rs 1,049 on its daily charts. With the RSI (14) on the charts being near 73.50, the overall momentum looks strong, and volumes on the stock being nearly 5 times its average (30) days traded volume, we can expect a strong rally in the stock over the period of the next few days.
A strict stop-loss should be kept at Rs 1,015 mark for potential target of Rs 1,120 and above.
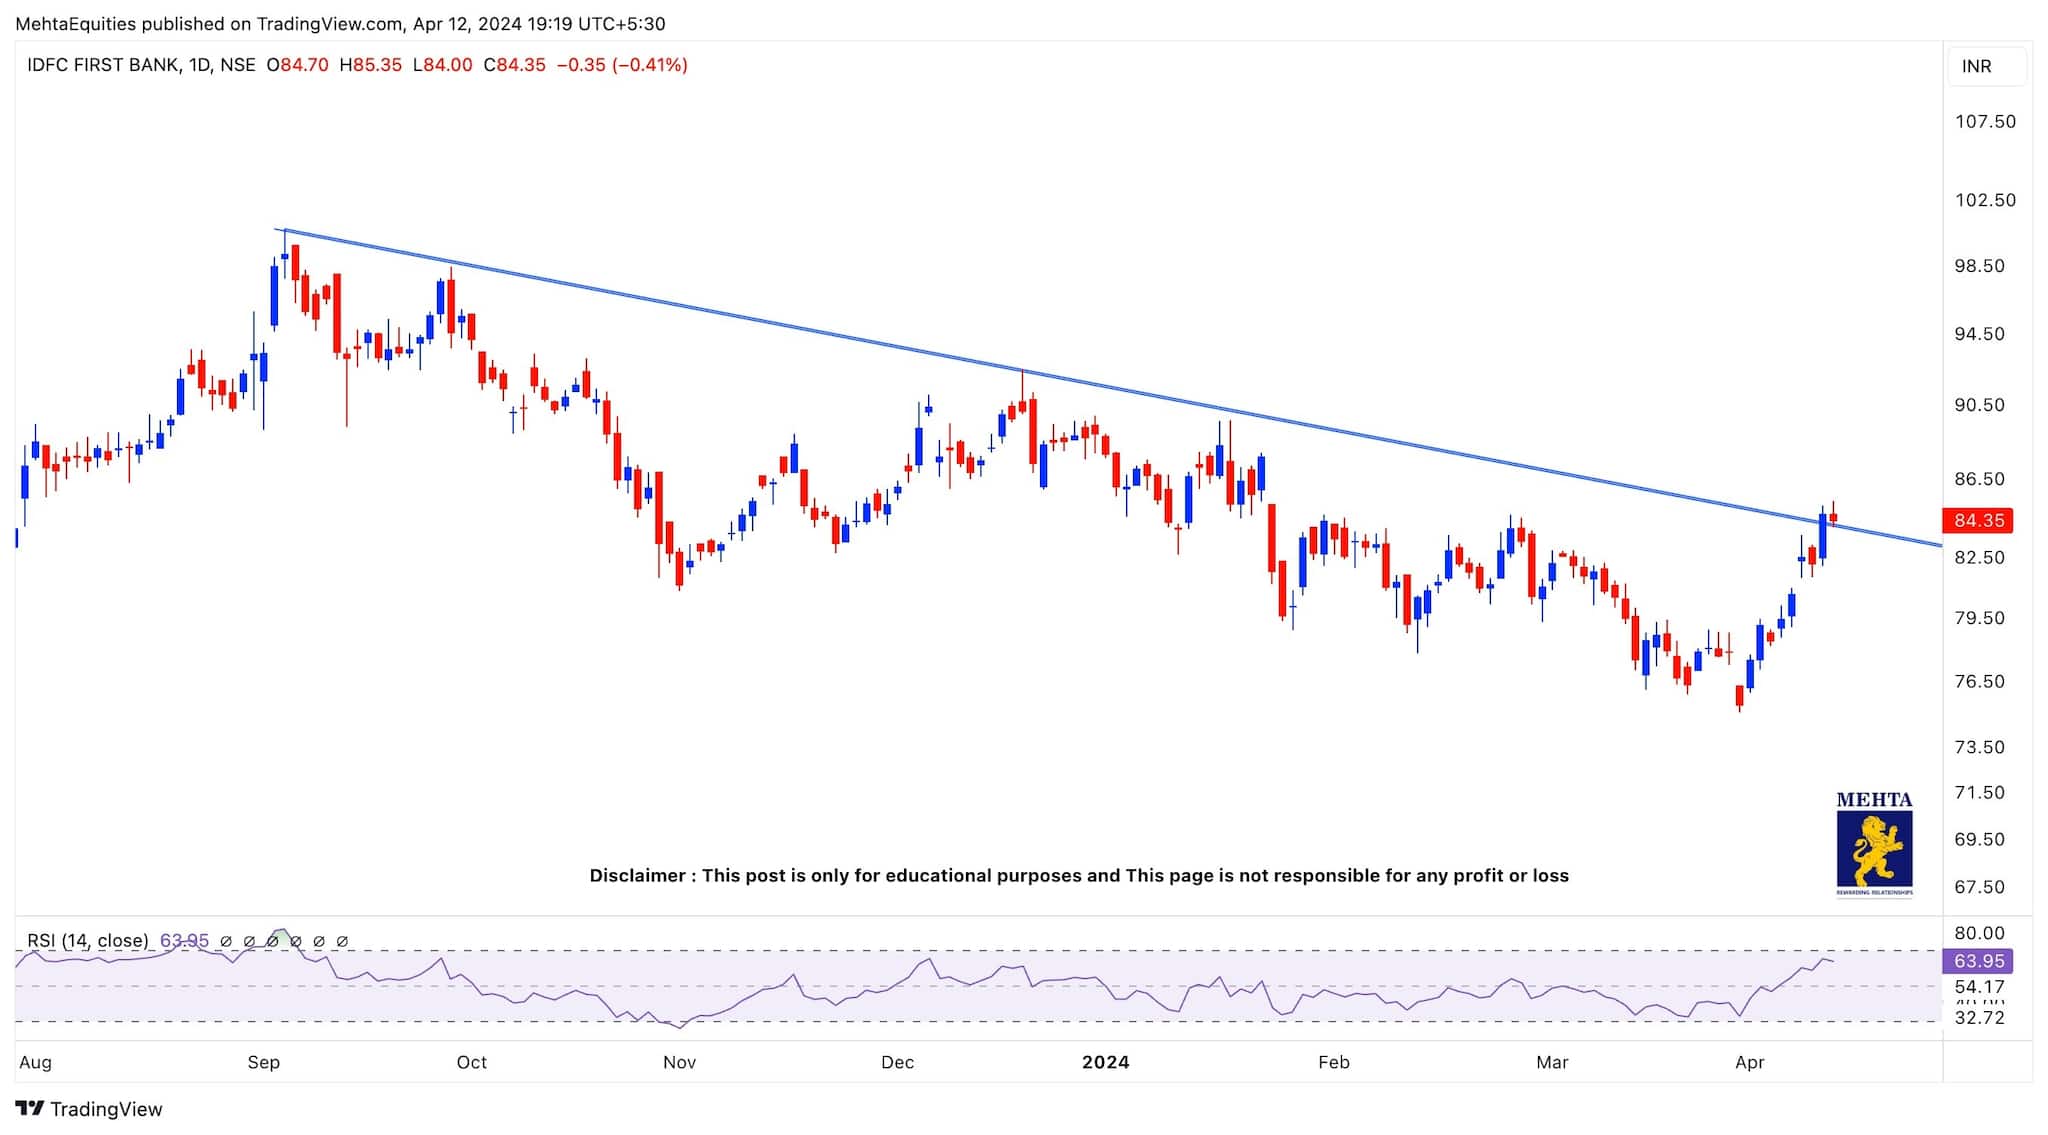
IDFC First Bank: Buy | LTP: Rs 84.35 | Stop-Loss: Rs 81 | Target: Rs 90 | Return: 7 percent
The stock has given a good breakout above its trendline resistance mark of Rs 83.50 on its daily timeframe charts. With the RSI (14) on the daily timeframe being near 63.95, the momentum is expected to be strong.
With the volumes in Friday's session being equivalent to its average (30) days traded volume, the stock is looking poised for an upside move towards a target of Rs 90 and above with a set stop-loss at Rs 81 mark.
Expert: Sudeep Shah, head of technical and derivative research at SBI Securities
Hindustan Aeronautics: Buy | LTP: Rs 3,638 | Stop-Loss: Rs 3,500 | Target: Rs 3,900 | Return: 7 percent
Hindustan Aeronautics has strongly outperformed the frontline indices since last couple of months which is evident from the ratio chart when compared to Nifty 500 is currently at all-time high.
The stock has given Bullish Pennant pattern breakout on daily scale backed by robust volume. Hence, we recommend accumulating the stock in the zone of Rs Rs 3,640-3,600 levels with the stop-loss of Rs 3,500 for a target of Rs 3,850, followed by Rs 3,900 in short-term.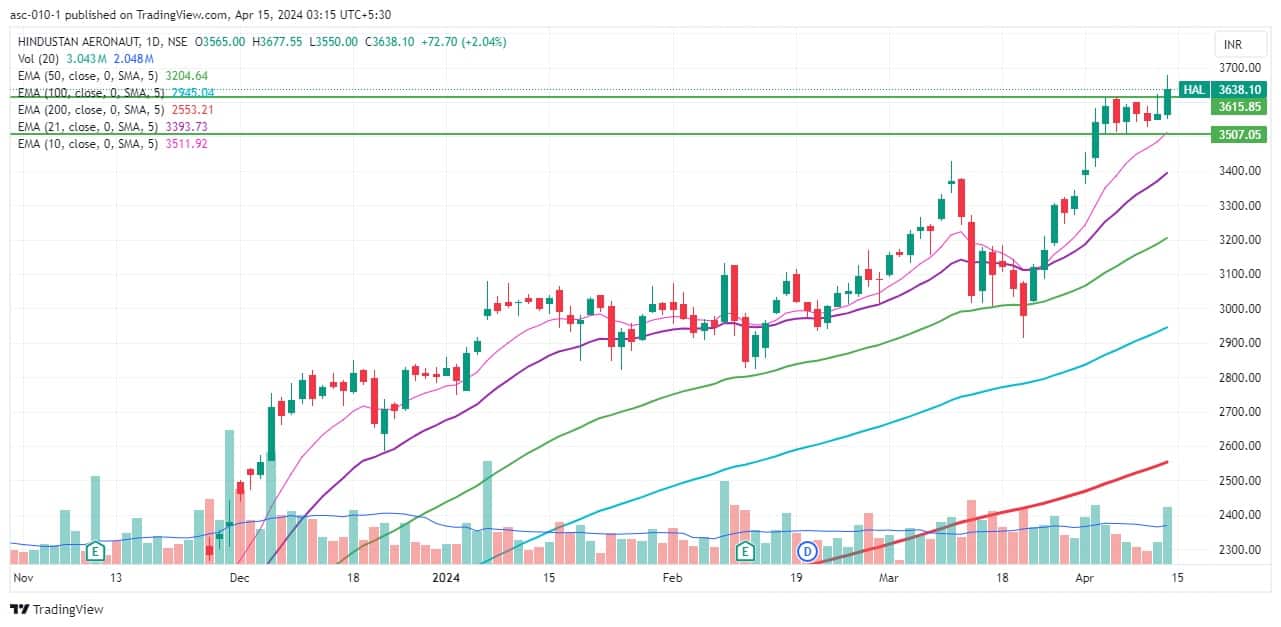
Disclaimer: The views and investment tips expressed by investment experts on Moneycontrol.com are their own and not those of the website or its management. Moneycontrol.com advises users to check with certified experts before taking any investment decisions.