Discover the latest business news, Sensex, and Nifty updates. Obtain Personal Finance insights, tax queries, and expert opinions on Moneycontrol or download the Moneycontrol App to stay updated!
India's m-cap to GDP ratio, also known as the Buffett Indicator, stood at 1.33 or 133 percent on April 8, compared to a 10-year average of 0.93. The above 100 percent reading, implies that the Indian market is overvalued.
When it comes to the stock market, who better to look for advice than Warren Buffett? The Rs 400-trillion question on the mind of Indian investors is whether the market will scale new heights and make us richer or is it time for a climb down that will erode wealth. Here is one reliable indicator which gives us some sense of how the big picture looks: The Buffet indicator or the ratio of market capitalisation of all listed companies to the GDP of a country.
Follow our market blog to catch all the live action
Buffett indicator shows amber
India's m-cap to GDP ratio currently stands at 1.33, or 133 percent, on April 8. This is higher than the 10-year average of 0.93. That’s a considerable deviation from the trend but not the highest level this indicator has touched in India. In 2007, the m-cap to GDP ratio touched an all-time high of 1.464, before falling under 1 in 2008.
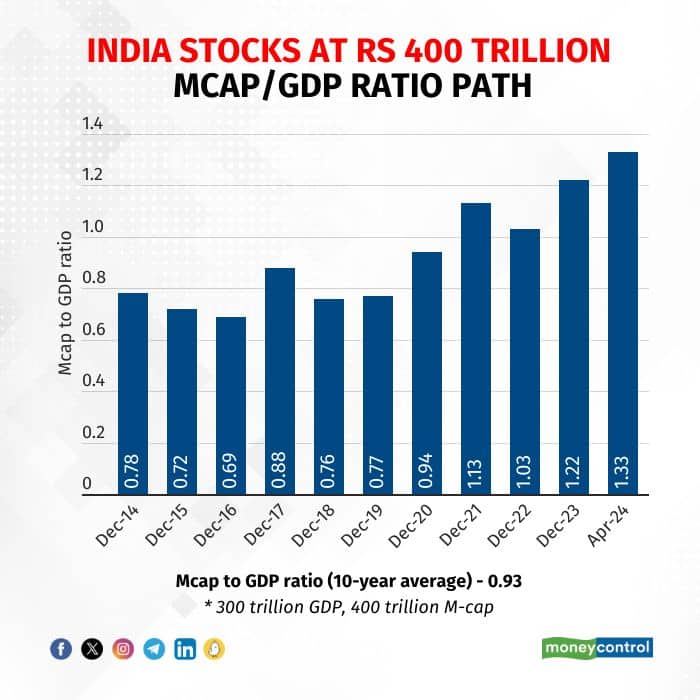 India's market capitalisation to GDP ratio reclaimed the 100 percent mark in 2021, as the recovery rally from COVID lows took the domestic market to fresh highs. The lowest level the indicator has reached is 0.23 in 2001, which set the foundation for the remarkable bull run from 2003-2007.
India's fastest but not the most expensive
For the quarter ended March 31, the USA has a market-cap to GDP ratio of 1.844, up from 1.676 in the previous quarter, while Japan’s reading came in around the 1.703 level. Both of these countries have higher ratios compared to India.
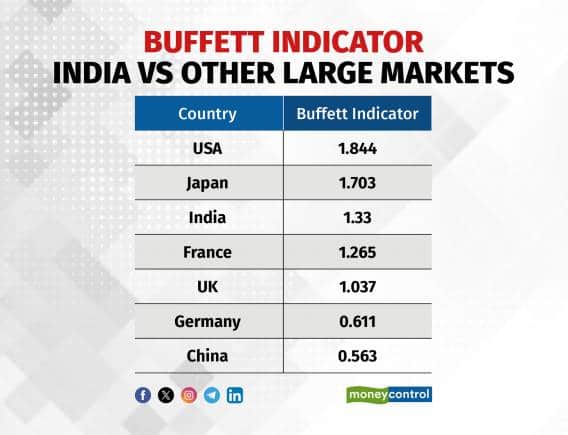
In comparison, Germany’s Buffett indicator hovered around the 0.611 level, while the United Kingdom’s indicator was around 1.037, both lower than India’s. The lowest Buffett indicator among the largest markets was China's, which came in around 0.563.
What does this mean?
Market experts assert that the ongoing bull run in India is unparalleled in terms of wealth generation, which is relflected in the high market-capitalisation of companies. However, the underpinnings of this are strong. India is having a mini-Goldilocks moment with strong macroeconomic conditions and corporate earnings, peaking of interest rates, moderate inflation print, and ongoing policy momentum.
Additionally, these positive conditions are being supported by healthy flows. India now boasts a unique combination of size and growth, according to Motilal Oswal.
International brokerage Haitong remains convinced of the strength in Indian markets in the long term, and expects to see a strong pickup post elections. "We would recommend looking at any dips as buying opportunities, as valuations are currently at all-time highs," it said.
Even as growth remains stock and sentiment overwhelmingly position, experts advise caution in pockets where valuations may be totally out of whack with reality.
Disclaimer: The views and investment tips expressed by investment experts on Moneycontrol.com are their own and not those of the website or its management. Moneycontrol.com advises users to check with certified experts before taking any investment decisions.