Discover the latest business news, Sensex, and Nifty updates. Obtain Personal Finance insights, tax queries, and expert opinions on Moneycontrol or download the Moneycontrol App to stay updated!
Expert suggests trading strategy for these 3 stocks
Considering the bullish crossover in momentum indicators (MACD - moving average convergence divergence) and RSI (relative strength index) on hourly charts and smart recovery from the day's low in the previous session with a Doji candlestick pattern formation after red candle on daily charts, the Nifty 50 may make an attempt to rebound with resistance at the 21,900-22,000 area in the coming session, while the support lies at 21,800, and then at 21,700, experts said.
On March 20, the Nifty 50 recovered more than 100 points from the day's low and settled 22 points higher at 21,839 ahead of the meeting of the Federal Reserve which maintained Fed funds rate at 5.25-5.50 percent and continued to signal for three rate cuts this year.
The BSE Sensex was up 90 points at 72,102, while the Nifty Midcap 100 and Smallcap 100 indices ended flat.
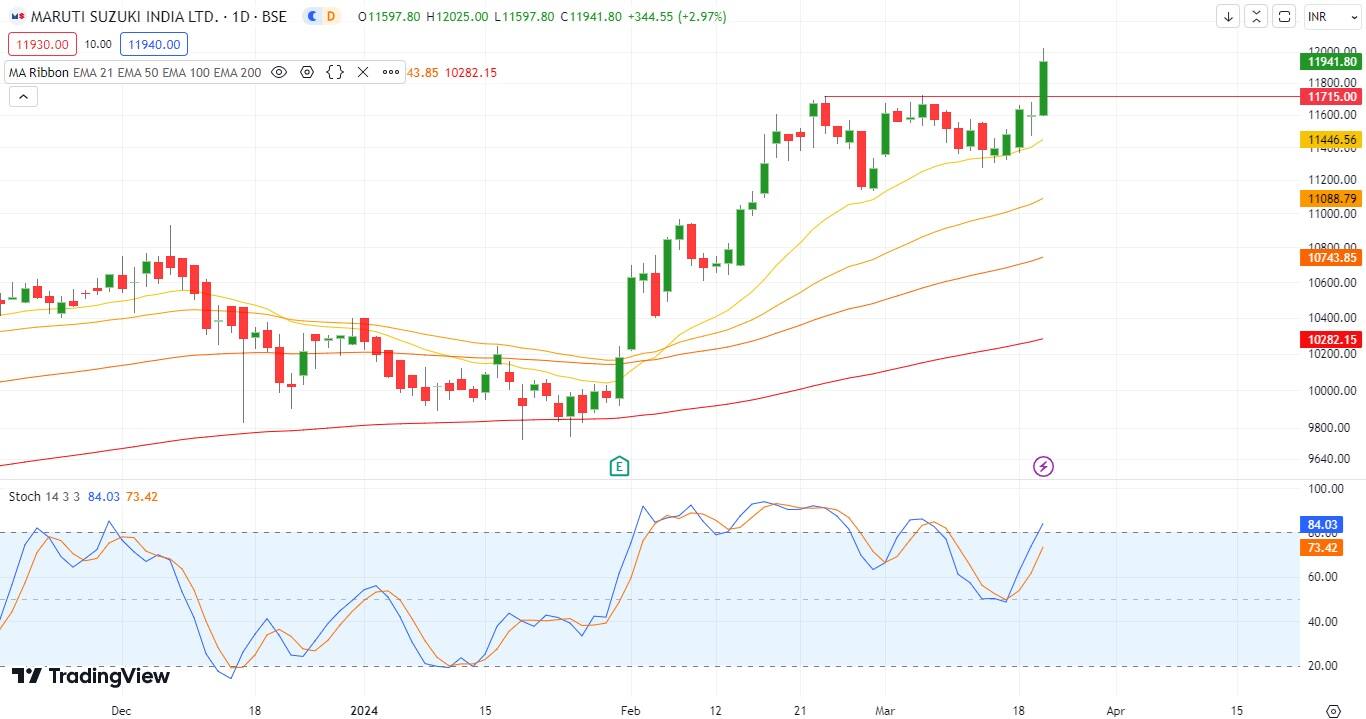
Stocks that recorded better performance than the benchmarks and broader markets included Maruti Suzuki India, Praj Industries, and BSE. Maruti Suzuki India rallied 3 percent to end at record closing high of Rs 11,941 and formed a long, bullish candlestick pattern on the daily charts after breaking the consolidation of last couple of weeks as well as seeing breakout of horizontal resistance trendline adjoining highs of February 23 and March 5, with healthy volumes, while trading above all key moving averages.
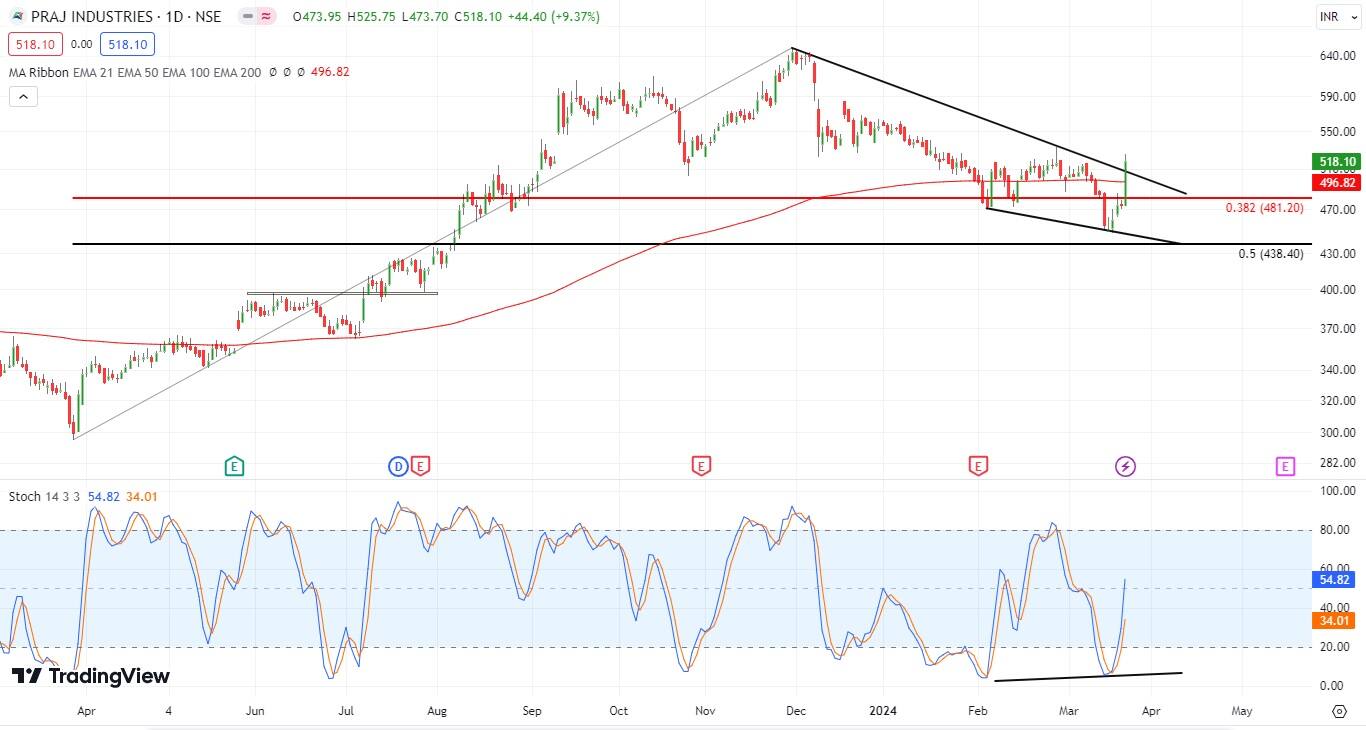
Praj Industries climbed above all key moving averages in a single day and rallied 9.4 percent to Rs 518, forming robust bullish candlestick pattern on the daily charts with significantly higher volumes. In fact, it has seen a decisive breakout of long downward sloping resistance trendline, which is a positive sign.
BSE climbed 4 percent to Rs 2,033 and formed a bullish engulfing candlestick (trend reversal) pattern on the daily charts after downtrend, with above average volumes, though it traded below 21, 50 and 100-day EMAs (exponential moving averages).
Here's what Jigar S Patel of Anand Rathi Shares & Stock Brokers recommends investors should do with these stocks when the market resumes trading today:
In recent market movements, Maruti has shown a consolidation around the 21-day exponential moving average (DEMA) subsequent to reaching a Double Top formation near Rs 11,700 mark. However, in the most recent trading session, the stock exhibited a significant breakthrough above Rs 11,700 level, closing near Rs 11,940.
This breakout is particularly notable as the daily stochastic oscillator has reversed direction from the 50 levels, indicating a potentially bullish momentum. Consequently, there appears to be an attractive opportunity at the current juncture. It is suggested that investors can consider initiating long positions within the range of Rs 11,850-Rs 12,000, with an upside target at Rs 12,500.
To manage risk, a stop-loss order should be placed near Rs 11,625 on a daily closing basis.
Following a peak near Rs 2,599 level, the Bombay Stock Exchange (BSE) underwent a significant downturn, experiencing a sharp decline of 25 percent in its overall value. However, over the course of the week, BSE has managed to stabilize around Rs 2,000 level, forming a sustained support base.
Notably, during this period, a bullish AB=CD pattern has emerged near Rs 2,000 level, providing further confirmation of positive market sentiment. Additionally, analysis of the 3-hour stochastic indicator reveals a bullish divergence, indicating a favourable outlook for the stock.
Considering these factors alongside chart patterns, investors may find it prudent to consider initiating buy positions within the range of Rs 2,000-2,050, with an upside objective targeted at Rs 2,300.
To manage risk, a stop-loss order should be set at Rs 1,890 on a daily closing basis, providing protection against potential downside movements.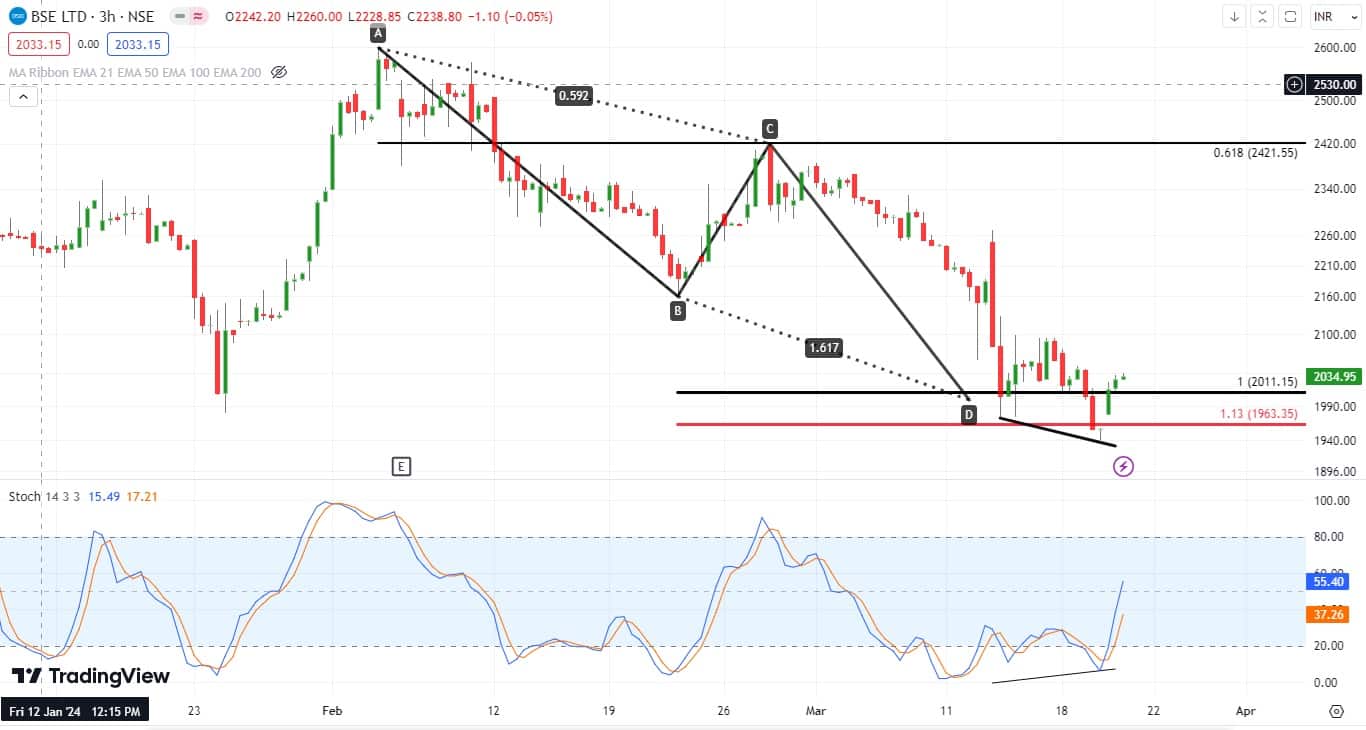
Since reaching a high of Rs 650 on November 30, 2023, Praj has undergone a notable decline, shedding nearly 31 percent in its price. Presently, the stock has demonstrated resilience by closing above the 200-day exponential moving average (DEMA) and finding support at this crucial technical level.
Additionally, a significant development on the daily chart is the breach of the bear line, coinciding with the vicinity between 0.382-0.50 percent retracement level of its previous upward movement, indicating a potential reversal in the downtrend.
Moreover, the daily stochastic indicator has exhibited bullish divergence, as indicated in the accompanying chart, further bolstering the bullish sentiment surrounding the stock.
Given these technical signals, investors might consider initiating buy positions within the range of Rs 490-520, with an upside target set at Rs 600. To mitigate risk, a stop-loss order should be placed near Rs 460 on a daily closing basis, ensuring protection against adverse price movements.
Disclaimer: The views and investment tips expressed by investment experts on Moneycontrol.com are their own and not those of the website or its management. Moneycontrol.com advises users to check with certified experts before taking any investment decisions.