Discover the latest business news, Sensex, and Nifty updates. Obtain Personal Finance insights, tax queries, and expert opinions on Moneycontrol or download the Moneycontrol App to stay updated!
Experts suggest top 10 stock ideas for 3-4 weeks.
The market went into the red after a green sweep for five weeks in a row and fell more than 2 percent at the end on March 15. Given the nervousness in the Street, bears took the plunge, paving the road for more volatility with a negative bias in the coming sessions. Experts see support for the market barometer at 21,900-21,850 and, below this, the bears will have a wider room to run the riots. On the higher side, the Nifty may face resistance at 22,200-22,300 and a decisive close above this may charge the bulls to drive the index to record highs.
For the week ended March 15, the Nifty 50 declined 470 points to 22,023 and formed a long bearish candlestick pattern which resembles Evening Star kind of a pattern (not the exact one) on the weekly charts with high volumes.
On the downside, there are visible multiple bottoms on the hourly chart in the range of 21,900 to 21,850, coinciding with the 50EMA (exponential moving average), suggesting critical support, Rajesh Bhosale, technical analyst at Angel One said. "Further decline below this level may trigger another round of significant selling, potentially pushing prices towards the previous swing low of 21,500, aligning with the 89EMA."
Going ahead, he advised caution and asked traders to refrain from attempting to catch the falling knife and, instead, wait for clear bullish reversal signals before considering aggressive long positions.
Jigar Patel, senior manager of equity research at Angel One, also feels that on the downside, 21,850 stands as a crucial support level, and a breach of this level might push the index towards the 21,600 level.
The current breakdown would only be invalidated if the index closes above 22,200, said Patel, who feels the market uncertainty will likely dissipate by the end of the month, allowing the markets to resume their primary upward trend.
Moneycontrol collated a list of top 10 stocks from experts, with 3-4 weeks perspective. The closing figure of March 15 is considered for the stock return calculation.
Expert: Shrikant Chouhan, Head Equity Research, Kotak Securities.
ICICI Prudential Life Insurance Company: Buy | LTP: Rs 567 | Stop-Loss: Rs 545 | Target: Rs 610 | Return: 7.4 percent
After the remarkable up move of the last few sessions, the counter witnessed short-term correction from the higher levels. However, closing above the important retracement levels suggest bullish continuation chart formation.
Therefore, the counter is likely to resume its uptrend from the current levels in the near term.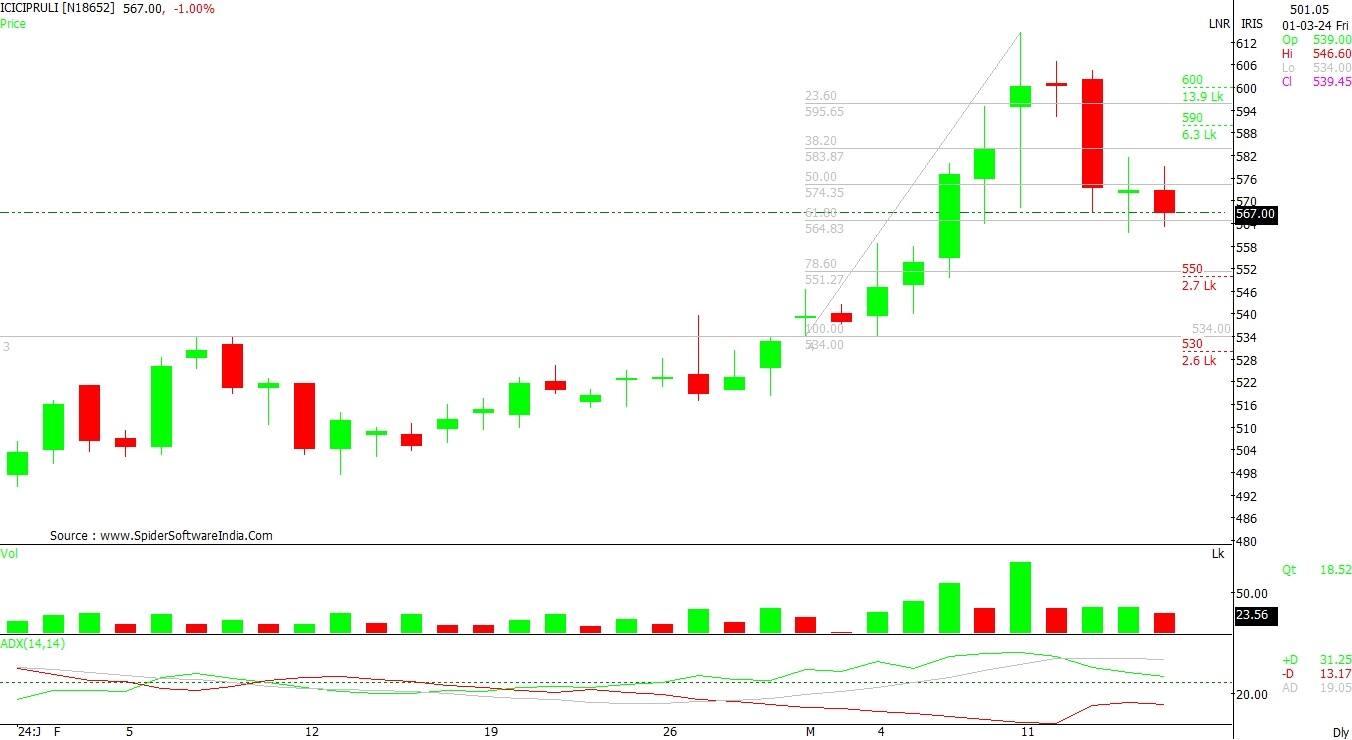
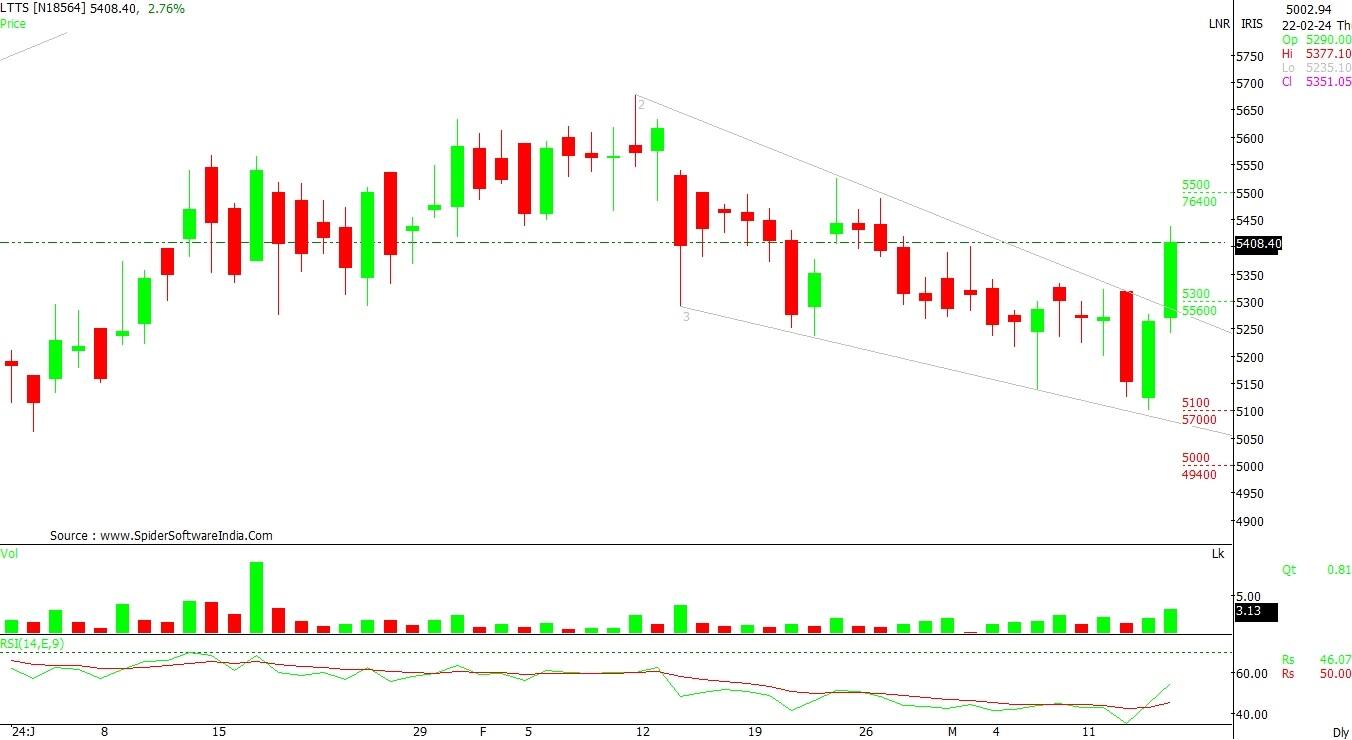
L&T Technology Services: Buy | LTP: Rs 5,419 | Stop-Loss: Rs 5,210 | Target: Rs 5,790 | Return: 7 percent
Post decline from the higher levels, the counter rebounded from its demand zone and witnessed a steady recovery from the lower levels. Additionally, on the daily charts, the counter has given a breakout from its sloping channel formation. The up moves in the counter suggest a new leg of bullish trend from the current levels.
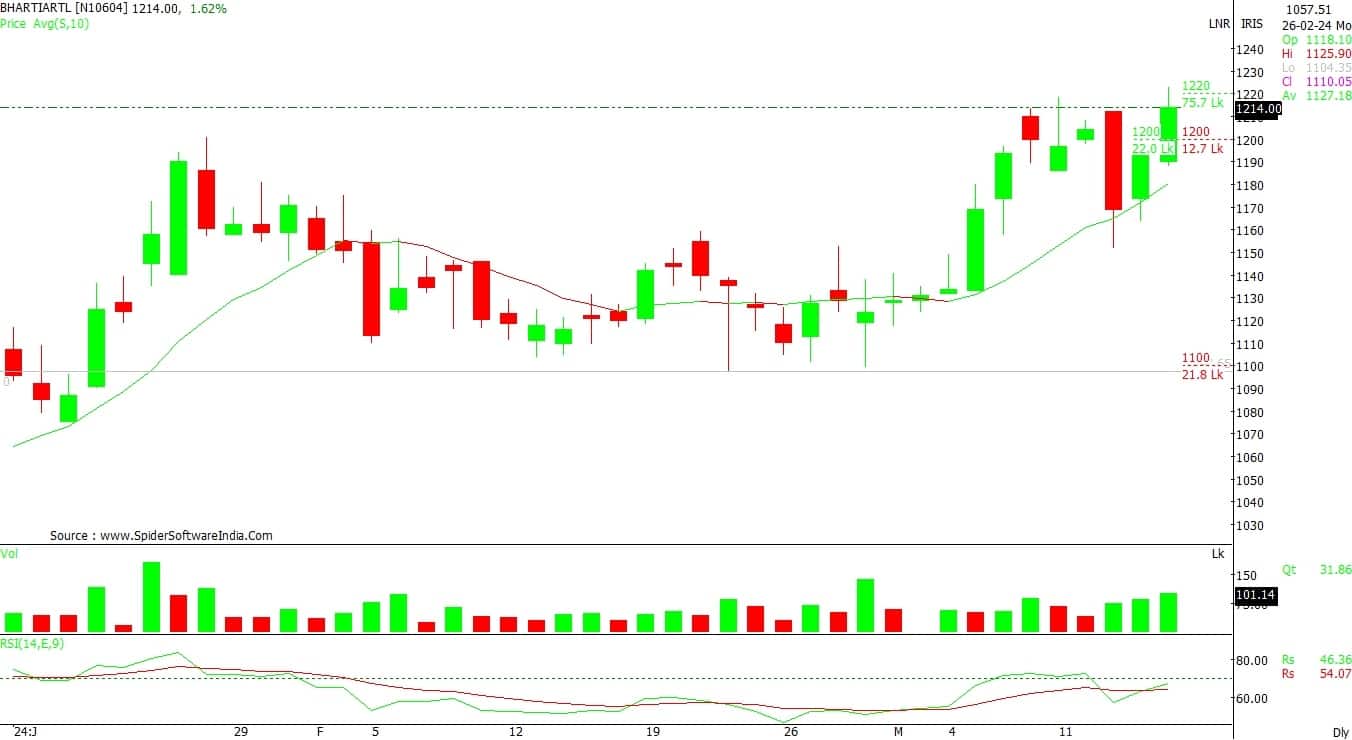
Bharti Airtel: Buy | LTP: Rs 1,220 | Stop-Loss: Rs 1,170 | Target: Rs 1,300 | Return: 7 percent
The counter is into a rising channel chart formation with a higher low series pattern on a consistent basis. After a sharp uptrend rally, the counter comfortably closed above its previous swing high. In addition, on daily charts the counter has formed bullish continuation chart formation, which indicates strong up move to persist in the near term.
Expert: Riyank Arora, technical analyst at Mehta Equities
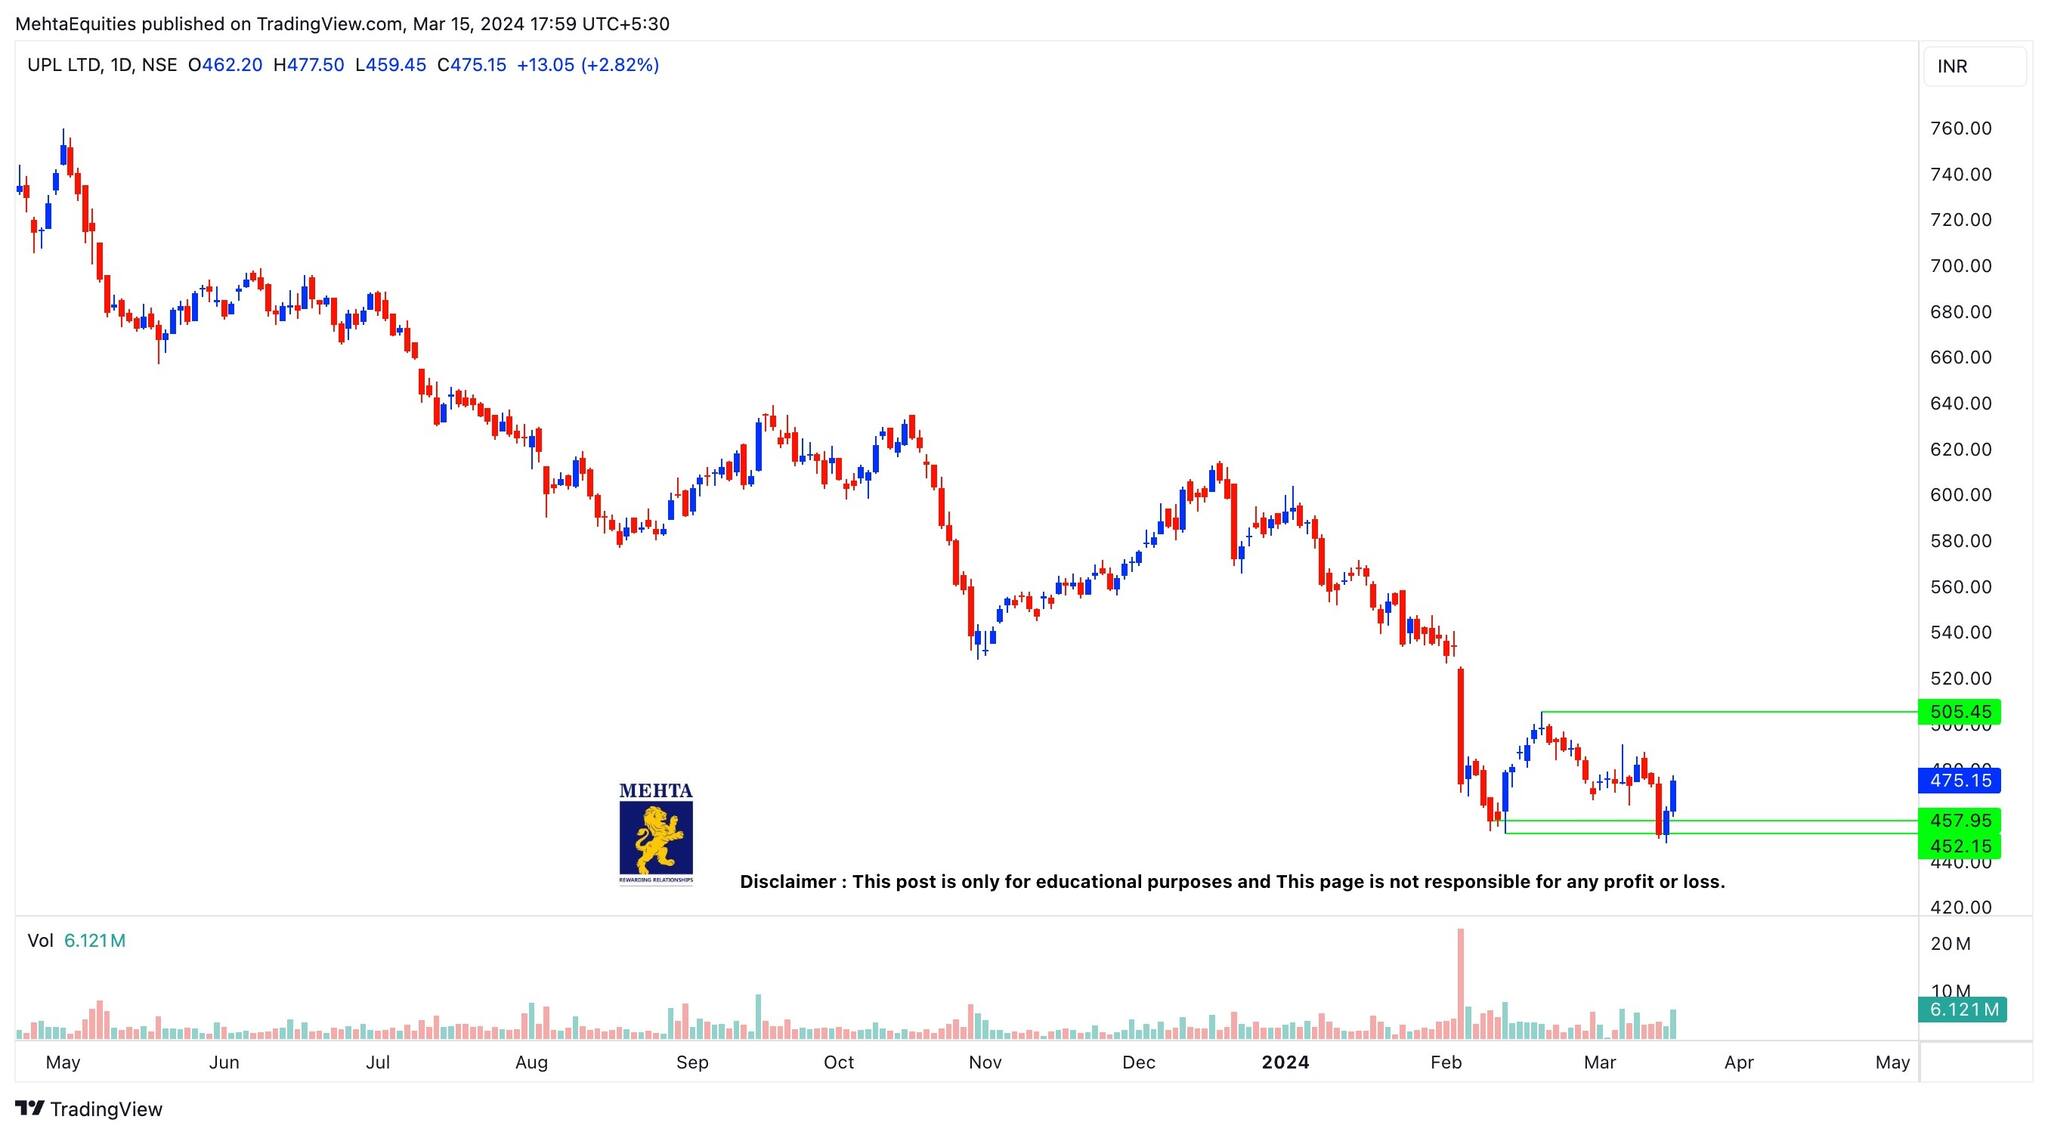
UPL: Buy | LTP: Rs 475 | Stop-Loss: Rs 440 | Target: Rs 505 | Return: 6 percent
The stock has touched its major support mark of Rs 460 on its daily charts and is forming a potential double bottom reversal pattern. The overall volume in Friday's session was nearly 1.5 times the average (10-day) volume.
At the current market price of Rs 475, the risk is minimal, and the stock is looking poised for a good upside move towards Rs 500 - Rs 505 zone.
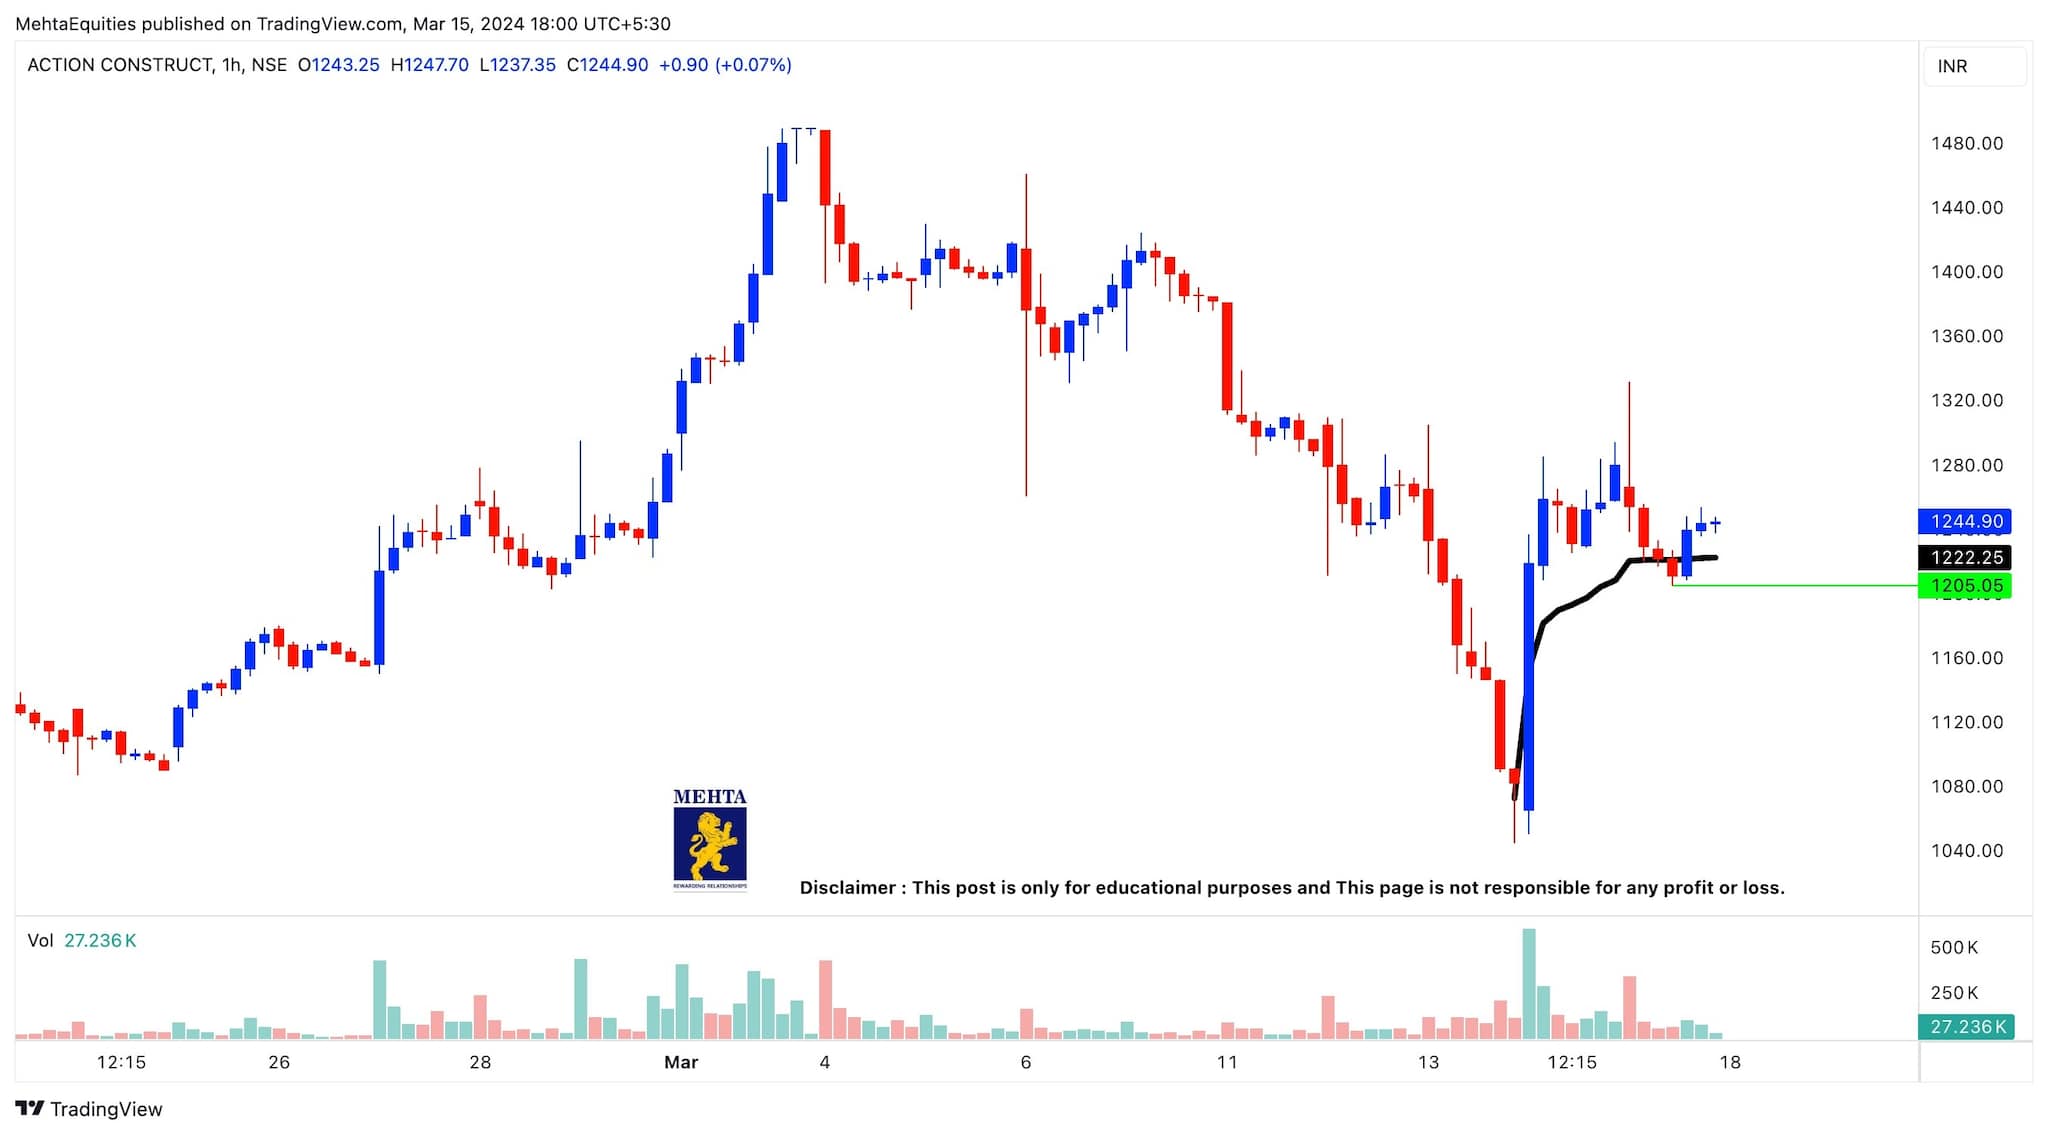
Action Construction Equipment: Buy | LTP: Rs 1,241 | Stop-Loss: Rs 1,190 | Target: Rs 1,330/1,420 | Return: 7 percent
The stock has successfully re-tested its anchor VWAP (volume-weighted average price) support mark of Rs 1,220 and managed to hold well above the same. From a broader perspective, the stock has a minor resistance near Rs 1,330 mark, above which the next hurdle would be somewhere near Rs 1,420 levels.
On its hourly charts, the stock is forming a potential higher low at around Rs 1,200 levels. The risk-reward looks favourable on the buy side at the current market price with a set stop-loss at Rs 1,190 mark for potential targets of Rs 1,330 and Rs 1,420.
Expert: Om Mehra, technical analyst at SAMCO Securities
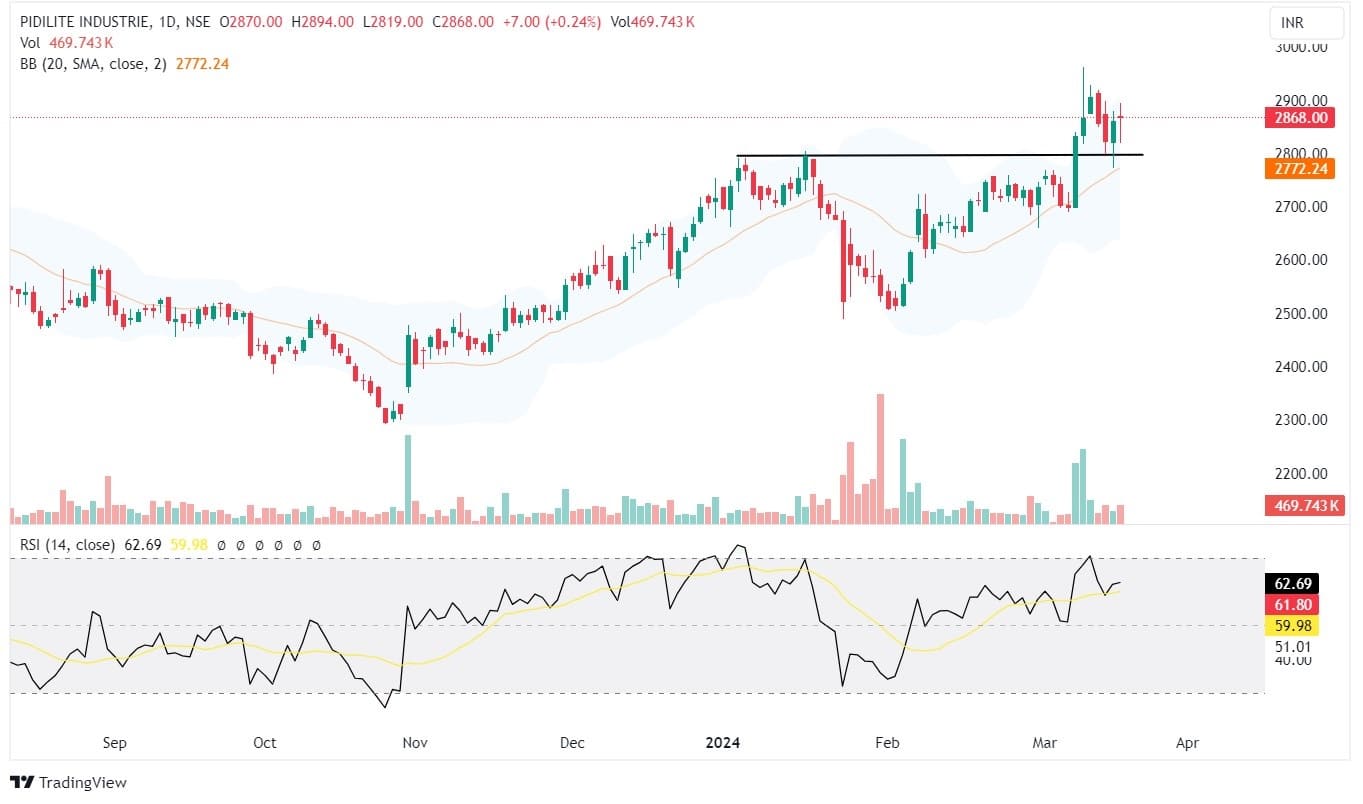
Pidilite Industries: Buy | LTP: Rs 2,868 | Stop-Loss: Rs 2,770 | Target: Rs 3,050 | Return: 6 percent
The stock formed higher highs and higher lows in the daily chart. It is trading above 20 and 50 DMA (days moving average) indicating strength in price action.
The positive crossover is indicated in MACD (moving average convergence divergence) while RSI (relative strength index) stands at 70 levels.
The stock is sustaining above the Rs 2,800 levels (crucial resistance) with decent volumes pointing out buying interest among short-term traders.
Hence, based on the above technical structure, one can initiate a long position at CMP Rs 2,868 for a target price of Rs 3,050. The stop-loss can be kept at Rs 2,770.
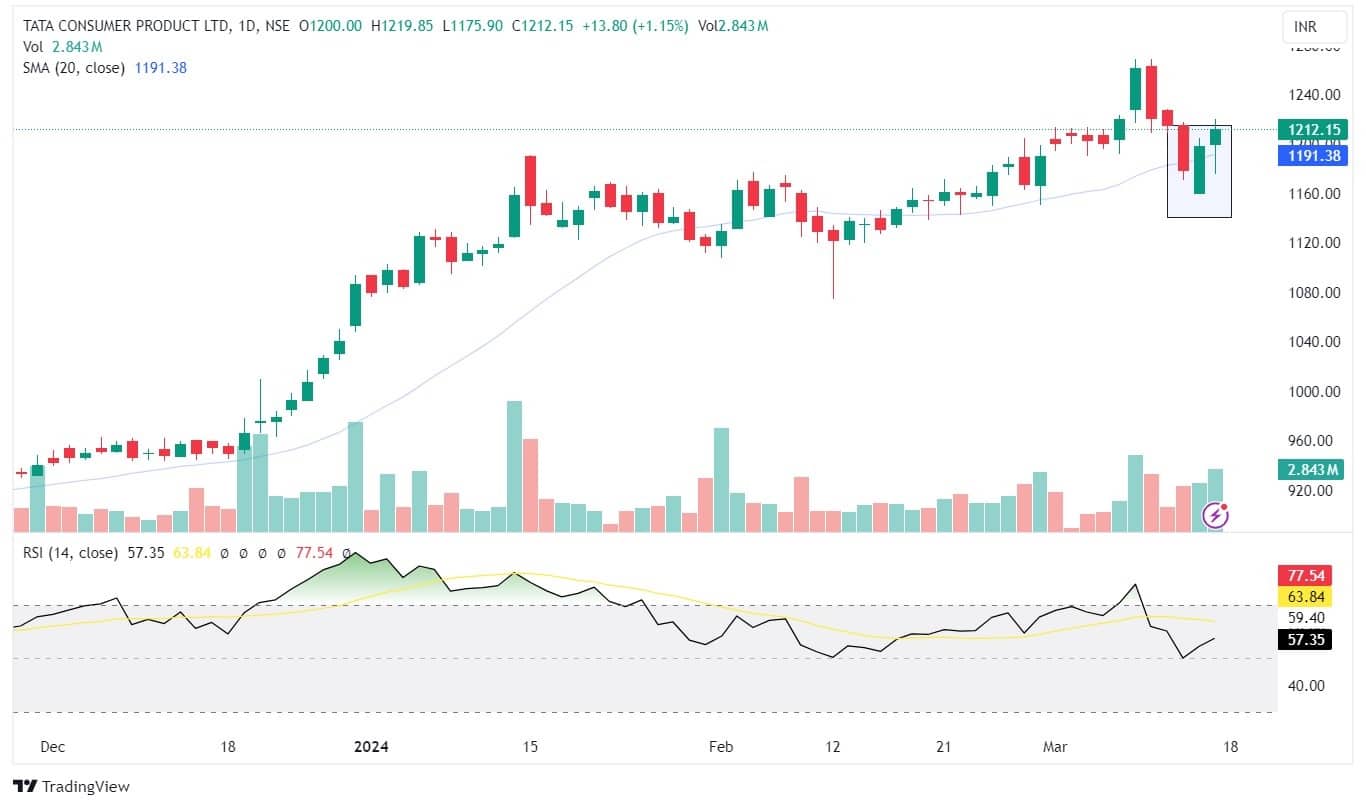
Tata Consumer Products: Buy | LTP: Rs 1,212 | Stop-Loss: Rs 1,155 | Target: Rs 1,310 | Return: 8 percent
After a decent correction, the stock reveals a strong recovery, forming a sturdy base around Rs 1,160 levels. The stock is currently trading above the 20 SMA (simple moving average) indicating positive momentum. The daily chart reveals price is ticking up with a rise in trading volumes. The RSI is gradually inching higher suggesting bullishness in stock.
Hence, based on the above technical structure, one can initiate a long position at CMP Rs 1,212 for a target price of Rs 1,310. The stop-loss can be kept at Rs 1,155.
Expert: Jigar Patel, senior manager - equity research at Anand Rathi
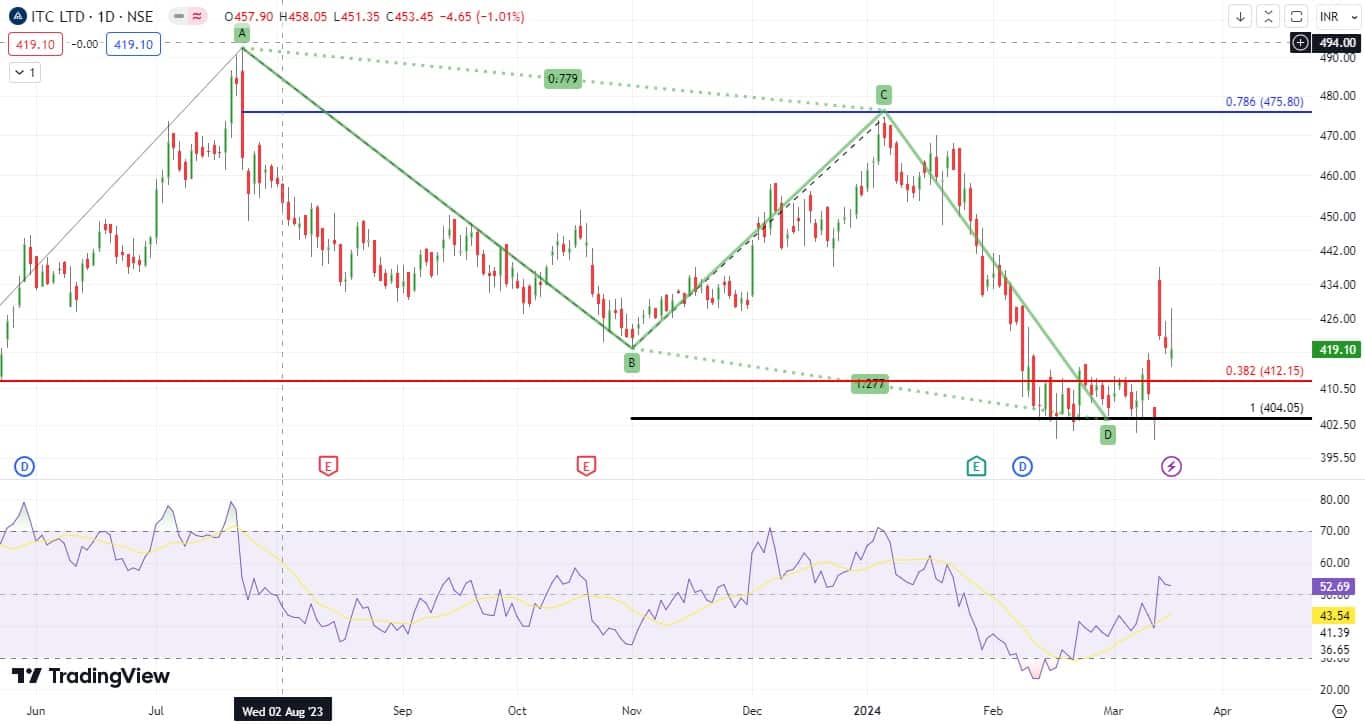
ITC: Buy | LTP: Rs 419 | Stop-Loss: Rs 390 | Target: Rs 475 | Return: 13 percent
After reaching a peak near Rs 475 mark on January 4, 2024, ITC has experienced a significant decline of 16 percent. However, in the subsequent 18 trading sessions, ITC has shown stability by avoiding further declines and has instead consolidated within a range of Rs 400-416. Notably, in the previous trading session, there was notable buying interest observed at lower levels, accompanied by substantial trading volume.
From a technical standpoint, the formation of a bullish AB=CD pattern on the daily chart of ITC within the mentioned price zone of Rs 400-416. Interestingly, this zone also coincides with the 0.382 percent retracement level of a price swing that occurred between January 2023 and July 2023, as indicated on the chart.
Additionally, it has formed complex structure forming on the daily RSI indicator, resembling a 'W shape' below the 30 level, which suggests a potentially lucrative buying opportunity.
Thus, one can buy in the zone of Rs 415-425 with an upside target of Rs 475 and a stop-loss would be placed near Rs 390 on a daily close basis.
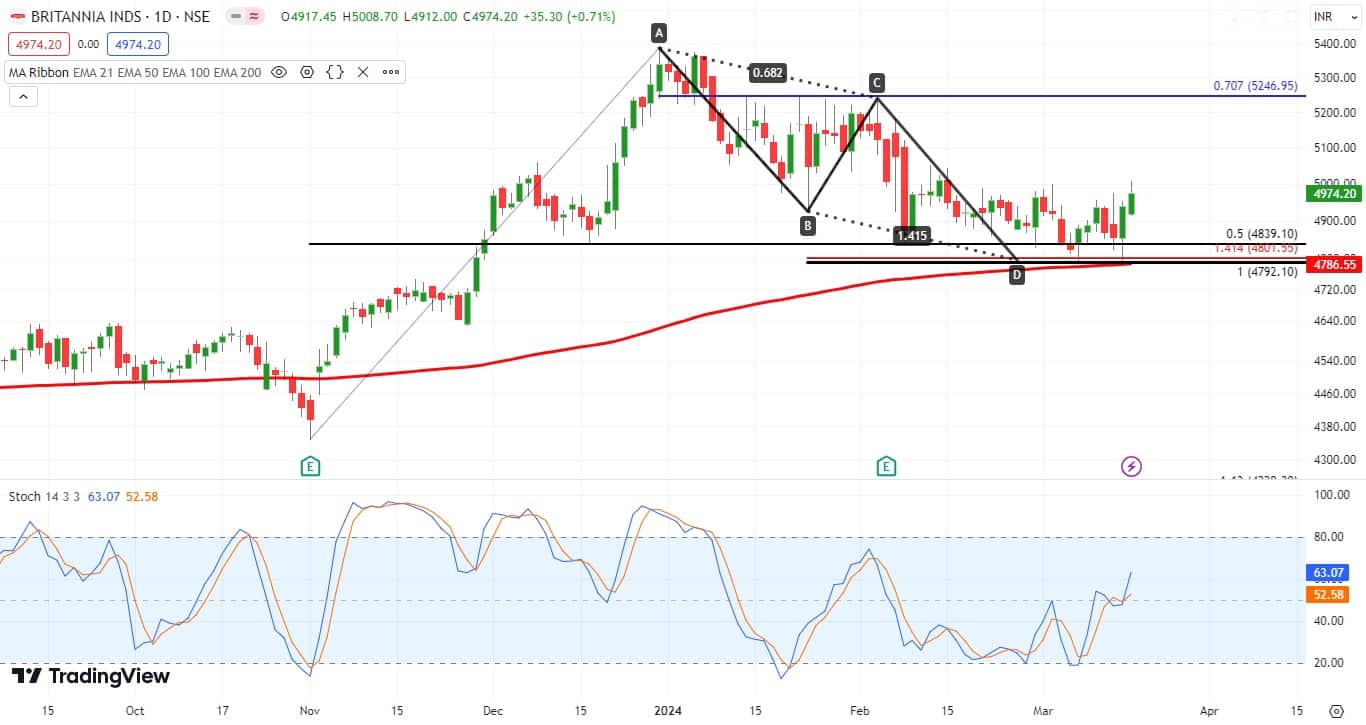
Britannia Industries: Buy | LTP: Rs 4,974 | Stop-Loss: Rs 4,790 | Target: Rs 5,250 | Return: 5.5 percent
Following a peak near Rs 5,386 level, Britannia experienced a significant decline of almost 11 percent in its value. However, over the past couple of months, Britannia has stabilized around Rs 4,800 levels, forming a prolonged support base. Notably, this level coincides with the 200-day exponential moving average (DEMA) and represents a 50 percent retracement of its previous upward movement from November 2023 to December 2023, as depicted in the provided chart.
Additionally, a bullish AB=CD pattern has emerged near Rs 4,800 level, further confirming positive market sentiment. Furthermore, the daily stochastic indicator indicates a bullish divergence, suggesting a favourable outlook for the
Therefore, investors may consider initiating buy positions within the range of Rs 4,950-4,980, targeting an upside objective of Rs 5,250, with a stop-loss set at Rs 4,790 on a daily closing basis.
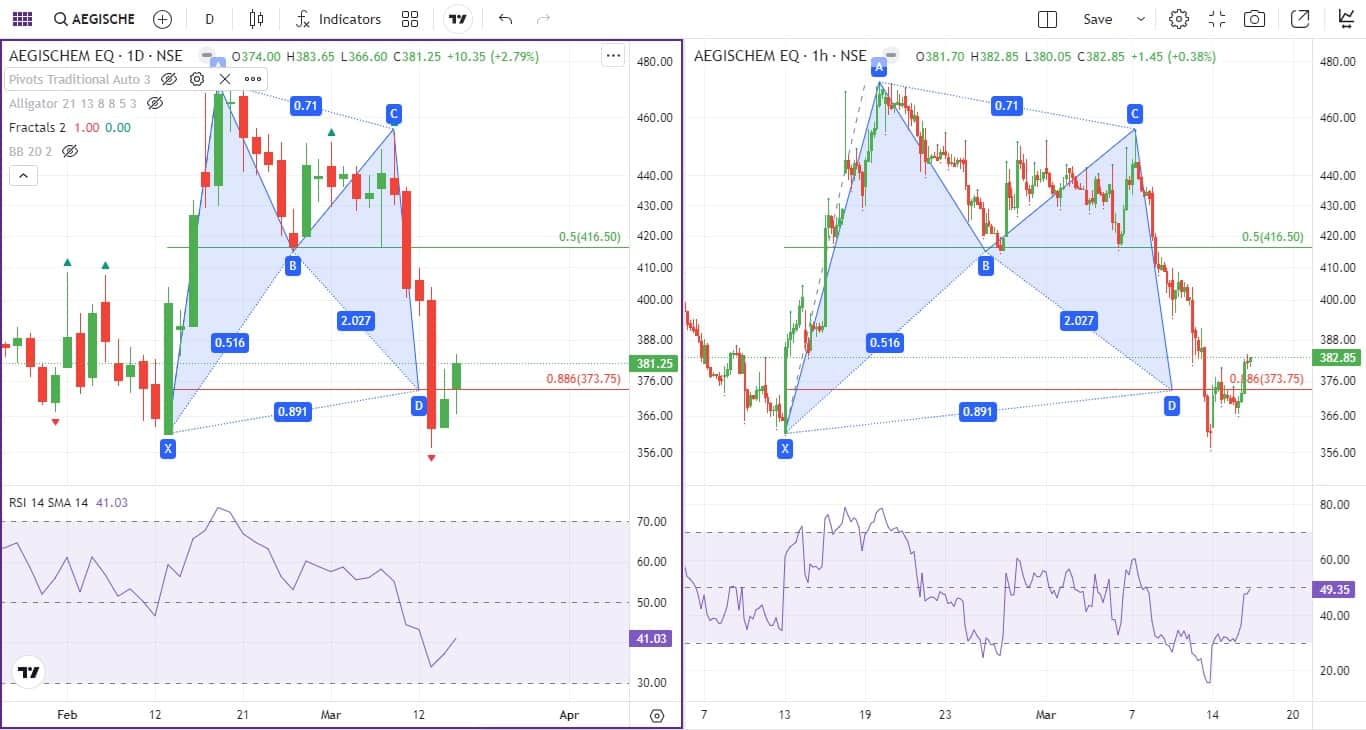
Aegis Logistics: Buy | LTP: Rs 381 | Stop-Loss: Rs 355 | Target: Rs 430 | Return: 13 percent
On March 7, 2024, Aegis Logistics reached a high of Rs 455. Since then, it has experienced a significant decline of 21.5 percent in its price. Presently, the stock has found support at the 200-day exponential moving average (DEMA). Additionally, on the hourly chart, a bullish BAT pattern has formed in the range of Rs 360-370 levels, coinciding with the vicinity of the 200 DEMA.
Furthermore, on the indicator front, the hourly RSI has displayed a complex structure near the oversold zone, indicating a bullish stance.
Given these technical indicators, investors may consider buying in the zone of Rs 375-385, with an upside target set at Rs 430. A prudent stop-loss strategy would involve placing it near Rs 355 on a daily closing basis.
Disclaimer: The views and investment tips expressed by investment experts on Moneycontrol.com are their own and not those of the website or its management. Moneycontrol.com advises users to check with certified experts before taking any investment decisions.