Discover the latest business news, Sensex, and Nifty updates. Obtain Personal Finance insights, tax queries, and expert opinions on Moneycontrol or download the Moneycontrol App to stay updated!
The difference between GDP and GVA is based on the growth rated in taxes and subsidies.
The National Statistics Office (NSO) at the Ministry of Statistics and Programme Implementation recently released a press note on the GDP (Gross Domestic Product) estimates for third quarter (Q3) 2023-24 and also the second advance estimates for the entire year 2023-24.
The NSO noted that the GDP growth for Q3 2023-24 was expected at 8.4 percent and for the entire 2023-24 at 7.6 percent. In the first advance estimates in January 2024, NSO had estimated annual GDP growth for 2023-24 at 7.3 percent. The data completely surprised markets which had expected GDP growth for Q3 2023-24 at 6.5 percent.
On a closer look at the data, analysts found that there was a large gap between GDP and GVA (Gross Value Added). While GVA is expected to grow at 6.5 percent in Q3 2023-24, the GDP is expected to grow at 8.4 percent. The wide variation puzzled markets and has led to a lot of discussions in the financial media.
We need to understand some basics to understand the puzzle.
The statistical authorities calculate GDP via three methods: Production/Sectoral, Expenditure, and Income. For the context of this article, we focus on the production approach.
Under the production approach, we first compute the value added by the three major sectors - Agriculture, Industry and Services. The sum of value addition is called GVA. Further, if we add product taxes and subtract product subsidies from GVA, we get GDP. Product taxes include Goods & Services Tax (after 2017), excise duties, sales tax, service Tax and Import & Export duties. Product subsidies include subsidies on food, petroleum and fertilizers. Thus, the difference between GDP and GVA is based on the growth rated in taxes and subsidies.
High Growth Rate Of Product Taxes
Given the above basics, let us now see the trends. The growth rate of product taxes has been volatile but followed an increasing trend from 2012-13 to 2018-19. The growth rates became negative for the next two years due to the pandemic. The growth rate in taxes recovered to touch 10 percent in 2022-23. In case of subsidies, there was deceleration and negative growth rates from 2012-13 to 2018-19. The growth rate in subsidies jumped significantly in 2020-22 due to pandemic, before declining in 2022-23.
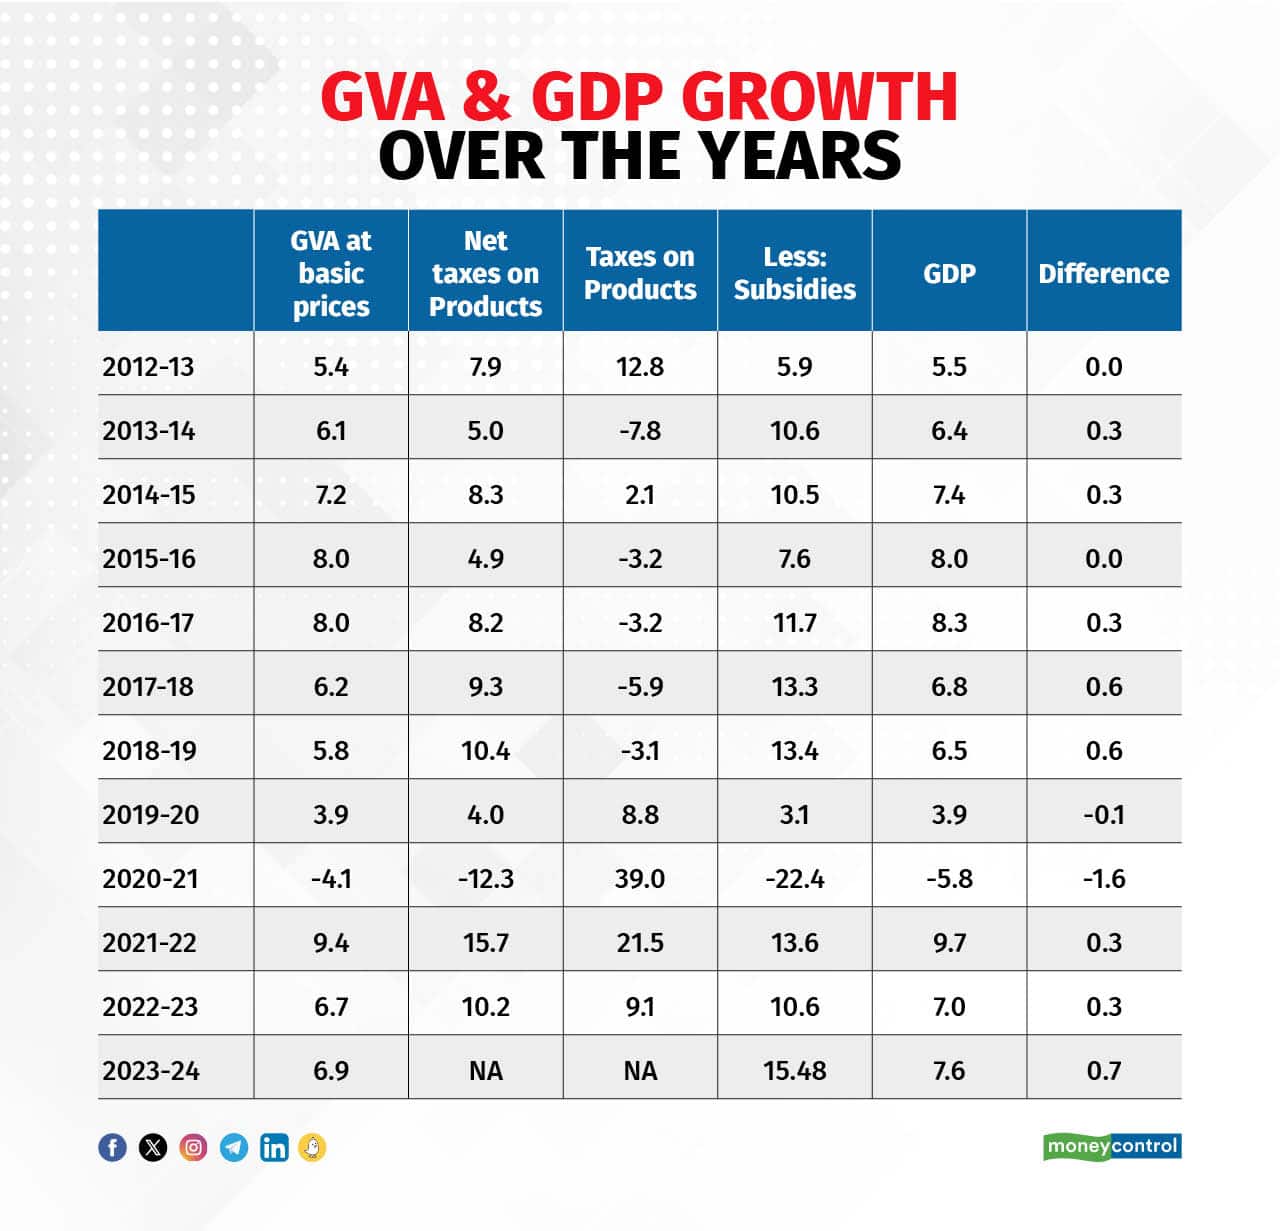
For 2023-24, the NAS has not given the data for taxes and subsidies separately. However, it has given data for Net Indirect Taxes which is taxes of products minus subsidies. We can see from the table that the growth rate on Net Indirect Taxes is the highest for the year 2023-24, which implies that the difference in growth rate between GDP and GVA is highest at 0.7 percent in 2023-24.
If we look at the long term average of GDP and GVA, the differences are marginal. The average of GVA growth in the period 2012-2023 is 5.7 percent and average of GDP growth in the same period is 5.8 percent.
Further, NAS also released GDP data for the third quarter of 2023-24. A similar analysis shows that in the third quarter 2023-24 the difference between GDP and GVA is highest at 1.9 percent. This spike in the third quarter has alone led to the difference between GDP and GVA as the first and second quarter difference is really marginal.
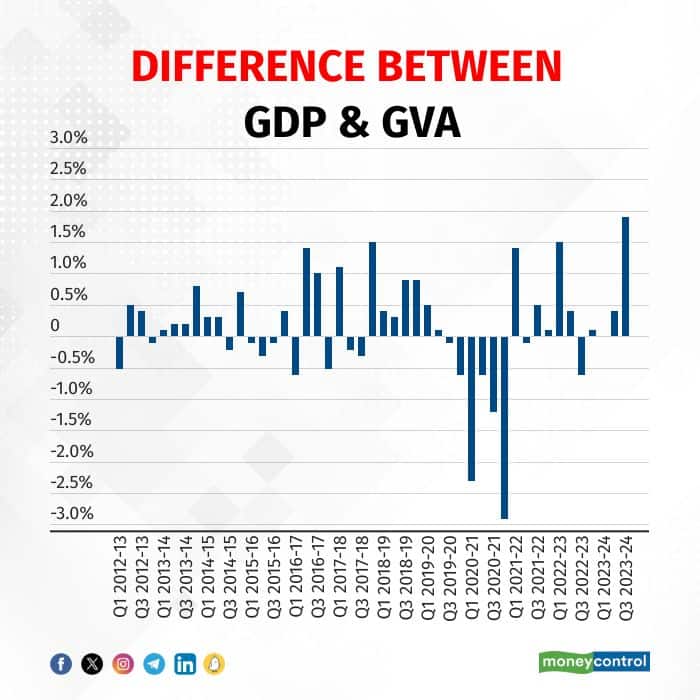
What explains such a large difference between GVA and GDP? Most likely the government might have not spent on the subsidies while the tax flows especially GST has been highly robust. The markets are speculating that given it is election year, a higher than expected GDP growth rate will boost political prospects of the incumbent political party.
Challenge Of Continuous Revisions
Interestingly, the second highest difference between GDP and GVA is in the year 2018-19, which coincides with the period during the previous Lok Sabha election. However, one has to be careful before jumping to any conclusions as the GDP data is revised significantly in multiple stages. At the time of the last Lok Sabha elections, the second advance estimates had expected GVA and GDP growth at 6.8 percent and 7 percent respectively. As per the final estimates, GVA and GDP growth were revised lower at 5.8 percent and 6.5 percent respectively.
It is important to note that the difference between GDP and GVA was higher in the final estimates and not in the advance estimates. One would like to do similar analysis for GDP and GVA numbers during earlier Lok Sabha election cycles as well. But the data is not as readily available.
To sum up, the recently released GDP data created a flutter in the markets. The several market analysts have not just revised their GDP projections upwards for 2023-24 but also for 2024-25. A deeper dive into the data suggests the wide difference between GDP and GVA. This is also not a new problem. The former RBI Governor D Subbarao, in a 2012 speech, had highlighted differences between GDP and GVA.
Apart from differences between GDP and GVA, the macroeconomic data in India and even in most parts of the world, is always revised leading to confusions. AK Bhattacharya, in this article, points out how GDP data is revised over six cycles from first advance estimates to third revised estimates.
D Subbarao in a 2011 speech lamented how policymaking in India is complex given the multiple revisions of data. He quoted Groucho Marx who said: “Never make a forecast, especially about the future”. The quote sums up the dilemma for Indian economy’s policymakers.
Amol Agrawal teaches at Ahmedabad University, and is the author of 'History of Private Banking in South Canara district (1906-69)’. Views are personal, and do not represent the stand of this publication.