Discover the latest business news, Sensex, and Nifty updates. Obtain Personal Finance insights, tax queries, and expert opinions on Moneycontrol or download the Moneycontrol App to stay updated!
PIck these 3 stock ideas for double-digit return
By Vidnyan Sawant, HOD - Research at GEPL Capital
After consolidating for two months, the Nifty index is now displaying signs of breaking out, reaching fresh all-time highs and forming higher tops and higher bottoms on the monthly timeframe, indicating bullish strength for the longer term.
On the weekly charts, the Nifty has been consistently hitting record highs over the past three weeks and maintaining levels near the top, indicating strong confidence among market participants.
In the shorter term, particularly on the daily timeframe, the index has been exhibiting a positive structure with higher highs and higher lows, while finding solid support at the 34-day EMA (exponential moving average) for the past three months.
Key technical indicators such as the relative strength index (RSI) are also favourable, with readings above 65 across daily, weekly, and monthly intervals, signaling positive momentum.
Looking forward, immediate resistance levels are noted at 22,780, representing Fibonacci Extension levels, with further resistance at 23,000. Crucial support levels are identified at 22,000 and 21,800.
Given the current chart patterns, a strong bullish phase is anticipated. It is recommended to consider buying at the current market price, with potential upside targets ranging from 22,780 to 23,000 levels. To effectively manage risks, it is advised to implement a strict stop-loss at 22,000 on a closing basis.
Here are three buy calls for the next 2-3 weeks:
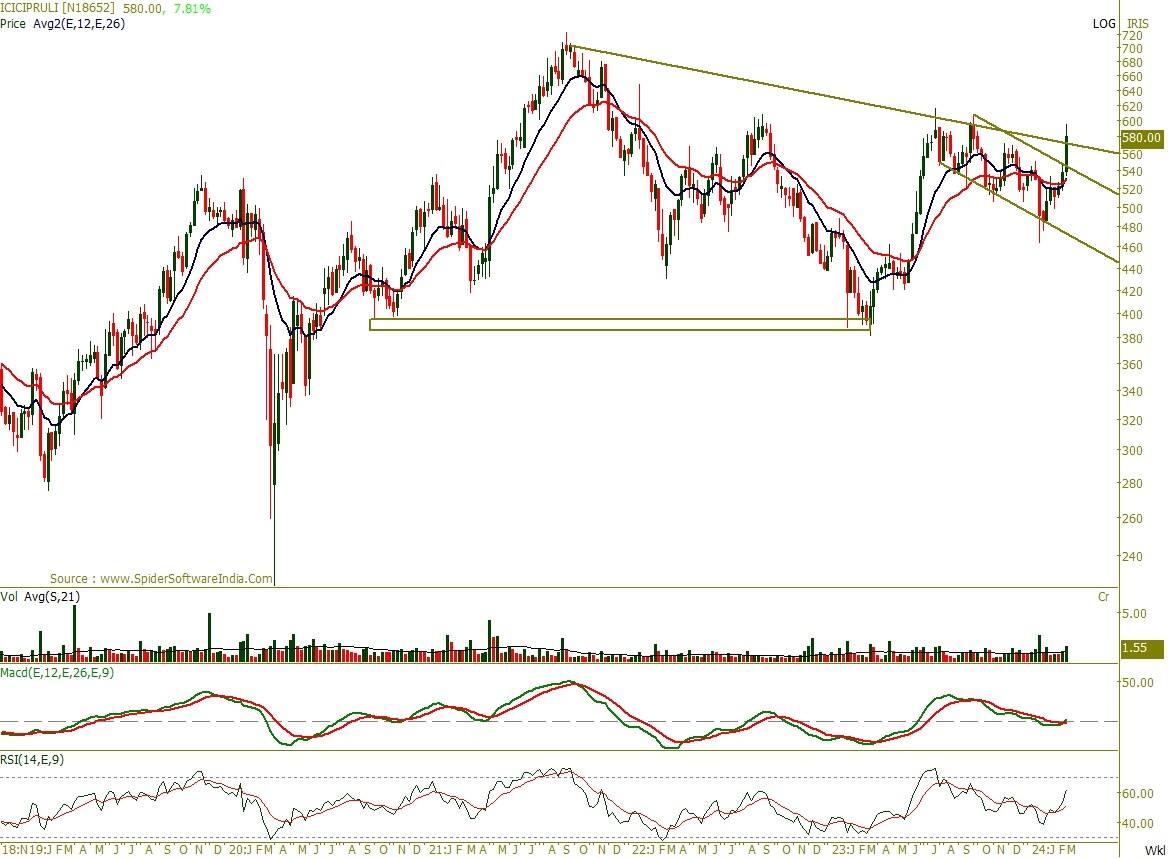
ICICI Prudential Life Insurance Company: Buy | LTP: Rs 583.6 | Stop-Loss: Rs 533 | Target: Rs 696 | Return: 19 percent
ICICI Prudential Life has demonstrated remarkable resilience, notably since hitting its 52-week low in March 2023. The stock has been consistently advancing within a bullish trajectory. In a recent noteworthy development, the stock has broken out of a Flag and Pole chart pattern, coinciding with a downward sloping channel originating from its September 2021 all-time high. This breakout was accompanied by a significant surge in trading volume, surpassing the 21-week average volume, indicating positive momentum.
Additionally, ICICI Prudential Life has maintained its position above both the 12-week and 26-week exponential moving averages (EMA), further consolidating the bullish trend.
Momentum indicators such as the RSI and Moving Average Convergence Divergence (MACD) support this bullish sentiment. The MACD has signaled a positive crossover, while the RSI stands at a robust 60, indicating the strength of the trend by substantial momentum.
Looking forward, there is an anticipation of further price ascent towards Rs 696 mark. It is recommended to set a stop-loss at Rs 533, strictly based on the closing basis.
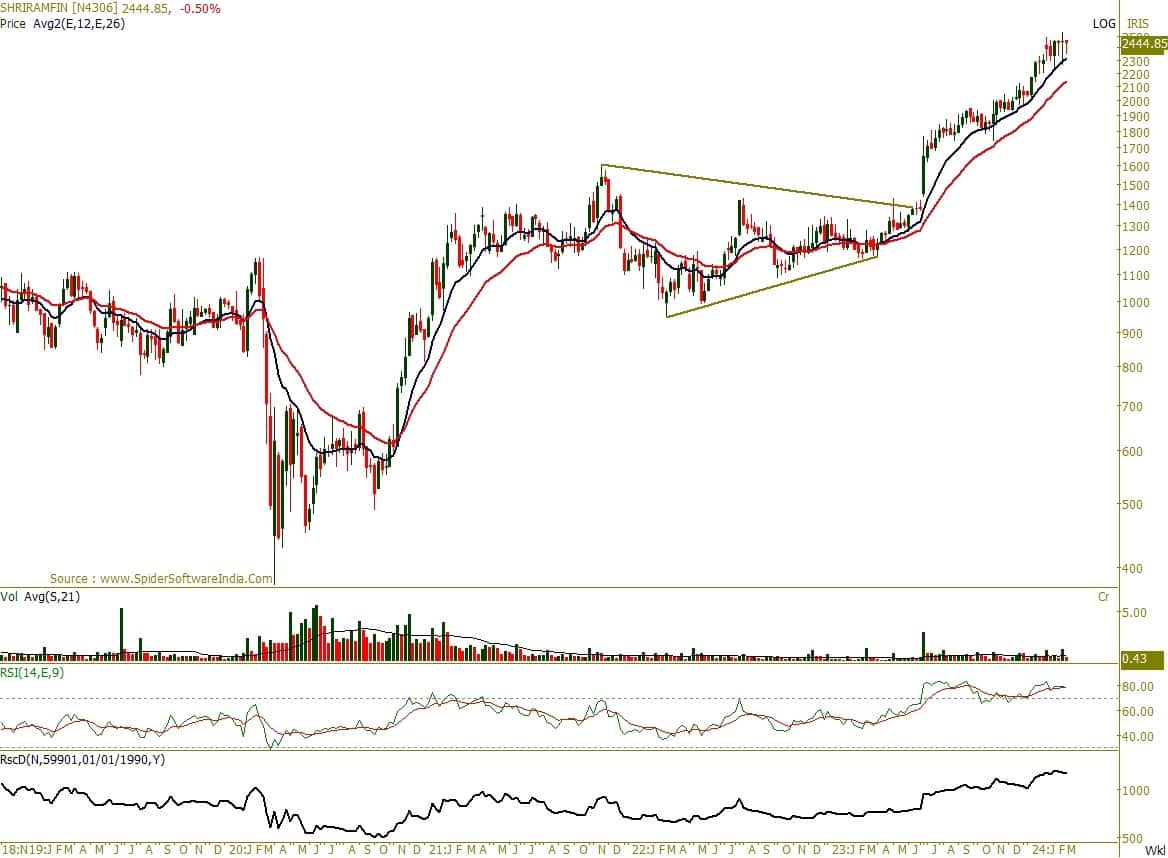
Shriram Finance: Buy | LTP: Rs 2449.55 | Stop-Loss: Rs 2,249 | Target: Rs 2,885 | Return: 18 percent
Since March 2022, Shriram Finance has demonstrated a robust price structure, characterized by a consistent upward trend. Notably, in June 2023, the stock broke out of a volatility contraction pattern (VCP), leading to the formation of higher highs and higher lows. This trend signifies a bullish momentum.
Moreover, Shriram Finance has shown a strong adherence to the 12-week and 26-week moving averages, indicating the strength of the prevailing trend.
The momentum of Shriram Finance is further supported by the RSI, which has consistently remained above 60 across various timeframes. This suggests sustained strength in the upward trajectory of the stock.
Furthermore, when comparing Shriram Finance to the Nifty through a ratio chart, there's a continuous upward trend, indicating persistent outperformance compared to the broader market.
Going ahead, we expect the prices to go higher till the level of Rs 2,885, the bullish view will be negated if we see prices sustaining below Rs 2,249 level.
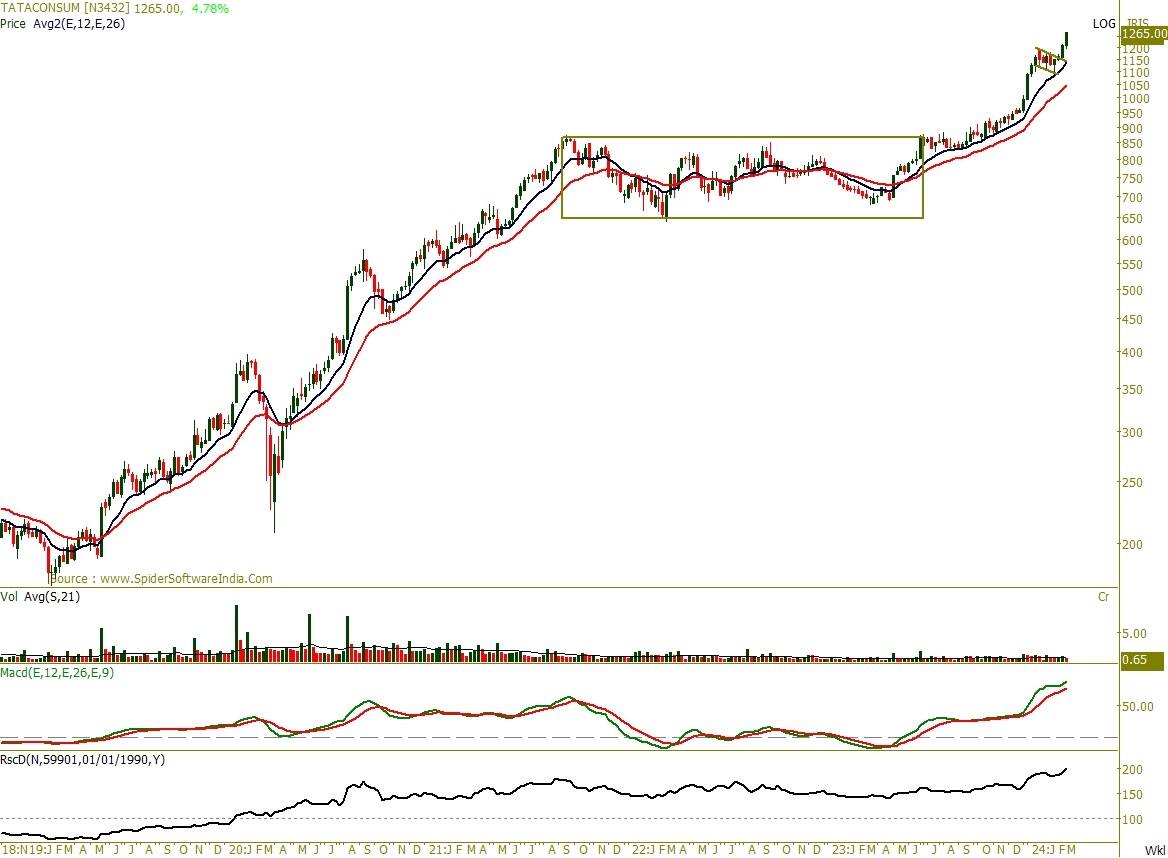
Tata Consumer Products: Buy | LTP: Rs 1,261.55 | Stop-Loss: Rs 1,163 | Target: Rs 1,518 | Return: 20 percent
Tata Consumer Products demonstrates a robust price structure, with a clear uptrend observable since October 2001, characterized by higher highs and higher lows over the long term. Presently, the stock is maintaining its position above the congestion zone and is trading at its all-time high, indicating significant strength in the current uptrend.
The trend support is further strengthened by the stock's ability to remain above both the 12-week and 26-week moving averages. Additionally, a bullish crossover on the MACD indicator occurring in positive territory adds momentum to the ongoing upward trend, affirming the bullish sentiment surrounding Tata Consumer Products.
Moreover, when analyzing Tata Consumer Products against the Nifty using a ratio chart, a continuous upward trend is evident, suggesting sustained outperformance compared to the broader market.
Looking forward, there is an anticipation of further price ascent towards Rs 1,518 mark. It is recommended to set a stop-loss at Rs 1,163, strictly based on the closing basis.
Disclaimer: The views and investment tips expressed by investment experts on Moneycontrol.com are their own and not those of the website or its management. Moneycontrol.com advises users to check with certified experts before taking any investment decisions.