Discover the latest business news, Sensex, and Nifty updates. Obtain Personal Finance insights, tax queries, and expert opinions on Moneycontrol or download the Moneycontrol App to stay updated!
Check the trading strategy on these 3 stocks
The ongoing market momentum, after breaking out of a phase of consolidation, seems to be gathering strength and is expected to take the Nifty 50 towards 22,500-22,600 in the coming sessions, provided the index holds the upward sloping resistance trendline, experts said, adding that the immediate support is at 22,200, followed by 22,000.
On March 2, the special live trading session, the Nifty 50 hit a new record high of 22,420, before closing with a 40-point gains at 22,378, but formed a bearish candlestick pattern on the daily charts as the closing was lower than the opening levels.
The BSE Sensex climbed 61 points to 73,806, while the performance of broader markets was better than the benchmarks as the Nifty Midcap 100 and Smallcap 100 indices gained seven-tenth of a percent each.
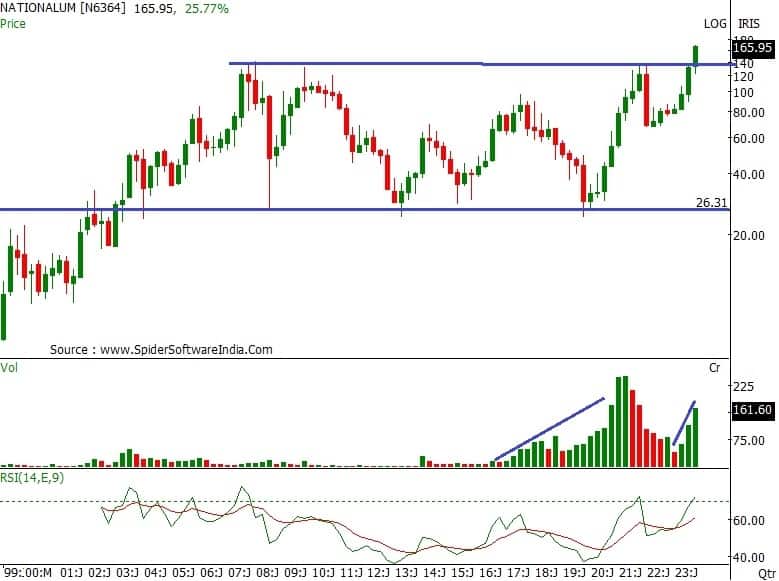
Stocks that clocked better gains than the broader markets on the special live trading session included National Aluminium Company, Jamna Auto Industries, and SAIL. National Aluminium Company extended uptrend for three consecutive session and reported 3 percent gains to end at record closing high of Rs 165.80. The stock has formed bullish candlestick pattern on the daily charts and traded well above all key moving averages.
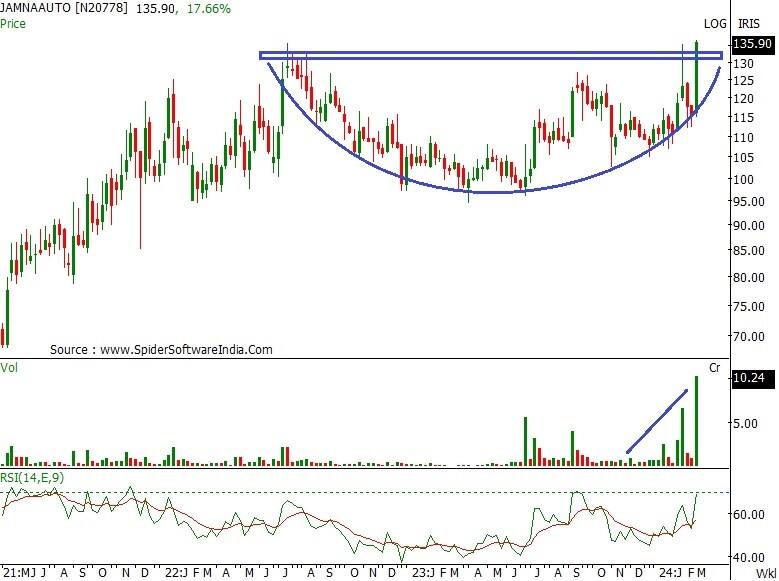
Jamna Auto Industries also ended at new closing high of Rs 135.70, up 4.2 percent and formed long bullish candlestick pattern on the daily charts. The stock traded way above all key moving averages, which is a positive sign.
Steel Authority of India (SAIL), too, traded above all key moving averages. The stock rallied 3.5 percent to Rs 137.65 on the NSE, in addition to nearly 10 percent gains in previous session, and formed bullish candlestick pattern on the daily timeframe.
Here's what Rajesh Palviya of Axis Securities recommends investors should do with these stocks when the market resumes trading today:
On the monthly chart, the stock has surpassed its "multi-year resistance" zone of Rs 134 on closing basis indicating strong comeback of bulls. This breakout is accompanied with huge volumes which shows increased participation on rally.
The stock is strongly supported with its 20, 50 ,100 and 200-day SMA (simple moving average) support which reconfirms bullish trend. In the weekly time frame, the stock has confirmed "rounding bottom" formation breakout at Rs 134 levels indicating positive bias.
The daily, weekly and monthly strength indicator RSI (relative strength index) is in positive terrain which shows sustained strength.
Investors should buy, hold and accumulate this stock with an expected upside of Rs 200-230, with downside support zone of Rs 150-130 levels.
On the weekly time frame, the stock has confirmed "Rounding Bottom" formation breakout at Rs 133 levels on a closing basis. Huge volume on this breakout signifies increased participation.
The daily, weekly and monthly "Bollinger band" buy signals indicate increased momentum. The stock has registered an all-time high at Rs 136.50 levels indicating bullish sentiments. The stock is well placed above its 20, 50, 100 and 200-day SMA's and these averages are also inching up along with rising prices which reconfirms bullish trend.
Investors should buy, hold and accumulate this stock with an expected upside of Rs 165-178, with downside support zone of Rs 128-118 levels.
In the short to medium term time frame, the stock is in strong uptrend forming a series of higher tops and bottoms indicating positive bias. Since the past 3-4 months the stock has observed huge volumes indicating increased participation.
On the weekly chart, the stock is on the verge of 'rounding bottom" formation breakout at Rs 151 levels, hence any upcoming weekly close above the same may lead huge upside momentum. The daily, weekly and monthly strength indicator RSI (relative strength index) is in positive terrain which shows sustained strength.
Investors should buy, hold and accumulate this stock with an expected upside of Rs 151-185, with downside support zone of Rs 120-115 levels.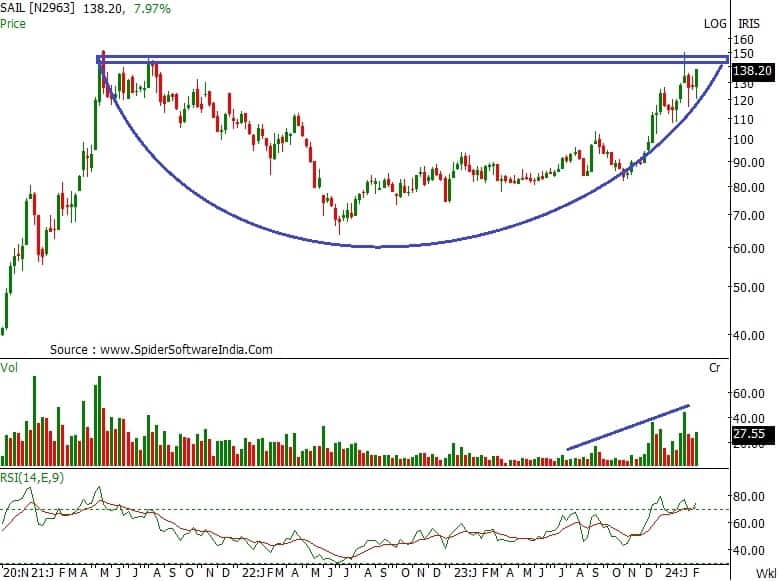
Disclaimer: The views and investment tips expressed by investment experts on Moneycontrol.com are their own and not those of the website or its management. Moneycontrol.com advises users to check with certified experts before taking any investment decisions.