Discover the latest business news, Sensex, and Nifty updates. Obtain Personal Finance insights, tax queries, and expert opinions on Moneycontrol or download the Moneycontrol App to stay updated!
Expert recommends trading strategy for these 3 stocks
With the ongoing optimism and the index holding above the 21,850 level, the Nifty 50 may possibly try to climb beyond the psychological 22,000 mark in the coming sessions and if the index closes decisively above the same then a record high of 22,126 can't be ruled out soon, experts said, adding the immediate support is seen at 21,800 and crucial at 21,500 levels.
On February 15, the benchmark indices gained for the third consecutive session. The Nifty 50 rose 71 points to 21,911 and the BSE Sensex climbed 228 points to 72,050, while the Nifty Midcap 100 and Smallcap 100 indices gained 1 percent and 1.3 percent on positive breadth.
Stocks that outperformed the broader markets on Thursday included Federal Bank, NTPC, and Bank of Baroda. Federal Bank is very close to its record high of Rs 159.30 seen on December 20. The stock has rallied 4.8 percent to Rs 156.60 and formed a robust bullish candlestick pattern on the daily charts with strong volumes after decisively breaking out of the downward sloping resistance trendline adjoining multiple touchpoints, which is a positive sign.
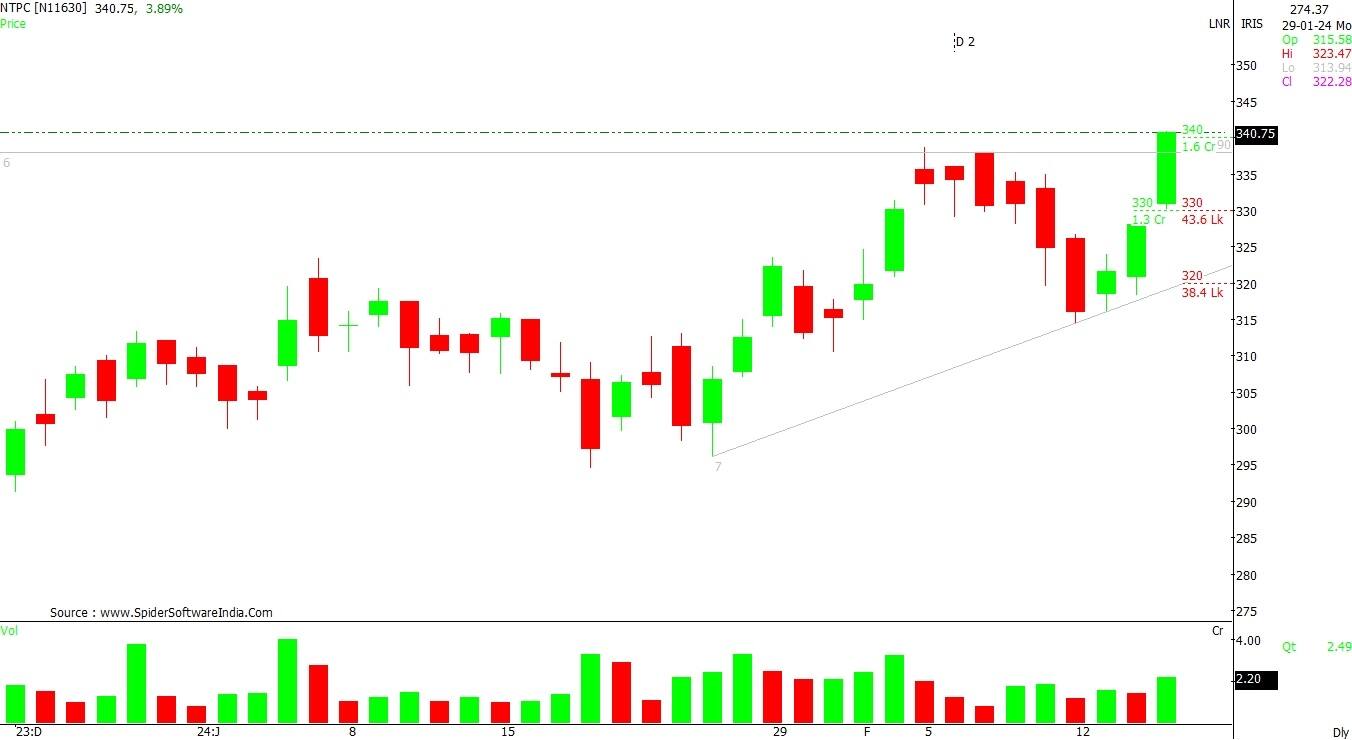
NTPC ended at record closing high of Rs 339, up 3.4 percent and formed bullish candlestick pattern on the daily timeframe with above average volumes, continuing uptrend for three days in a row. The stock traded well above all key moving averages which is a positive sign.
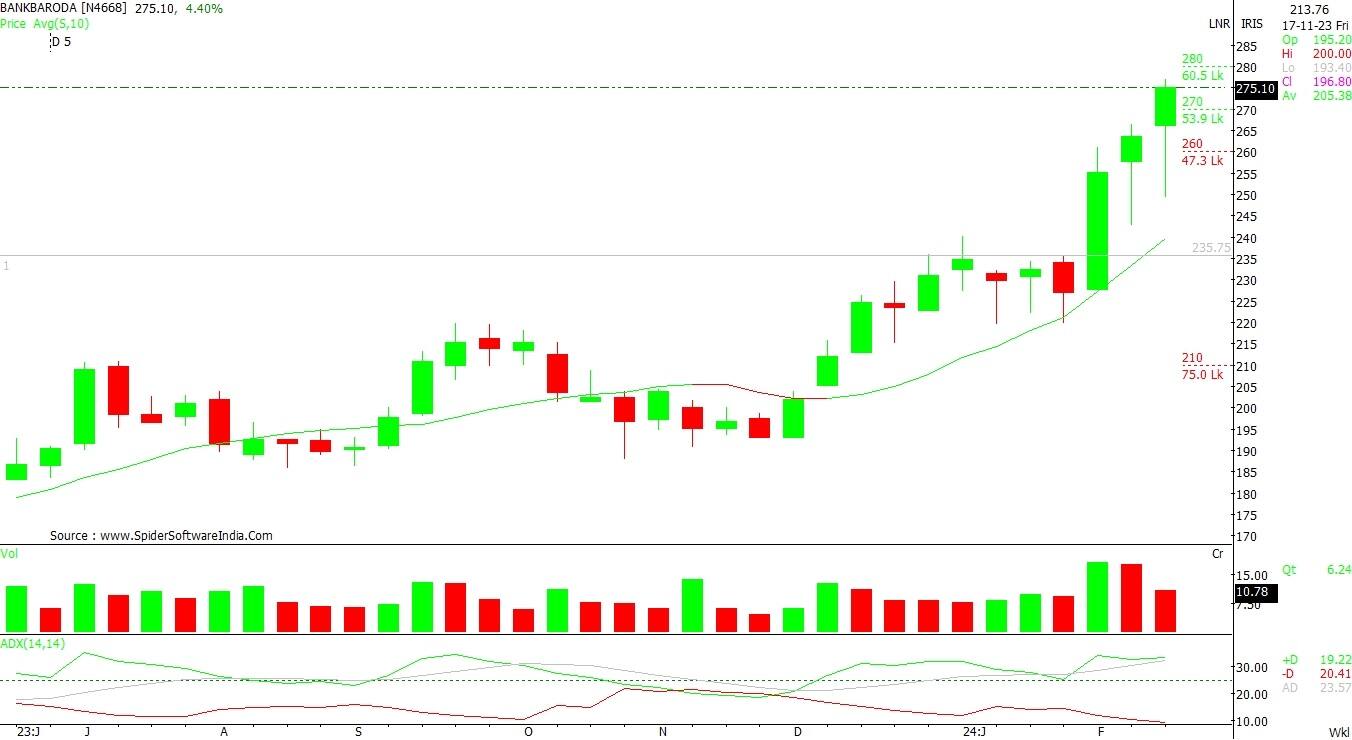
Bank of Baroda, too, saw new closing high of Rs 275.70, up 3 percent and formed bullish candlestick pattern on the daily charts with above average volumes. Further, the stock gained for third consecutive session and traded above all key moving averages.
Here's what Shrikant Chouhan of Kotak Securities recommends investors should do with these stocks when the market resumes trading today:
Post short-term correction, the counter was in a consolidation mode in a triangle formation. However, it has given a breakout of its Symmetrical Triangle chart pattern with a strong bullish candlestick pattern.
Moreover, on the daily charts, it has formed a higher bottom formation, therefore the structure of the counter indicates further bullish momentum from the current levels. Unless it is trading below Rs 150, positional traders can retain an optimistic stance and look for a target of Rs 170.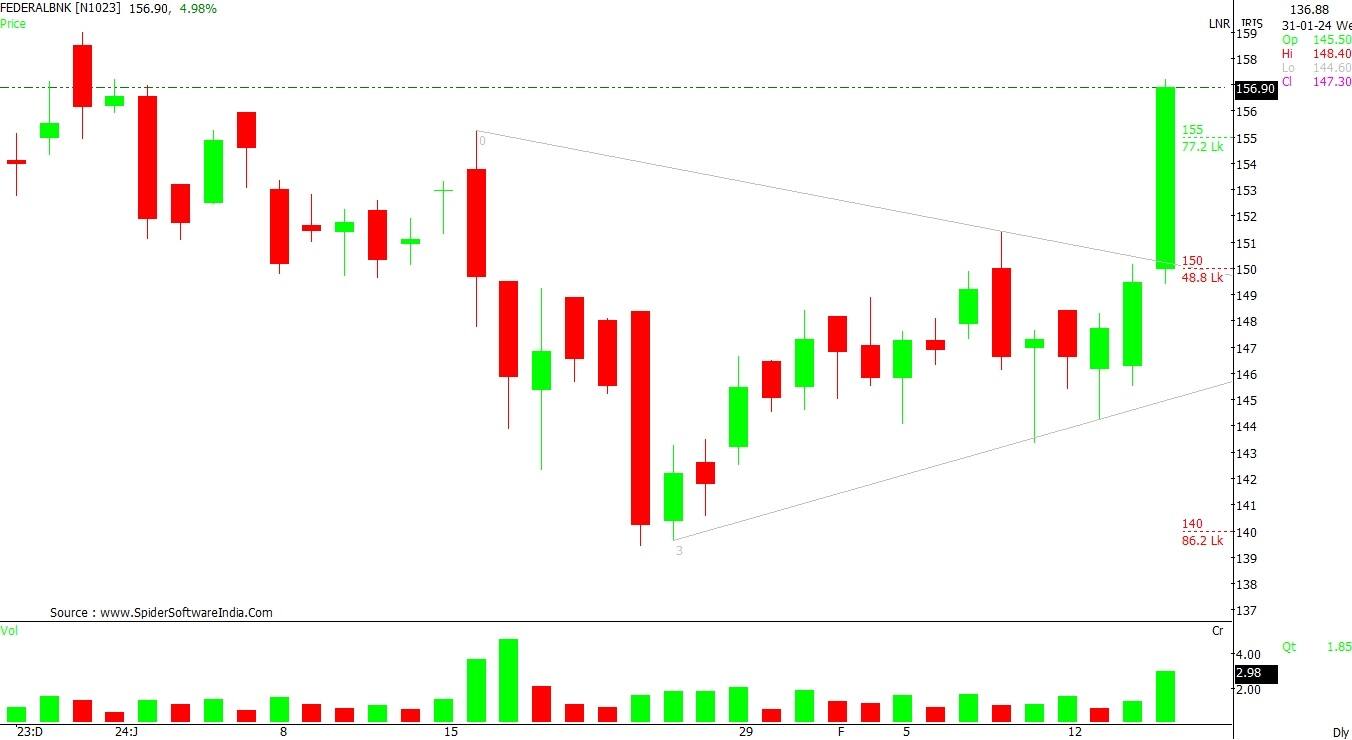
The stock has given a breakout of its Ascending Triangle chart pattern on the daily scale. Additionally, it has formed a higher bottom formation along with incremental volume activity, hence the structure of the stock indicates the beginning of a new up move from the current levels.
For positional traders, Rs 325 would be the trend decider level. Trading above the same uptrend formation will continue till Rs 365. However, if it closes below Rs 325, traders may prefer to exit from trading long positions.
On the daily and weekly scale, the counter is trading into a rising channel chart formation with higher high and higher low series pattern consistently. The technical indicator like ADX (average directional index) is also indicating further up trend from current levels which could boost the bullish momentum in coming horizon.
As long as the counter is trading above Rs 265, the uptrend formation is likely to continue. Above which, the counter could move up to Rs 295 levels.
Disclaimer: The views and investment tips expressed by investment experts on Moneycontrol.com are their own and not those of the website or its management. Moneycontrol.com advises users to check with certified experts before taking any investment decisions.