Discover the latest business news, Sensex, and Nifty updates. Obtain Personal Finance insights, tax queries, and expert opinions on Moneycontrol or download the Moneycontrol App to stay updated!
Expert bets on these 3 stocks for return up to 20%
It appears that the week ended February 9 was characterised by significant volatility, with the India VIX reading again surpassing 15 and closing near 15.5 on a weekly scale. This suggests that market participants should brace for potentially heightened volatility in the week beginning February 12.
Regarding the Nifty index, despite attempting to break the all-time high of around 22,126.80, the index failed to do so and reversed from approximately 22,053, closing below the 21,800 mark with a weekly loss of around 0.33 percent. This indicates some resistance at the all-time high level.
Looking ahead to the current week, it's crucial for traders to closely monitor the 21,500 level, which is identified as a significant support level. A breach of this level could potentially trigger panic in the market.
On the upside, if the Nifty index manages to sustain above 21,700, there's a possibility of it retesting the 22,000–22,100 levels. This suggests that traders should keep a close eye on the key support and resistance levels and remain flexible in their trading strategies.
Bank Nifty
It seems that despite a significant rebound from the 200-day exponential moving average (DEMA), the Bank Nifty closed the week with a -0.73 percent loss, indicating some selling pressure. However, observing a bullish Bat pattern on a daily scale, suggesting potential upward momentum in the near term.
The Bank Nifty needs to hold the support of 45,000 in the current week. If the index manages to sustain above 45,000, there's a possibility of it testing the 46,500 level, indicating further bullish movement.
Conversely, a failure to maintain support at 45,000 could lead to additional selling pressure, potentially pushing the Bank Nifty down to the next support level of 44,500. The presence of a bullish trendline from the October 26, 2023, low of 42,800 further supports the idea of a potential upward trend in the Bank Nifty.
Here are three buy calls for short term:
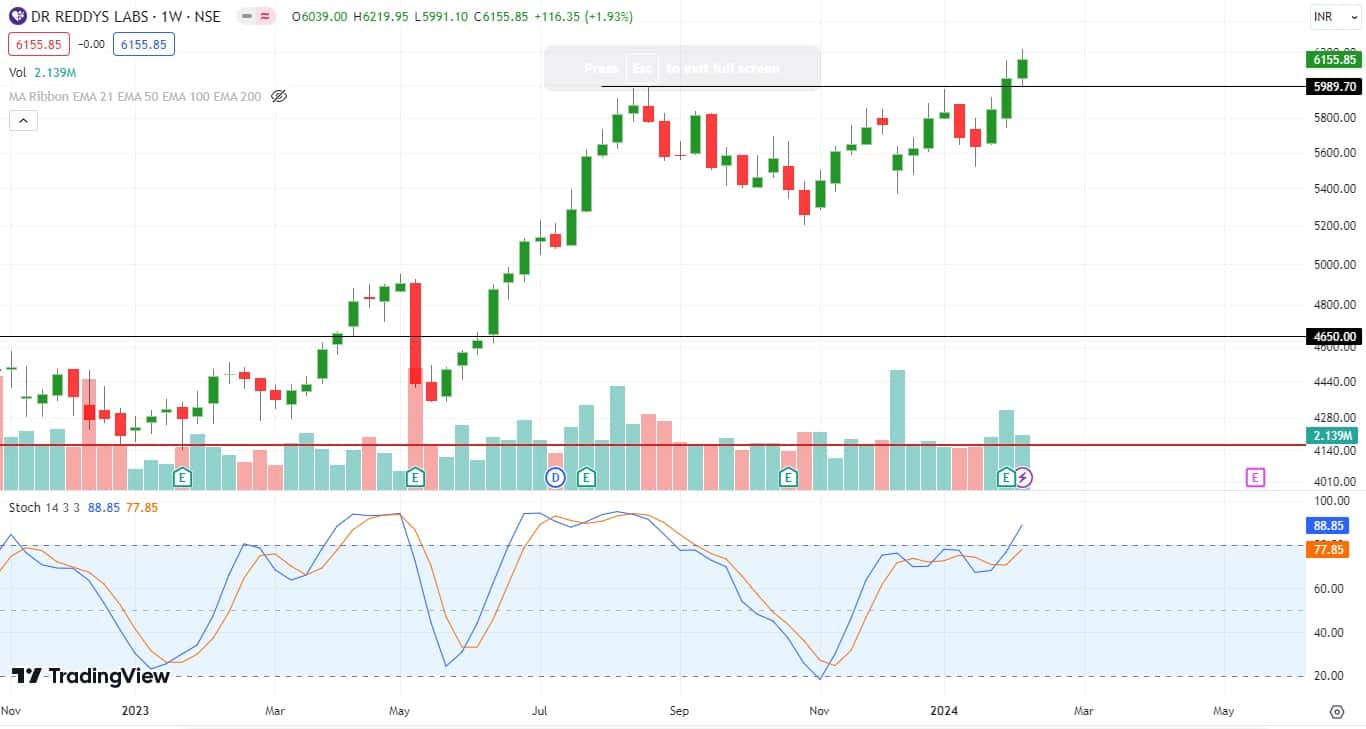
Dr Reddy's Laboratories: Buy | LTP: Rs 6,156 | Stop-Loss: Rs 5,850 | Target: Rs 6,675 | Return: 8 percent
The past few months have been good for the pharma stocks since the index Nifty Pharma surged over 20 percent from the bottom of 14,600. Although most of the heavyweight pharma participated in this rally but Dr Reddy's Labs was consolidating since many weeks.
Finally, the stock has now confirmed a breakout which resembles a bullish Cup and Handle pattern. Thus, traders are advised to buy the stock in the range of Rs 6,100-6,200 with a stop-loss of Rs 5,850 on closing basis for an upside target of Rs 6,675
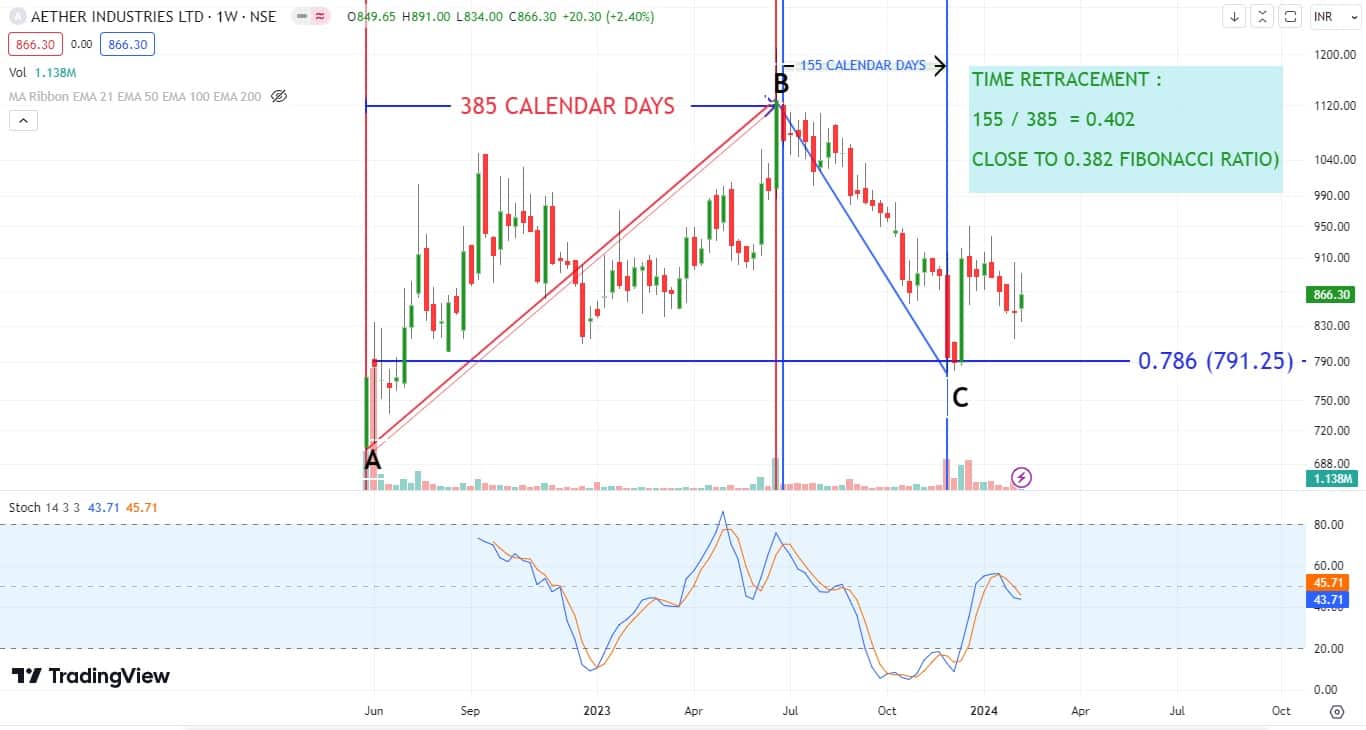
Aether Industries: Buy | LTP: Rs 866 | Stop-Loss: Rs 810 | Target: Rs 975 | Return: 13 percent
Since a month or so, the said counter has gained massive momentum from the retracement levels of its previous up move (0.786 percent), thus making it a lucrative buy. Having said that, time and price retracement are falling at the same length, which is a strong indication of bottoming out. (Time retracement is 0.382 percent and price retracement is 0.786 percent).
On the indicator front, the weekly RSI (relative strength index) has formed an impulsive structure near 30 levels, which further confirms our bullish stance on the counter. Thus, one can buy in the zone of Rs 855-870 for a target of Rs 975 and a stop-loss of Rs 810 on a daily closing basis.
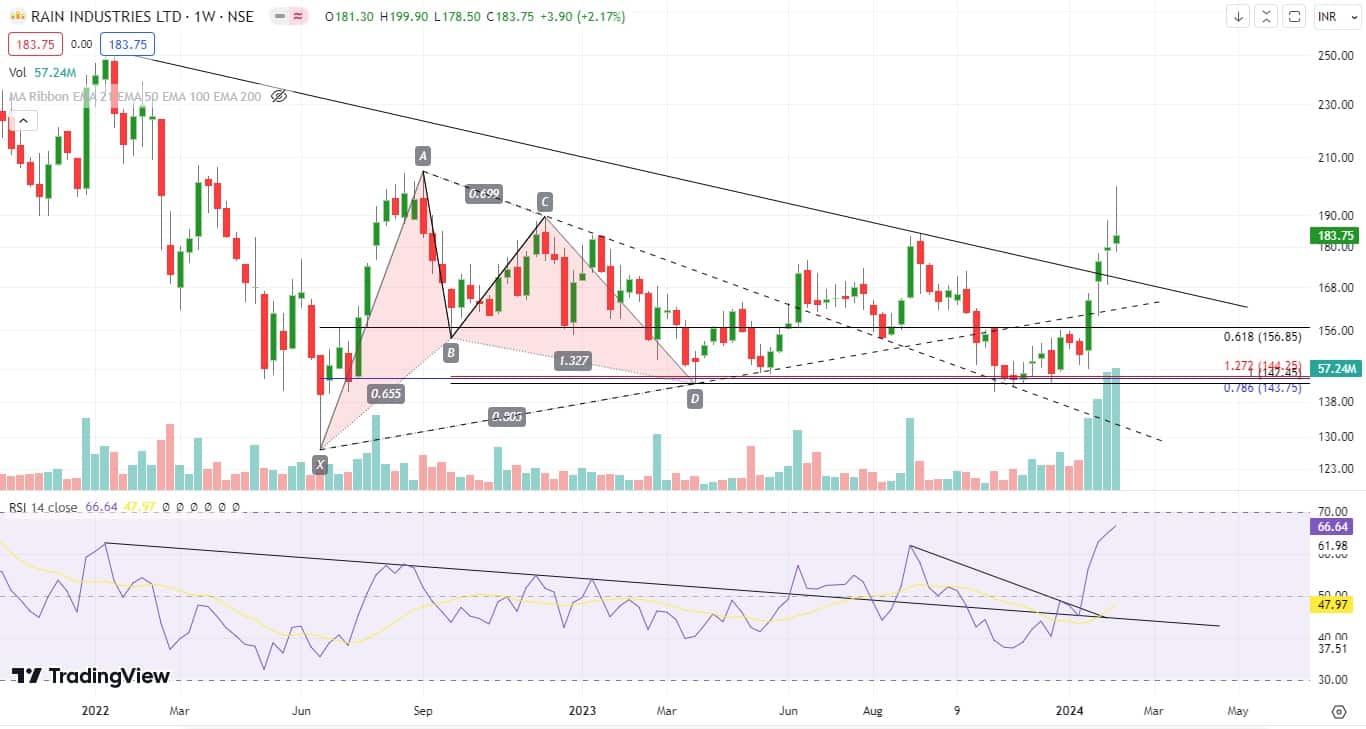
 RAIN Industries: Buy | LTP: Rs 184 | Stop-Loss: Rs 160 | Target: Rs 220 | Return: 20 percent
Since the last 2 months or so, the said counter has been consolidating between Rs 145 and Rs 155. Recently, it has given a breakout from the said range on a weekly closing basis, which is looking lucrative. Having said that, it has also formed a bullish GARTLEY pattern, which is 1.38 years old, thus making it more reliable.
Also, it has violated a couple of trendlines. The best part about this bullish reversal is that every bottom has bought with huge volume bars, which indicates bullish bias in the counter.
On the indicator front, the weekly RSI (relative strength index) has given a trendline violation, which further affirms our bullish stance on the counter. Thus, we advised traders and investors to go long in the range of Rs 175-185 with an upside target of Rs 220, and the stop-loss would be placed at Rs 160 on a daily close basis.
Note: The Gartley pattern is a harmonic chart pattern, based on Fibonacci numbers and ratios, which help traders, identify reaction highs and lows
Disclaimer: The views and investment tips expressed by investment experts on Moneycontrol.com are their own and not those of the website or its management. Moneycontrol.com advises users to check with certified experts before taking any investment decisions.