The State Of REITs: September 2023 Edition

Summary
- The REIT sector gave up some of the gains achieved in June and July, with a -4.13% average total return in August.
- Small cap REITs (-2.49%) outperformed again in August. Micro caps (-13.08%) badly underperformed their larger REIT peers.
- Only 18.06% of REIT securities had a positive total return in August, with 48.13% in the black year to date.
- Data Center (+2.03%) and Industrial (+0.93%) were the only REIT property types in the black in August. Advertising (-16.11%) and Infrastructure(-13.31%) REITs averaged the largest declines.
- The average REIT NAV discount widened from -19.78%to -22.67% during August. The median NAV discount widened from -17.37% to-20.25%.
- This idea was discussed in more depth with members of my private investing community, Portfolio Income Solutions. Learn More »
Andrii Dodonov
REIT Performance
After back-to-back strong gains in June and July, REITs lost most of their YTD gains in August with a -4.13% average total return. REITs suffered bigger average losses than the S&P 500 (-1.6%), Dow Jones Industrial Average (-2.0%) and NASDAQ (-2.1%). The market cap weighted Vanguard Real Estate ETF (VNQ) outperformed the average REIT in August (-3.38% vs. -4.13%) and has outperformed YTD as well (+1.98% vs. +0.56%). The spread between the 2023 FFO multiples of large cap REITs (16.8x) and small cap REITs (12.6x) widened in August as multiples compressed 0.4 turns for large caps and 0.9 turns for small caps. Investors currently need to pay an average of 33.3% more for each dollar of FFO from large cap REITs relative to small cap REITs. In this monthly publication, I will provide REIT data on numerous metrics to help readers identify which property types and individual securities currently offer the best opportunities to achieve their investment goals.
Source: Graph by Simon Bowler of 2nd Market Capital, Data compiled from S&P Global Market Intelligence LLC. See important notes and disclosures at the end of this article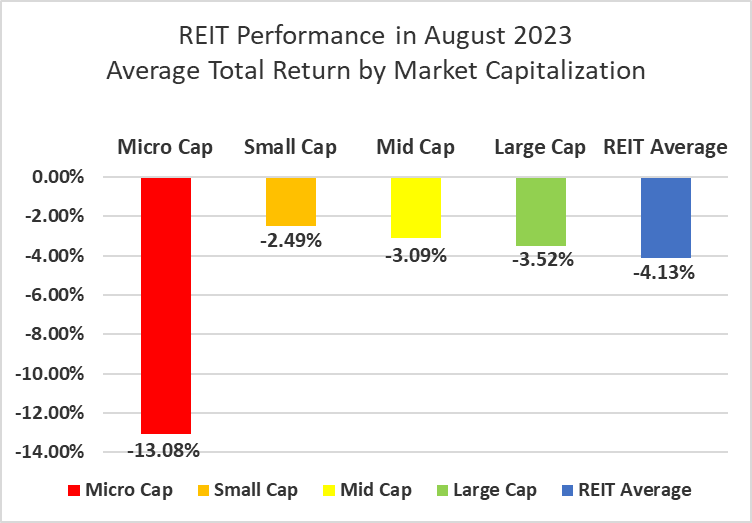
Micro cap REITs (-13.08%) severely underperformed their larger peers in August. Small caps (-2.49%) led the REIT sector yet again in August with smaller average declines than mid caps (-3.09%) and large caps (-3.52%). Large cap REITs (+3.23%) are outperforming small caps (+2.63%) by 60 basis points on YTD 2023 total return.
Source: Graph by Simon Bowler of 2nd Market Capital, Data compiled from S&P Global Market Intelligence LLC. See important notes and disclosures at the end of this article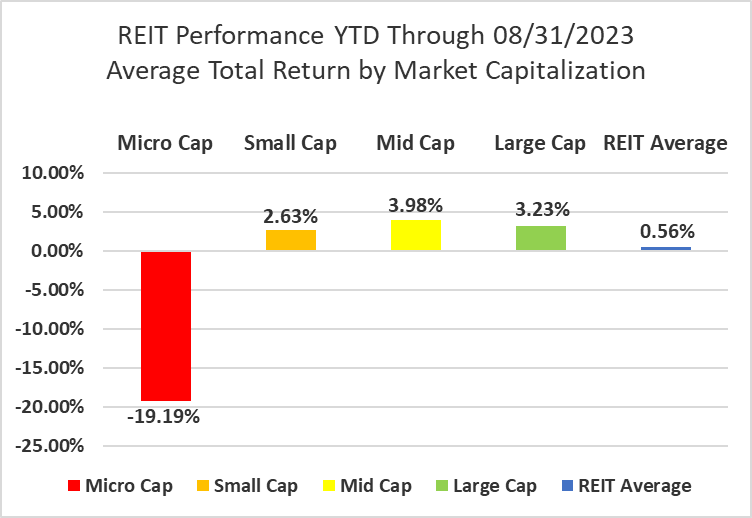
2 out of 18 Property Types Yielded Positive Total Returns in August
Only 11.11% percent of REIT property types averaged a positive total return in August, with a 18.14% total return spread between the best and worst performing property types. Data Center (+2.03%) and Industrial (+0.93%) were the only REIT property types with a positive average total return in August. Digital Realty Trust (DLR) (+5.70%) and Iron Mountain (+3.49%) led Data Centers with strong price gains in the 2 nd half of the month.
Advertising (-16.11%) Infrastructure (-13.31%) and Malls (-10.28%) averaged double digit negative total returns in August. Advertising was dragged down by a sharp share price decline from OUTFRONT Media (OUT) (-24.64%), which has been negatively impacted by uncertainty surrounding the future of the New York MTA agreement that has turned out to be significantly less lucrative than expected.
Source: Table by Simon Bowler of 2nd Market Capital, Data compiled from S&P Global Market Intelligence LLC. See important notes and disclosures at the end of this article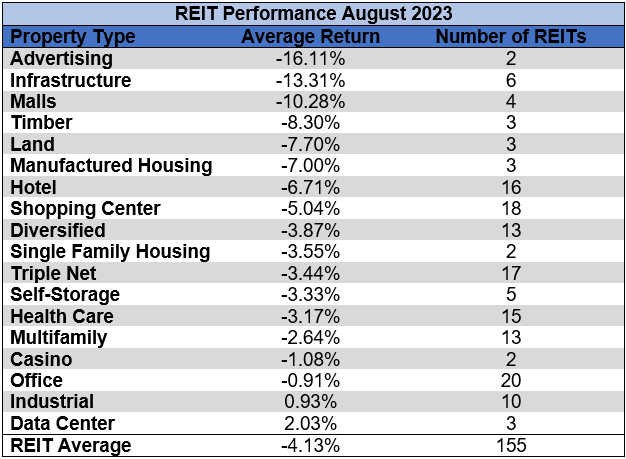
After another rough month in August, Infrastructure remains the worst performing REIT property type year to date (-30.73%). Land (-15.73%), Advertising (-13.91%) and Malls (-13.58%) have also averaged double digit negative total returns in 2023. The number of REIT property types in the black year to date decreased from 12 to 8 in August. Data Centers (+28.60%) and Health Care (+23.65%) are the best performing property types year to date.
Source: Table by Simon Bowler of 2nd Market Capital, Data compiled from S&P Global Market Intelligence LLC. See important notes and disclosures at the end of this article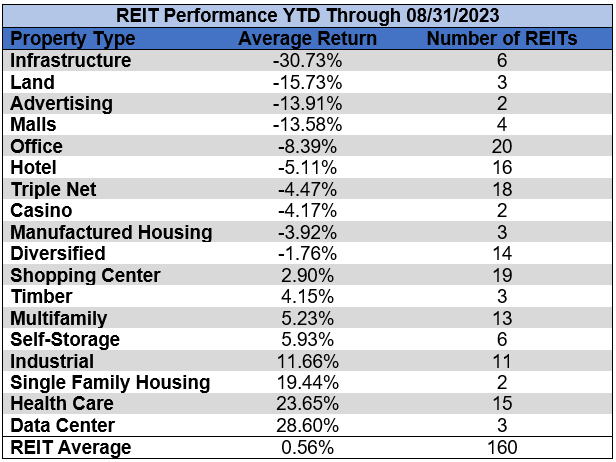
The REIT sector as a whole saw the average P/FFO (2023Y) decrease 0.3 turns in August from 13.7x down to 13.4x. The average FFO multiple expanded for 17.6% of property types, held steady for 5.9% and contracted for 76.5%. There are no recent 2023 FFO/share estimates for any of the Timber REITs. Land (35.7x), Data Centers (25.6x), Single Family Housing (20.5x) and Industrial (20.0x) currently trade at the highest average multiples among REIT property types. Malls (4.9x), Office (8.0x) and Hotels (8.0x) all saw multiple contraction in August and remain the only REIT property types trading at single digit multiples.
Source: Table by Simon Bowler of 2nd Market Capital, Data compiled from S&P Global Market Intelligence LLC. See important notes and disclosures at the end of this article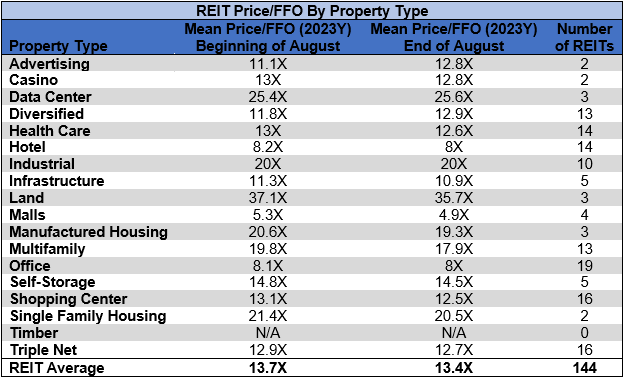
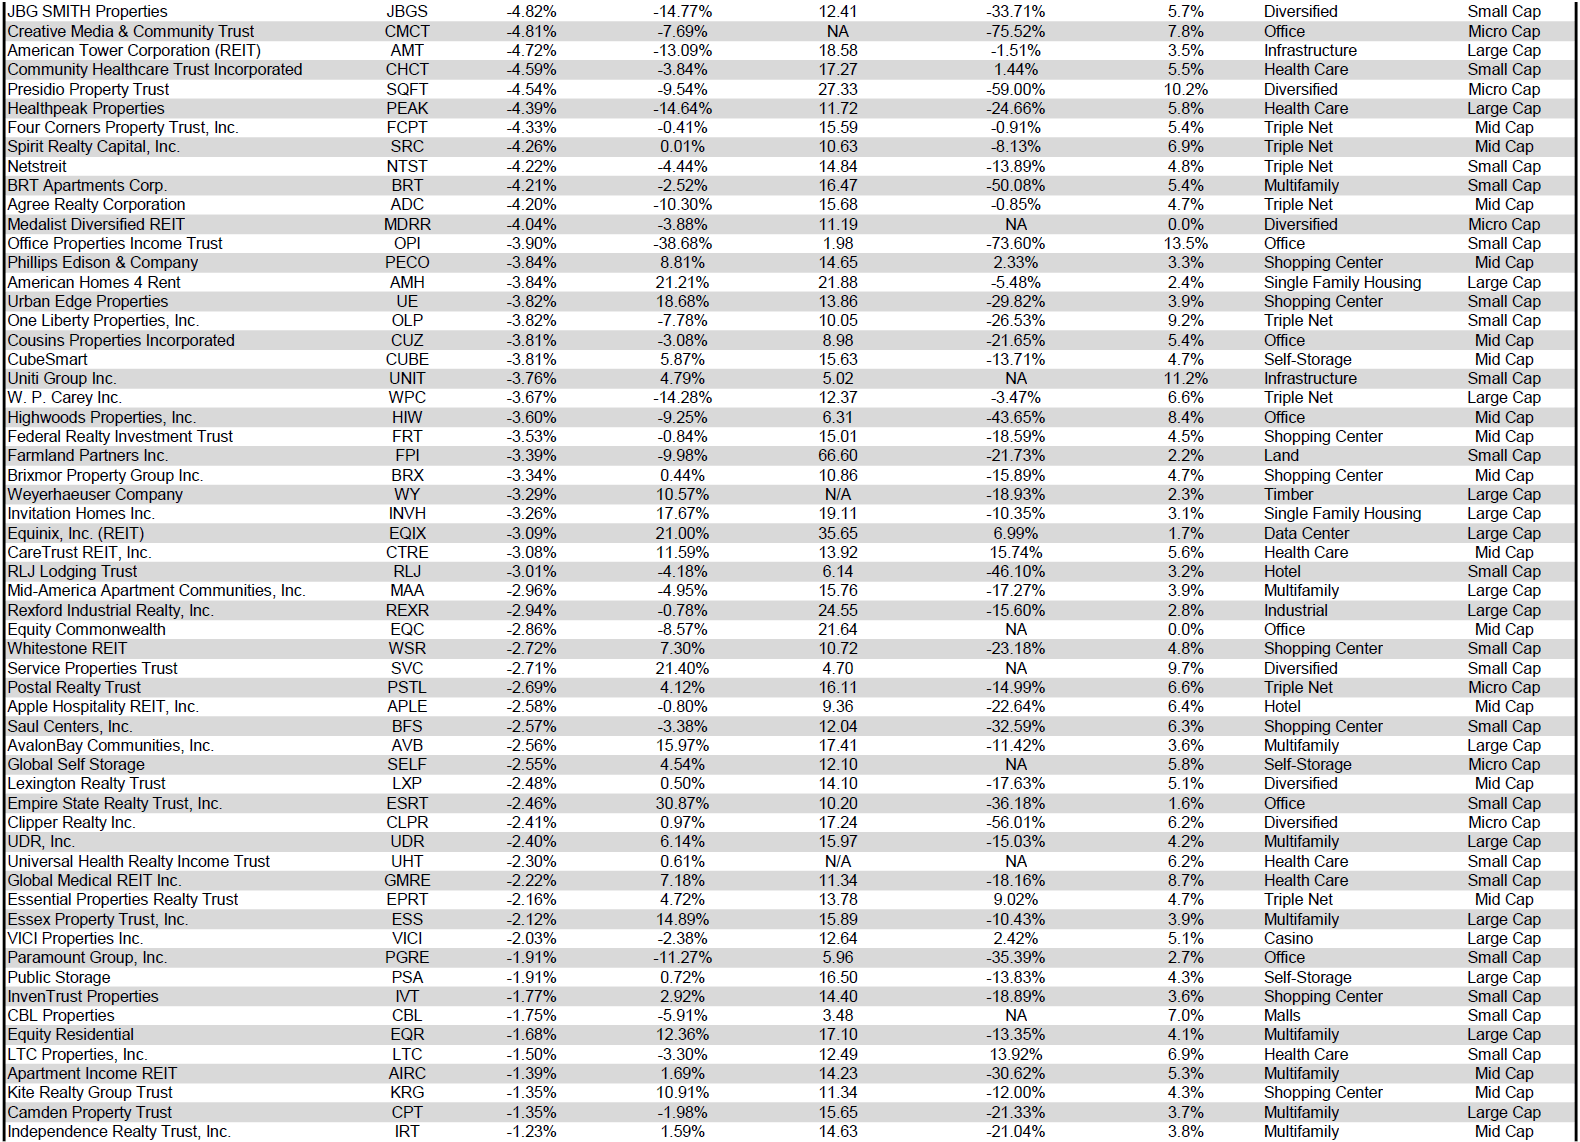
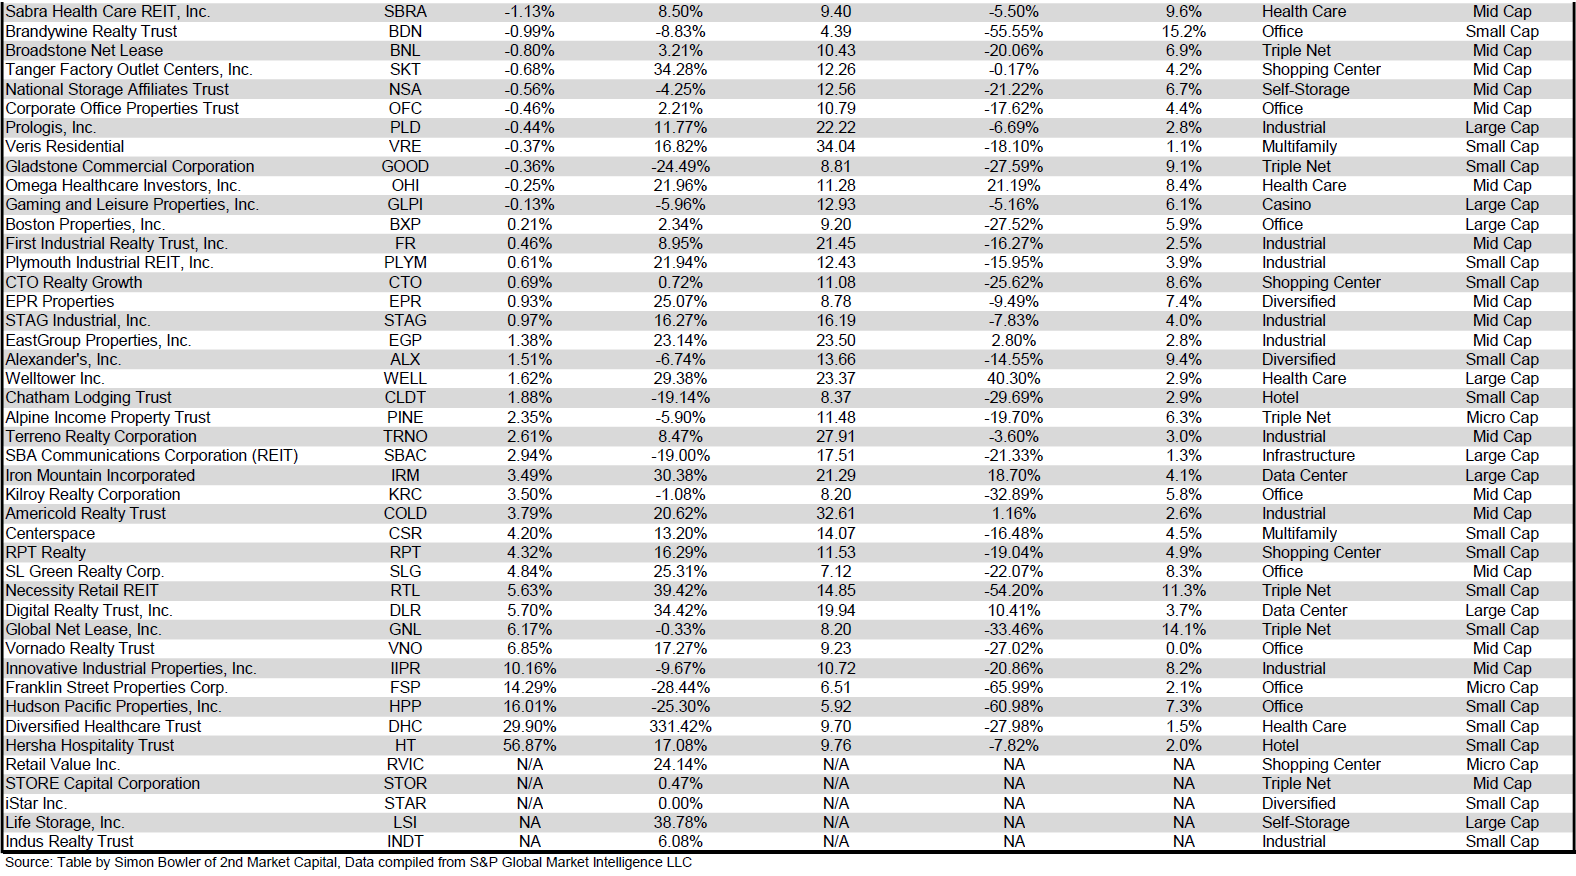
Performance of Individual Securities
Urstadt Biddle Properties (UBA) was acquired by Regency Centers (REG) on August 18th in a stock for stock transaction. Shareholders of Urstadt Biddle received 0.347 shares of REG for each share of UBA or UBP.
Hersha Hospitality Trust (HT) (+56.87%) soared on the announcement that the hotel REIT will be acquired by KSL Capital Partners. If the sale is approved by a majority of Hersha shareholders, HT common stock shareholders will receive $10/share at the closing of the transaction. This was a significant premium to the $6.28/share closing share price prior to the announcement.
Power REIT (PW) (-43.20%) continues to freefall due to persistent tenant quality concerns. After yet another brutal month, PW surpassed Wheeler REIT (WHLR) (-34.83%) as the worst performing REIT of 2023 with a dismal -75.70% total return.
Only 18.06% of REITs had a positive total return in August with 48.13% in the black year to date. During the first eight months of last year the average REIT had a brutal -16.26% return. During the first eight months of this year the average REIT has performed better with a +0.56% total return.
Source: Table by Simon Bowler of 2nd Market Capital, Data compiled from S&P Global Market Intelligence LLC. See important notes and disclosures at the end of this article Source: Table by Simon Bowler of 2nd Market Capital, Data compiled from S&P Global Market Intelligence LLC. See important notes and disclosures at the end of this article Source: Table by Simon Bowler of 2nd Market Capital, Data compiled from S&P Global Market Intelligence LLC. See important notes and disclosures at the end of this article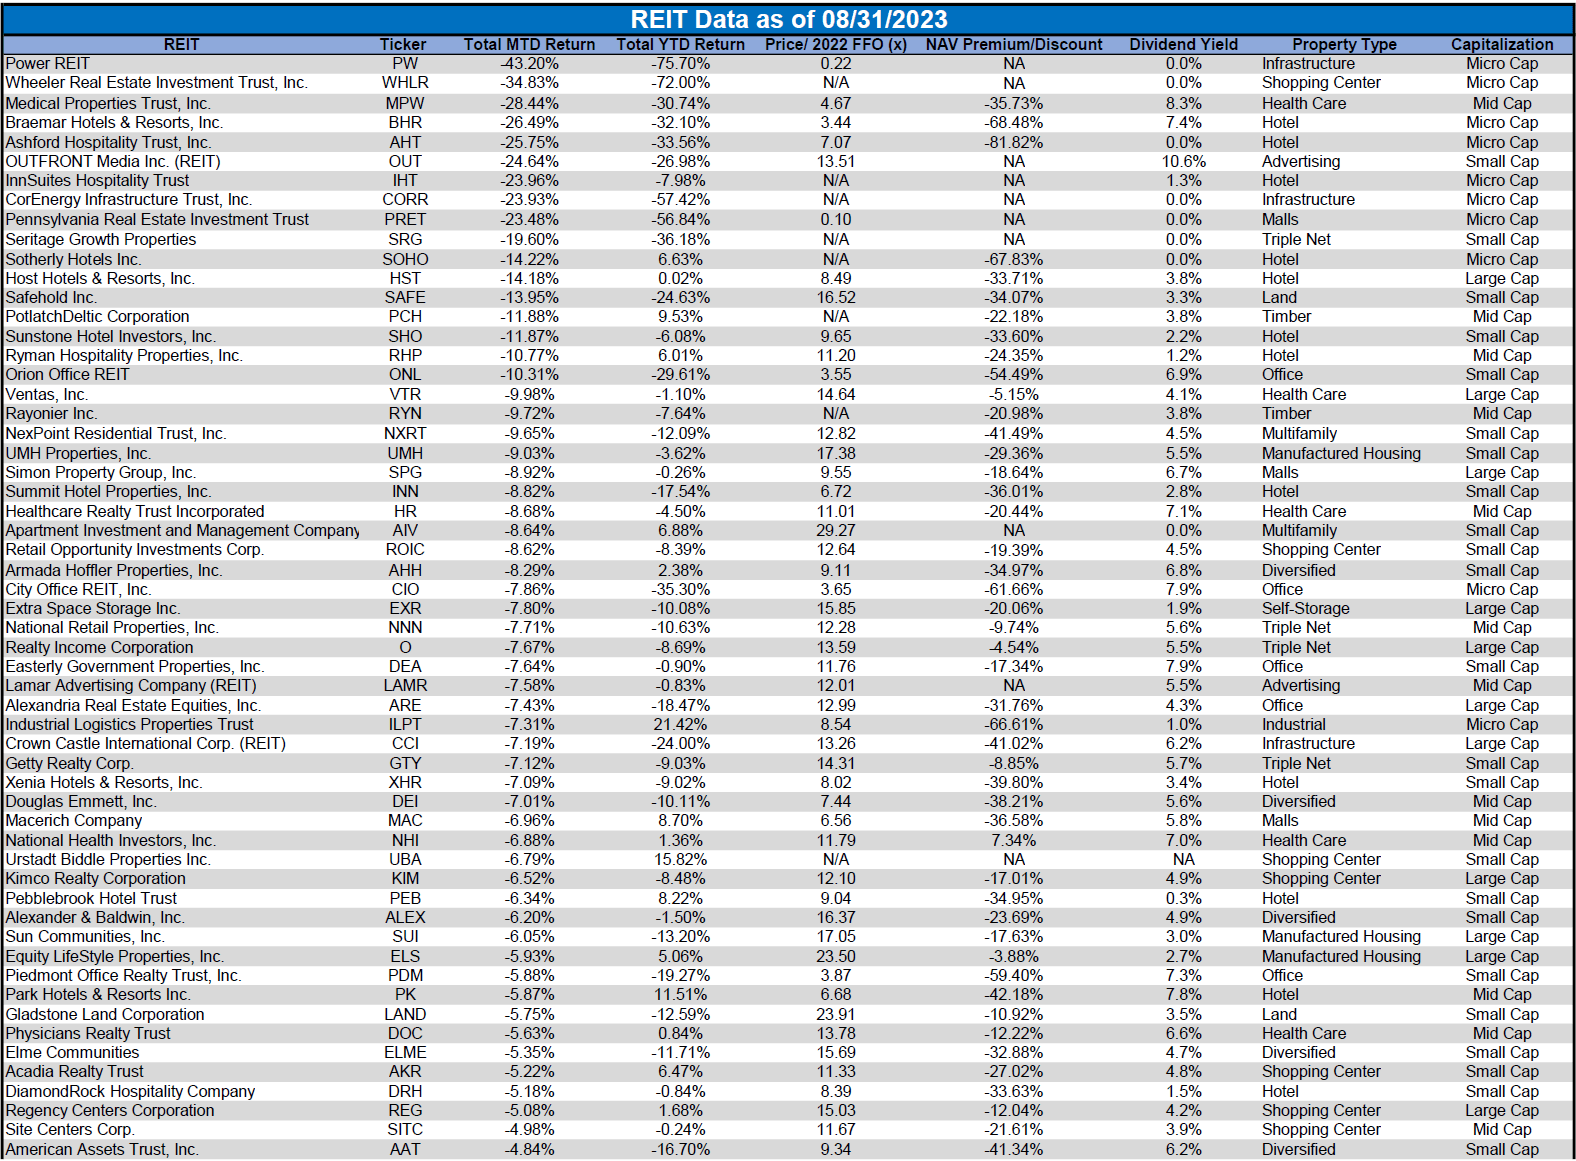
For the convenience of reading this table in a larger font, the table above is available as a PDF as well.
Dividend Yield
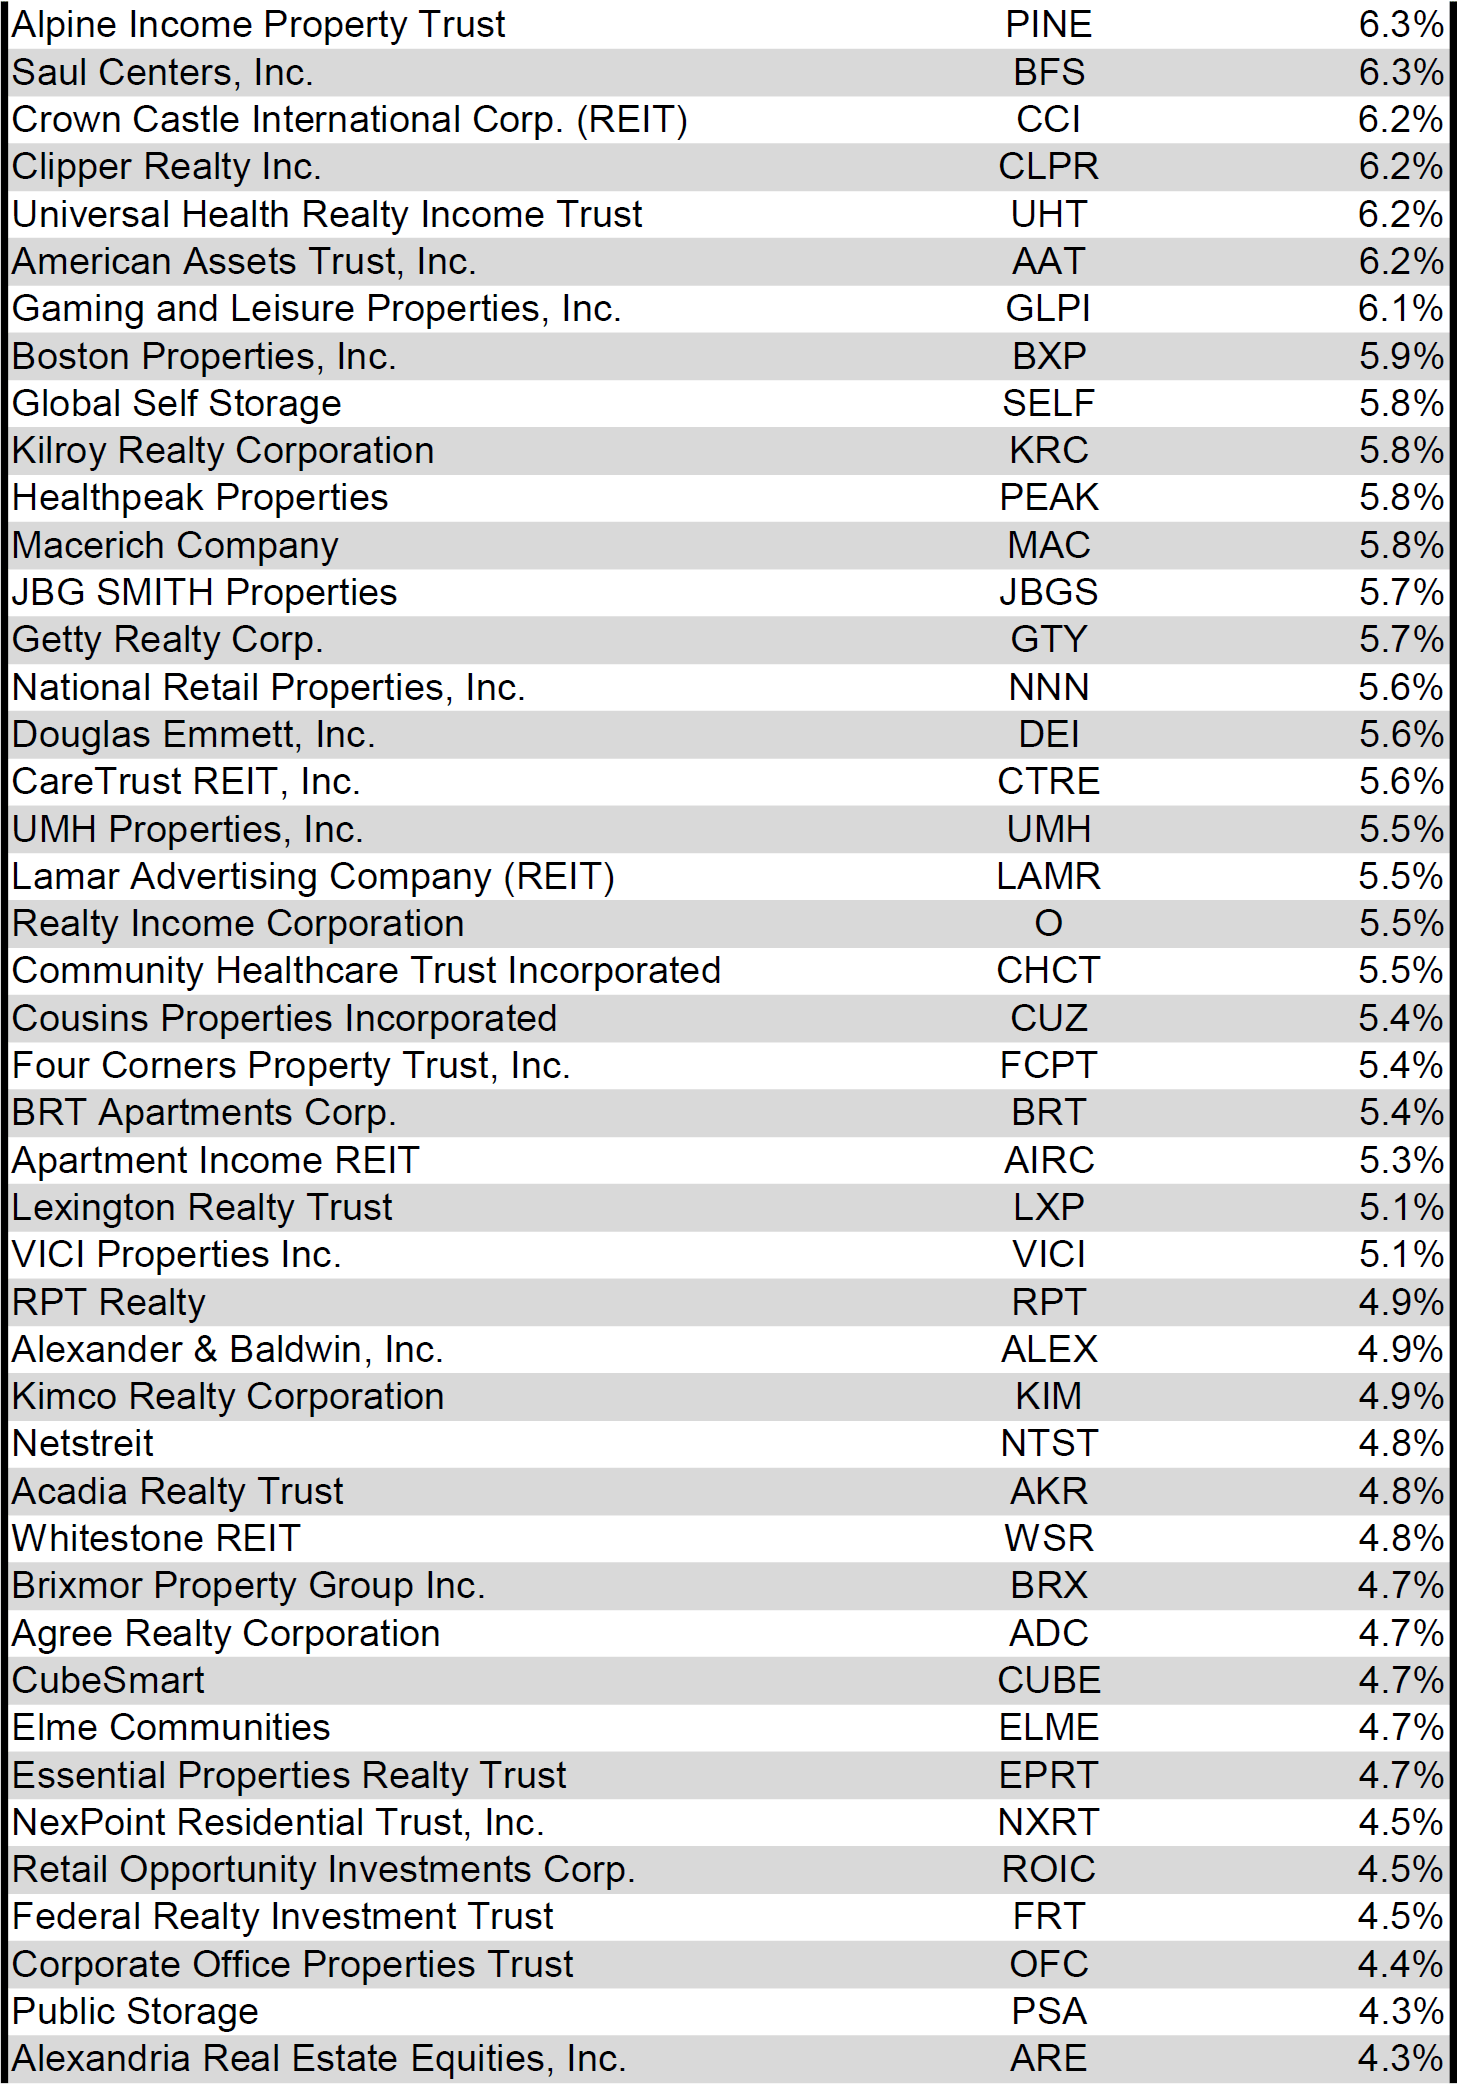
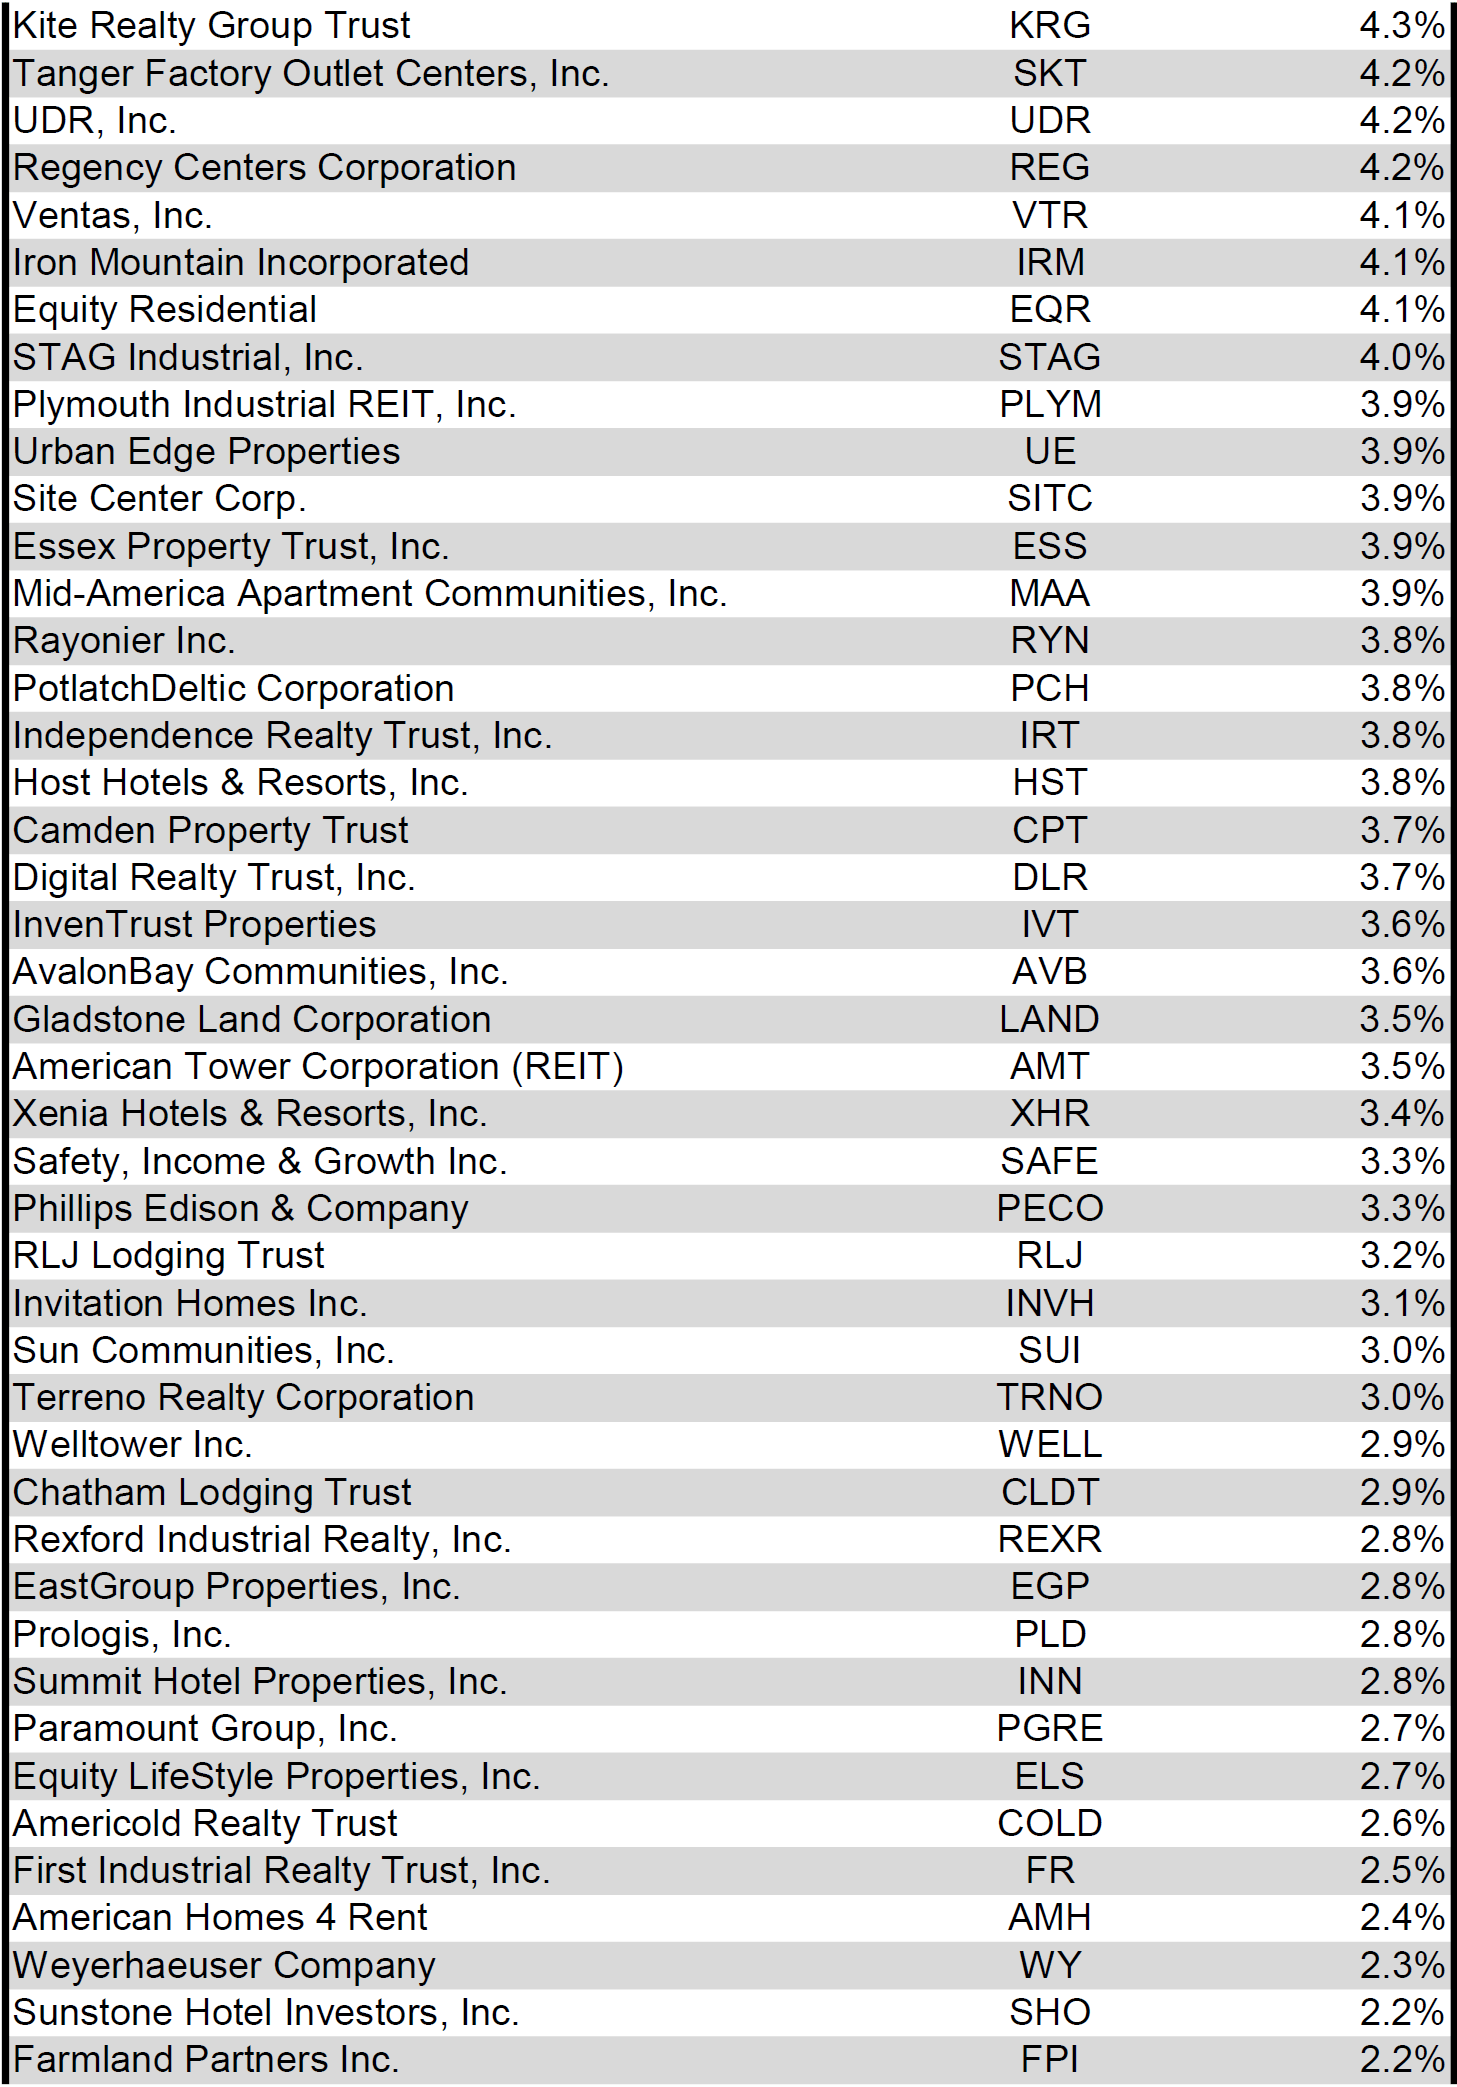
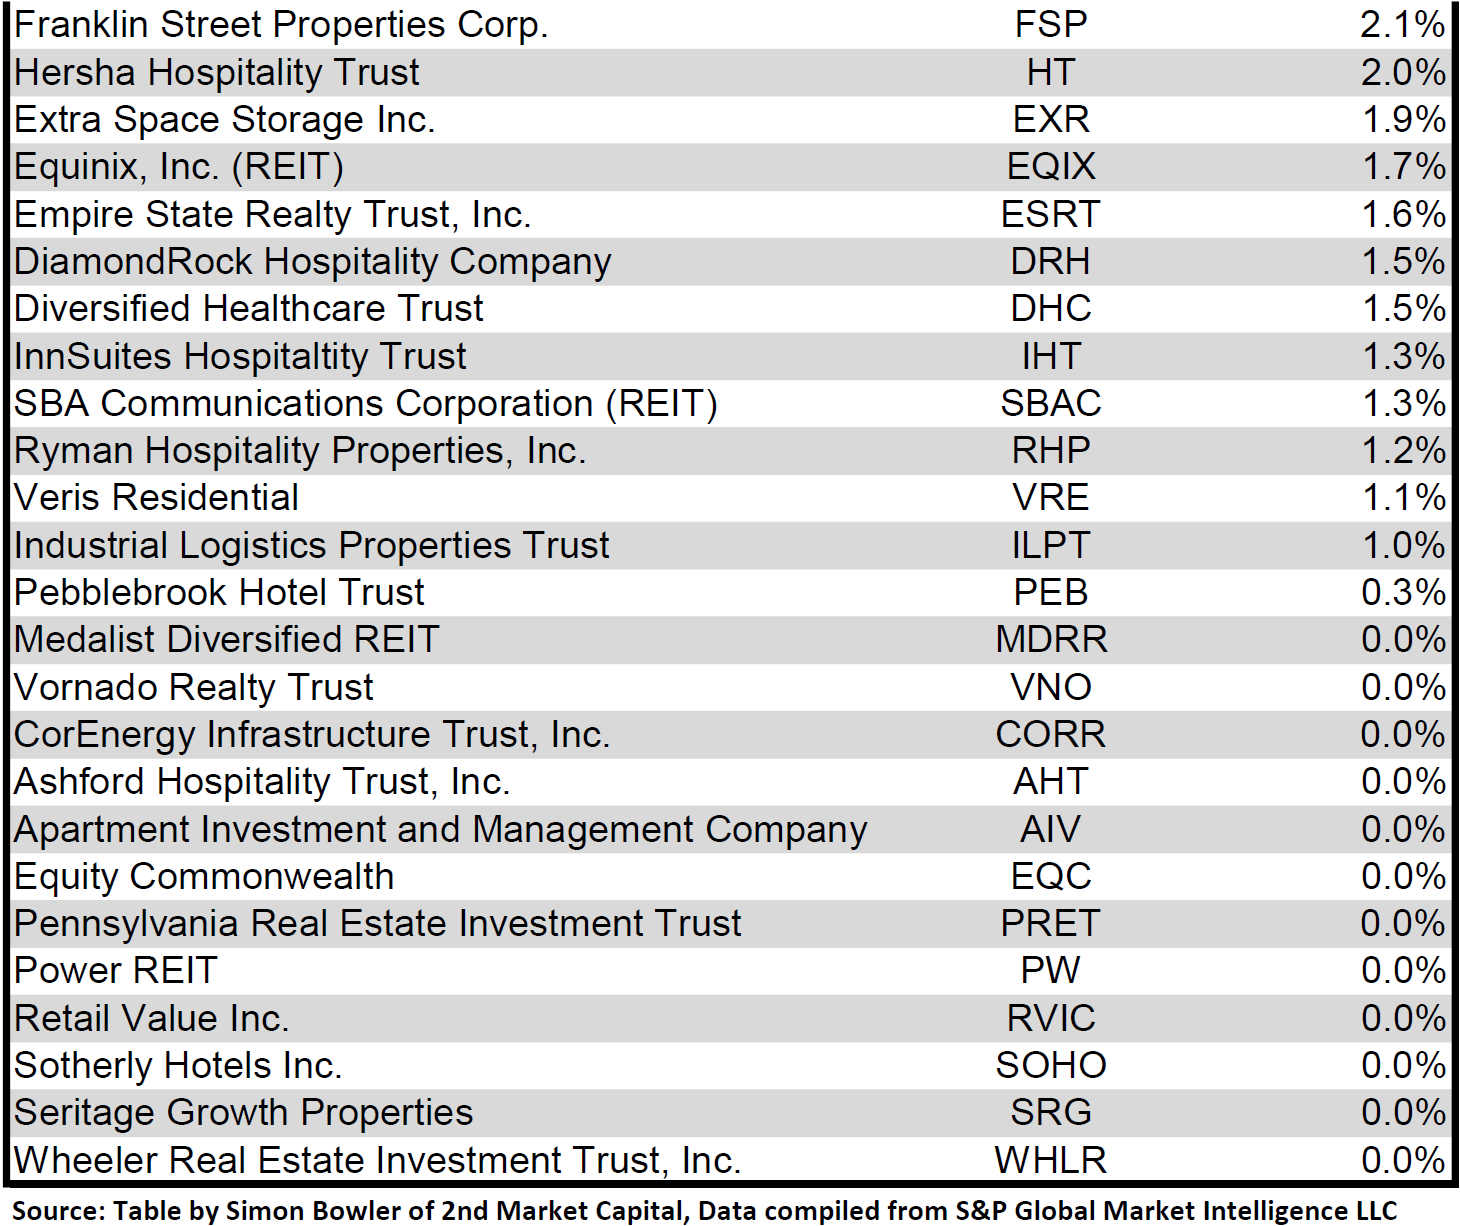
Dividend yield is an important component of a REIT's total return. The particularly high dividend yields of the REIT sector are, for many investors, the primary reason for investment in this sector. As many REITs are currently trading at share prices well below their NAV, yields are currently quite high for many REITs within the sector. Although a particularly high yield for a REIT may sometimes reflect a disproportionately high risk, there exist opportunities in some cases to capitalize on dividend yields that are sufficiently attractive to justify the underlying risks of the investment. I have included below a table ranking equity REITs from highest dividend yield (as of 08/31/2023) to lowest dividend yield.
Source: Table by Simon Bowler of 2nd Market Capital, Data compiled from S&P Global Market Intelligence LLC. See important notes and disclosures at the end of this article Source: Table by Simon Bowler of 2nd Market Capital, Data compiled from S&P Global Market Intelligence LLC. See important notes and disclosures at the end of this article Source: Table by Simon Bowler of 2nd Market Capital, Data compiled from S&P Global Market Intelligence LLC. See important notes and disclosures at the end of this article Source: Table by Simon Bowler of 2nd Market Capital, Data compiled from S&P Global Market Intelligence LLC. See important notes and disclosures at the end of this article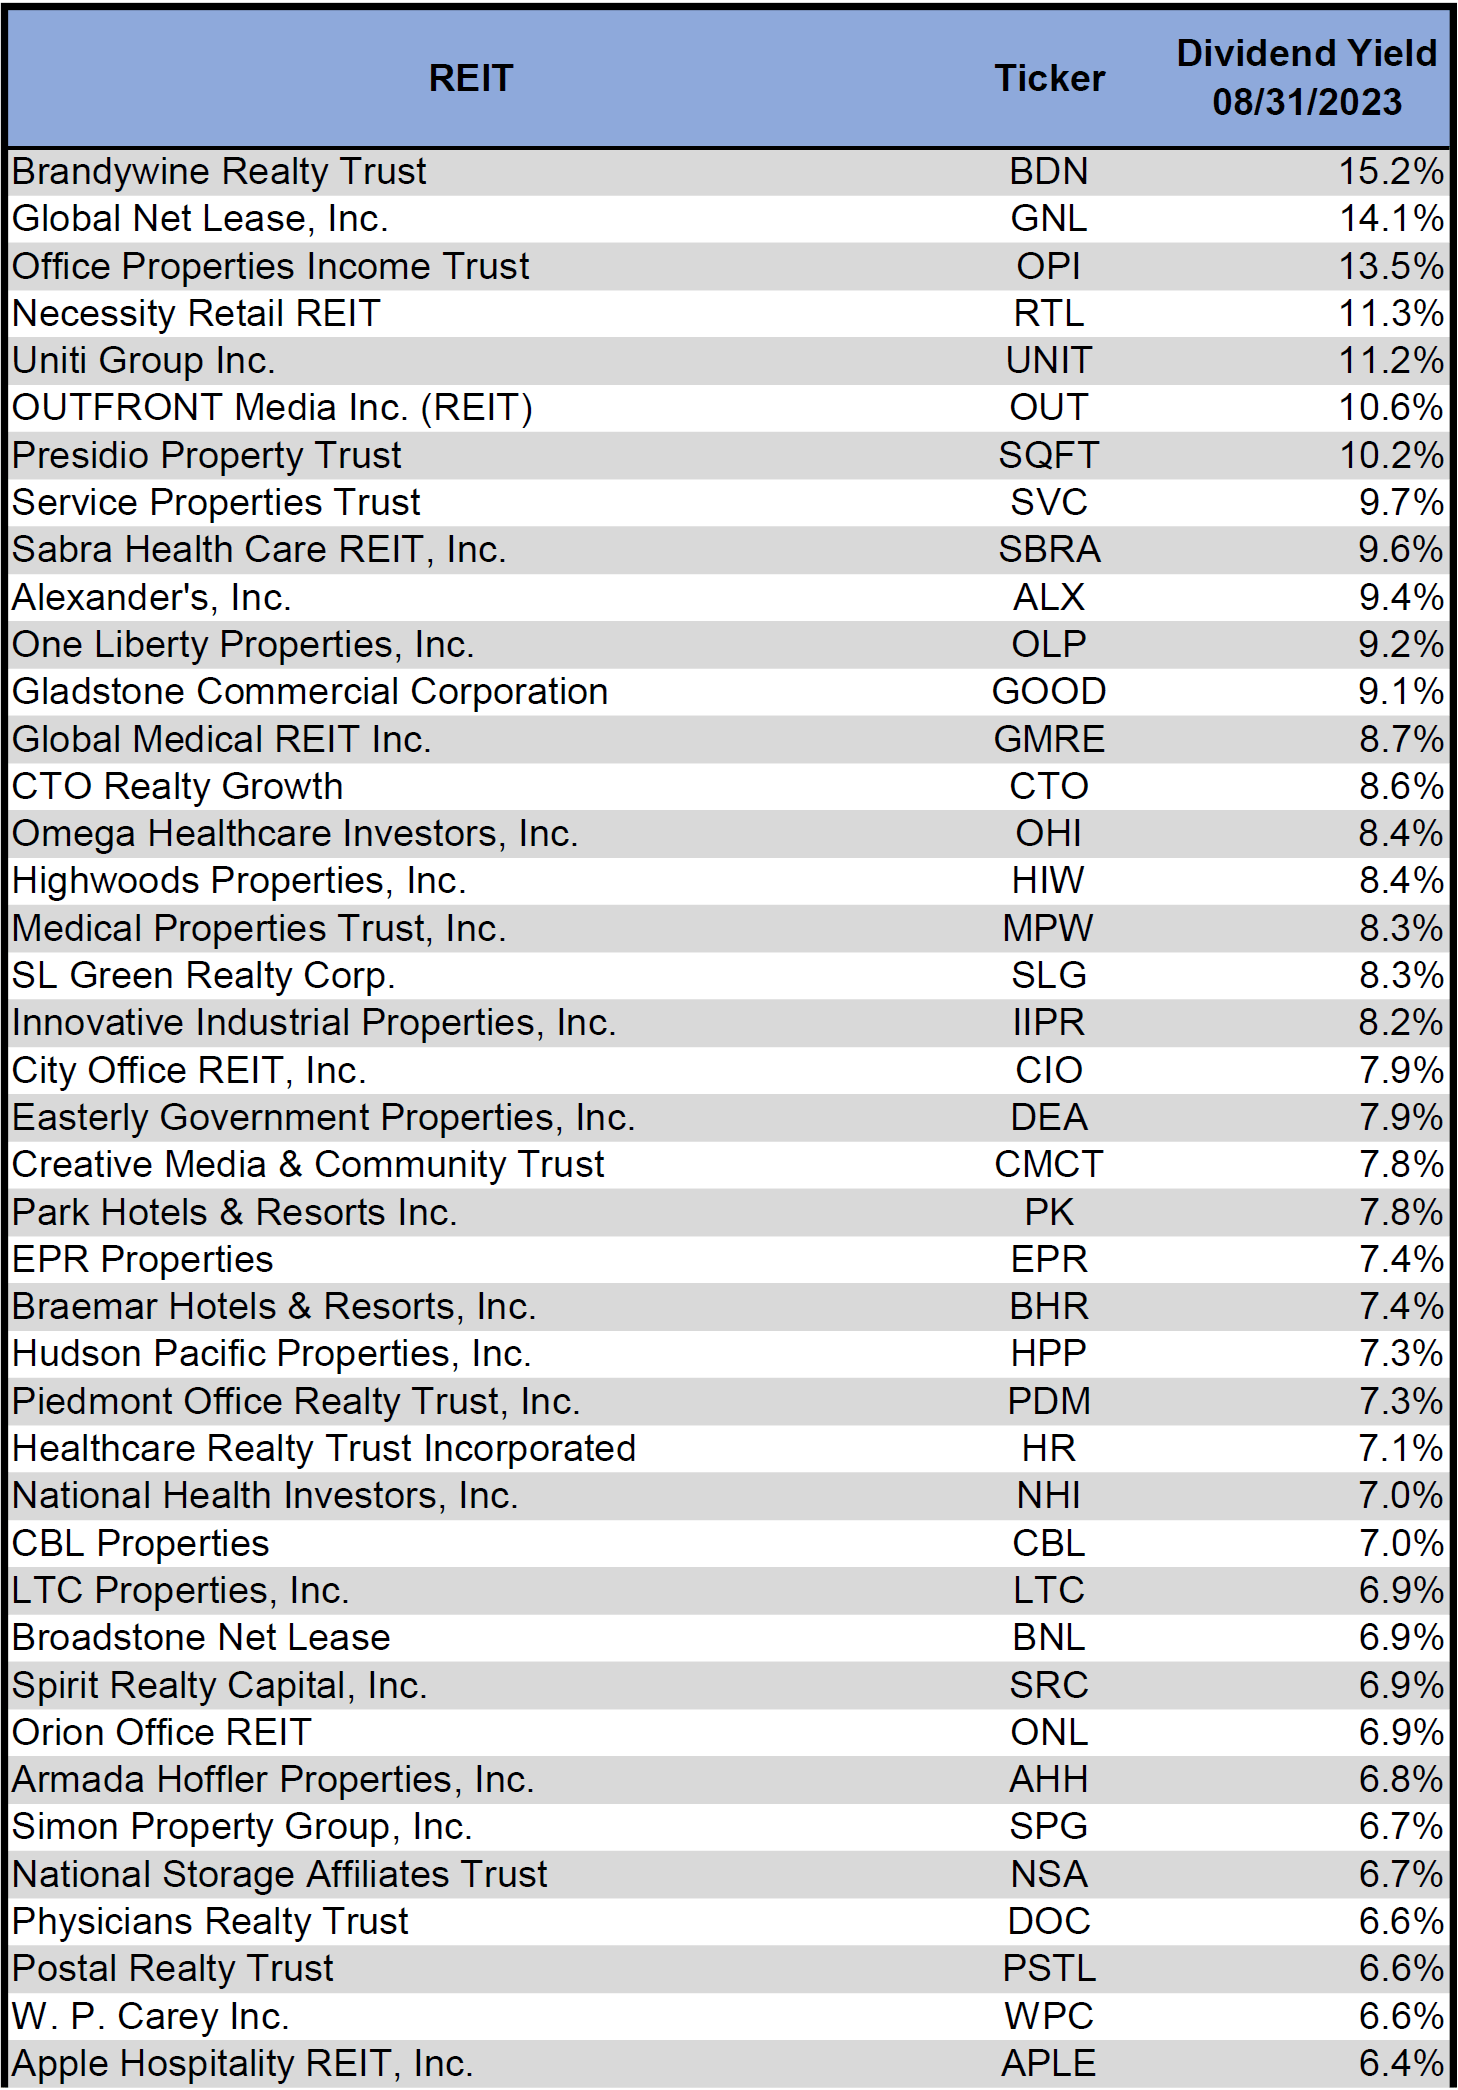
For the convenience of reading this table in a larger font, the table above is available as a PDF as well.
Although a REIT’s decision regarding whether to pay a quarterly dividend or a monthly dividend does not reflect on the quality of the company’s fundamentals or operations, a monthly dividend allows for a smoother cash flow to the investor. Below is a list of equity REITs that pay monthly dividends ranked from highest yield to lowest yield.
Source: Table by Simon Bowler of 2nd Market Capital, Data compiled from S&P Global Market Intelligence LLC. See important notes and disclosures at the end of this article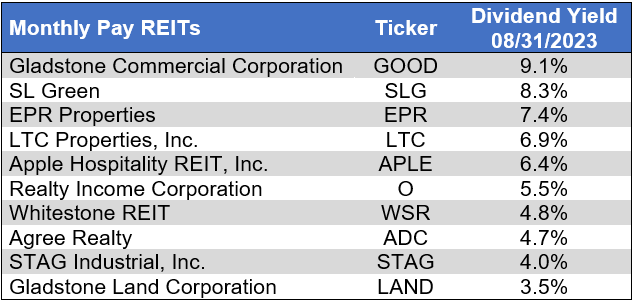
Valuation
REIT Premium/Discount to NAV by Property Type
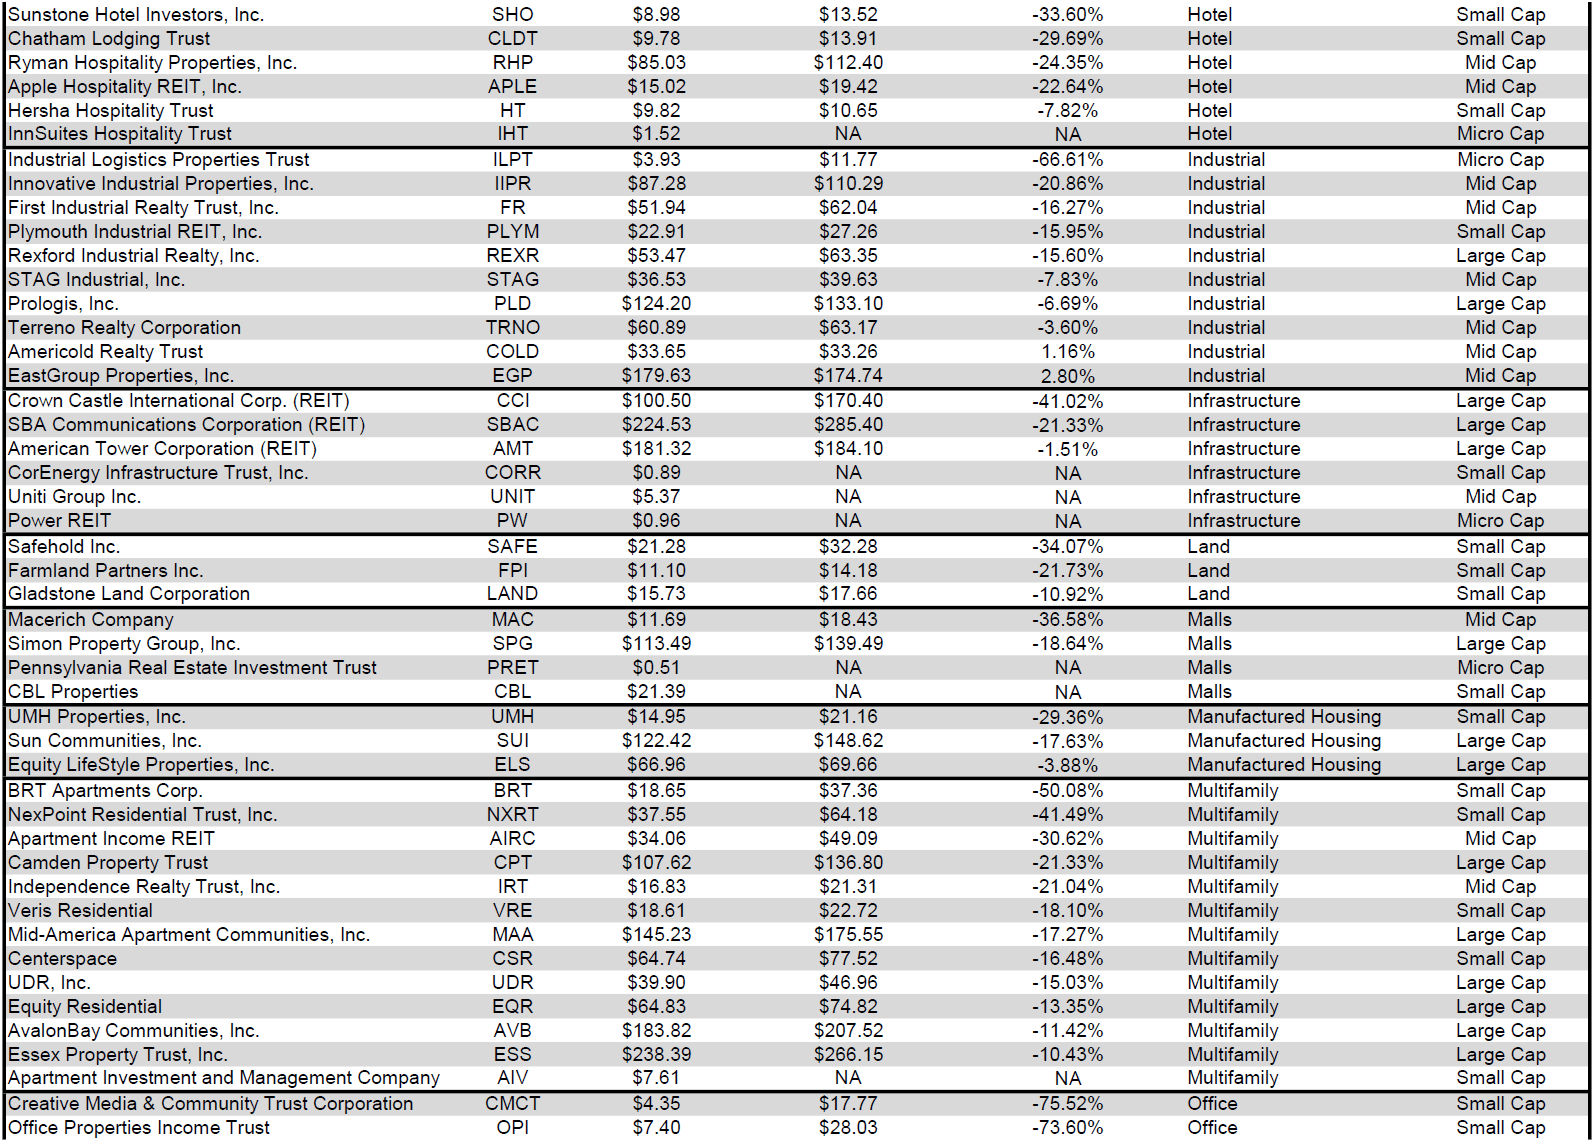
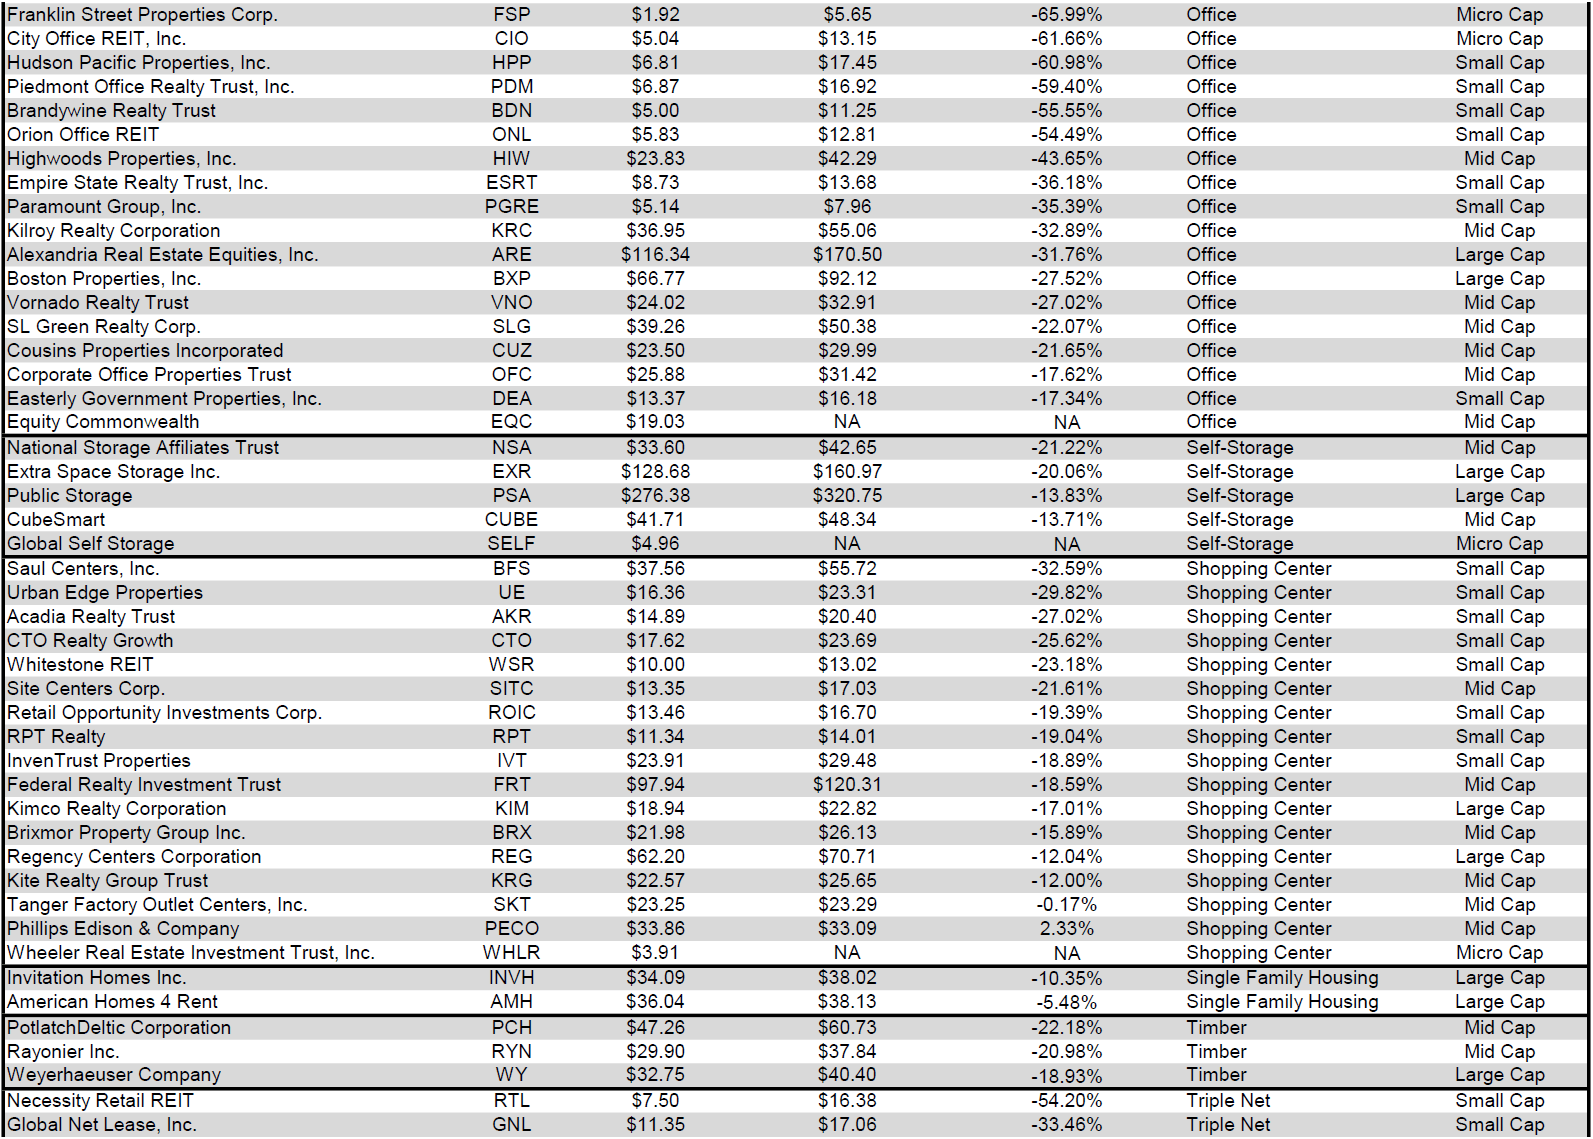
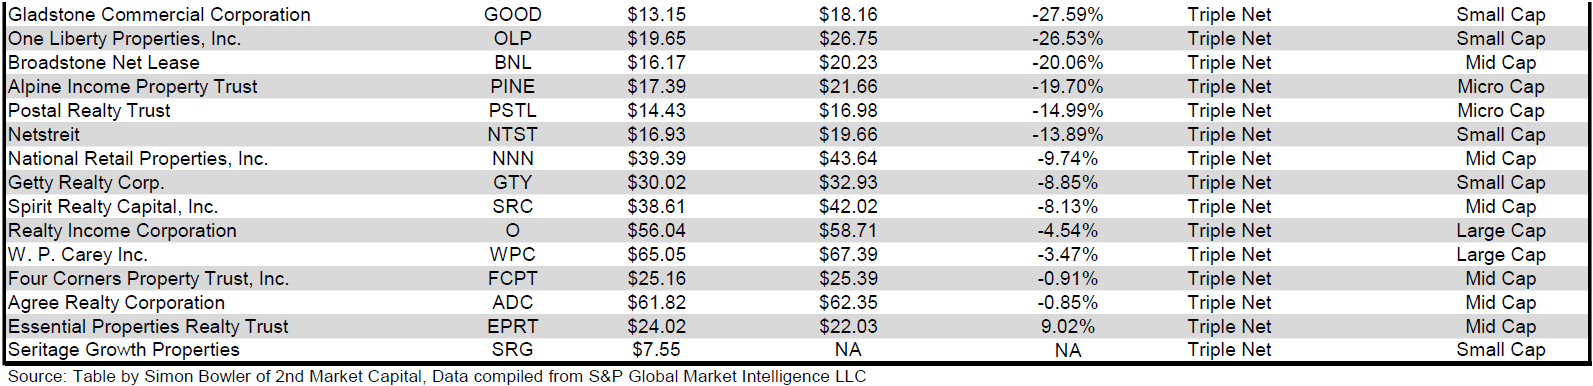
Below is a downloadable data table, which ranks REITs within each property type from the largest discount to the largest premium to NAV. The consensus NAV used for this table is the average of analyst NAV estimates for each REIT. Both the NAV and the share price will change over time, so I will continue to include this table in upcoming issues of The State of REITs with updated consensus NAV estimates for each REIT for which such an estimate is available.
Source: Table by Simon Bowler of 2nd Market Capital, Data compiled from S&P Global Market Intelligence LLC. See important notes and disclosures at the end of this article Source: Table by Simon Bowler of 2nd Market Capital, Data compiled from S&P Global Market Intelligence LLC. See important notes and disclosures at the end of this article Source: Table by Simon Bowler of 2nd Market Capital, Data compiled from S&P Global Market Intelligence LLC. See important notes and disclosures at the end of this article Source: Table by Simon Bowler of 2nd Market Capital, Data compiled from S&P Global Market Intelligence LLC. See important notes and disclosures at the end of this article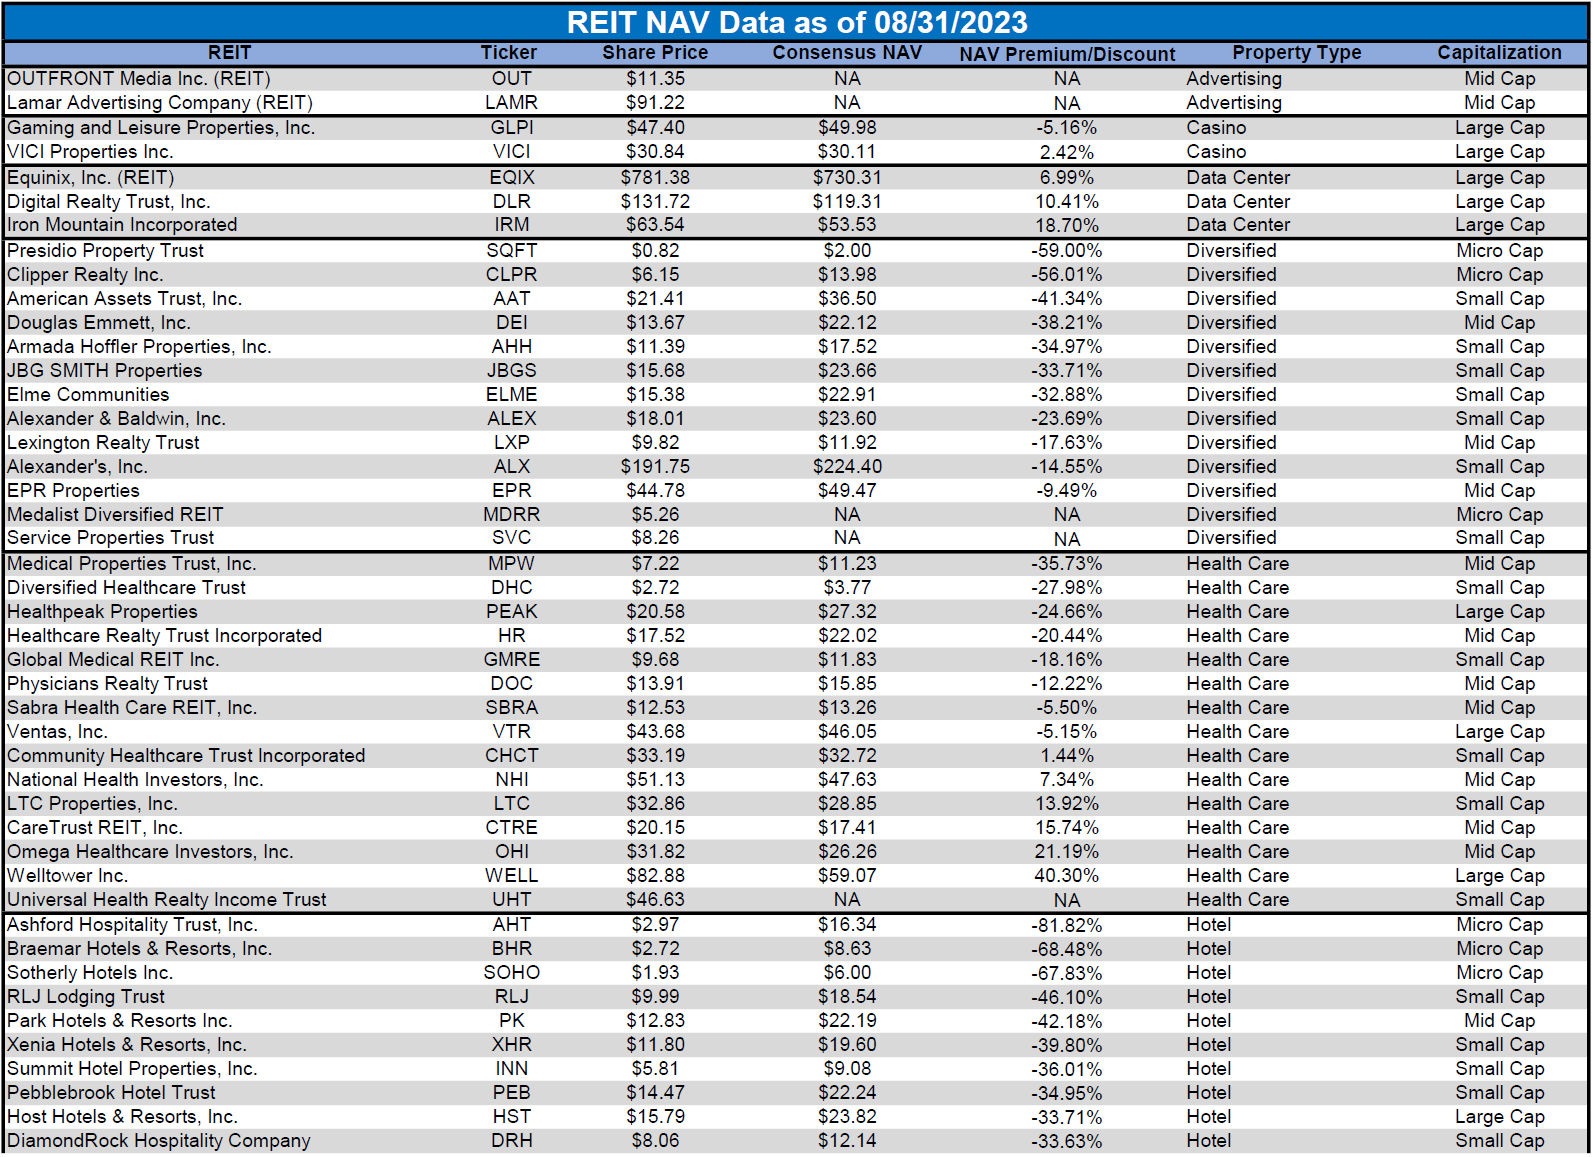
For the convenience of reading this table in a larger font, the table above is available as a PDF as well.
Takeaway
The large cap REIT premium (relative to small cap REITs) widened in August and investors are now paying on average about 33% more for each dollar of 2023 FFO/share to buy large cap REITs than small cap REITs (16.8x/12.6x - 1 = 33.3%). As can be seen in the table below, there is presently a strong positive correlation between market cap and FFO multiple.
Source: Table by Simon Bowler of 2nd Market Capital, Data compiled from S&P Global Market Intelligence LLC. See important notes and disclosures at the end of this article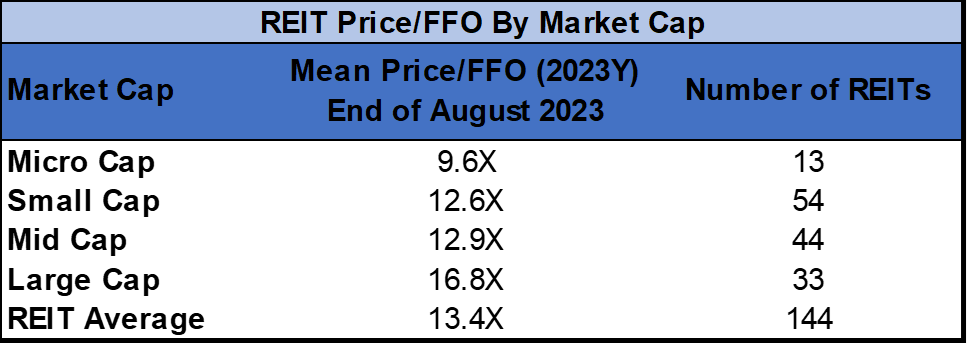
The table below shows the average NAV premium/discount of REITs of each market cap bucket. This data, much like the data for price/FFO, shows a strong, positive correlation between market cap and Price/NAV. The average large cap REIT (-10.88%) and mid cap REIT (-14.92%) trade at a low double-digit discount to NAV, while small cap REITs (-29.89%) trade at a little less than 3/4 of NAV. Micro caps on average continue to trade at less than half of their respective NAVs (-57.79%).
Source: Table by Simon Bowler of 2nd Market Capital, Data compiled from S&P Global Market Intelligence LLC. See important notes and disclosures at the end of this article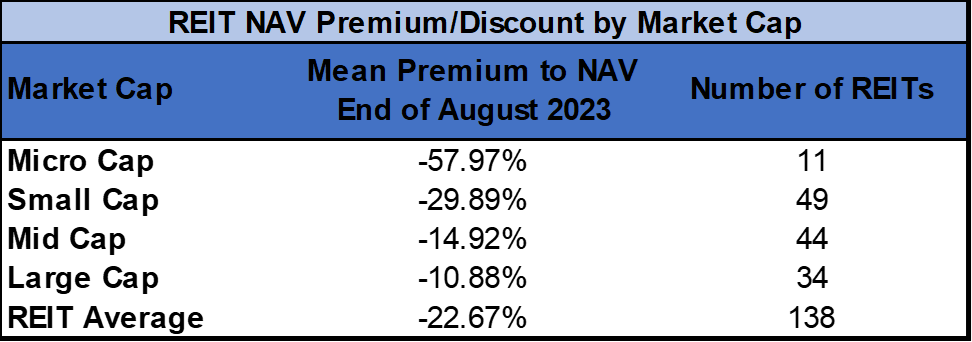
Bankruptcy filings in August declined month over month, but remained elevated for the 9th straight month. The number of bankruptcies in just the first 8 months of 2023 has already surpassed the total bankruptcies for all of 2021 or 2022, but remains slightly behind the pace of bankruptcies in 2020. With inflation beginning to accelerate again, further rate hikes in Q4 2023 are still very much on the table. This also likely pushes back the time frame for the Fed to begin a rate cutting cycle that would bring much needed relief to businesses that are struggling with an elevated cost of capital.
Source: S&P Global Market Intelligence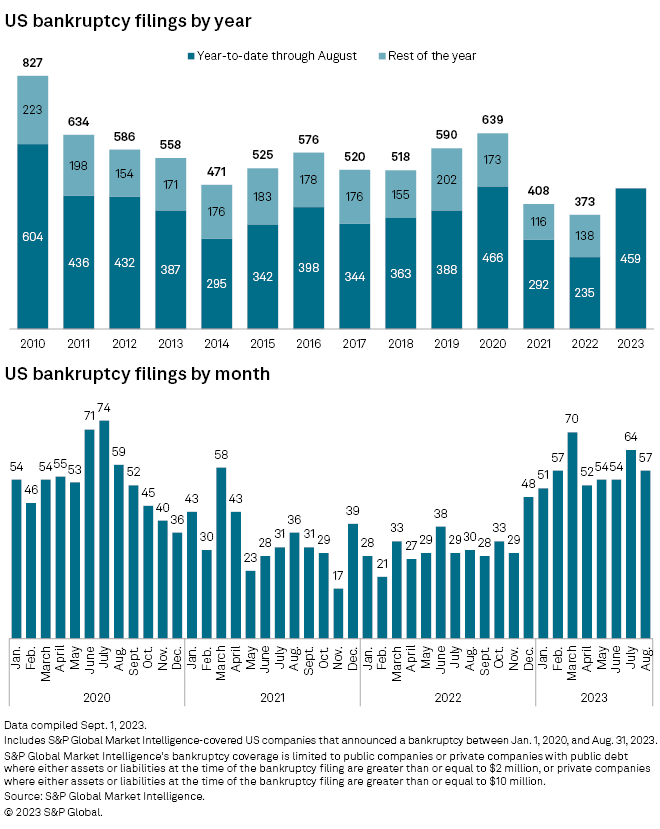
Although the cost of new capital has risen sharply for REITs, this is offset to varying degrees by the resilience of REIT fundamentals. The REIT sector as a whole saw a healthy 4% increase in same-store NOI (SS-NOI), but with significant variance across property types.
Source: S&P Global Market Intelligence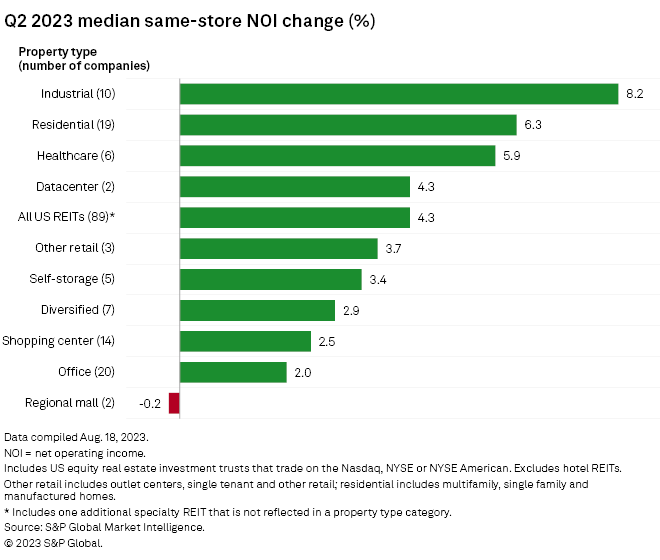
Malls (-0.2%) were the only property type to see SS-NOI decline year over year in Q2 2023. Even Office REITs achieved a +2% gain despite a challenging leasing environment. SS-NOI growth was strongest, however, for Industrial REITs (+8.2%), led by Terreno Realty (TRNO) (+14.5%), Americold Realty Trust (COLD) (+12.7%), First Industrial Realty Trust (FR) (+11.0%) and Rexford Industrial Realty (REXR) (+8.0%).
Source: S&P Global Market Intelligence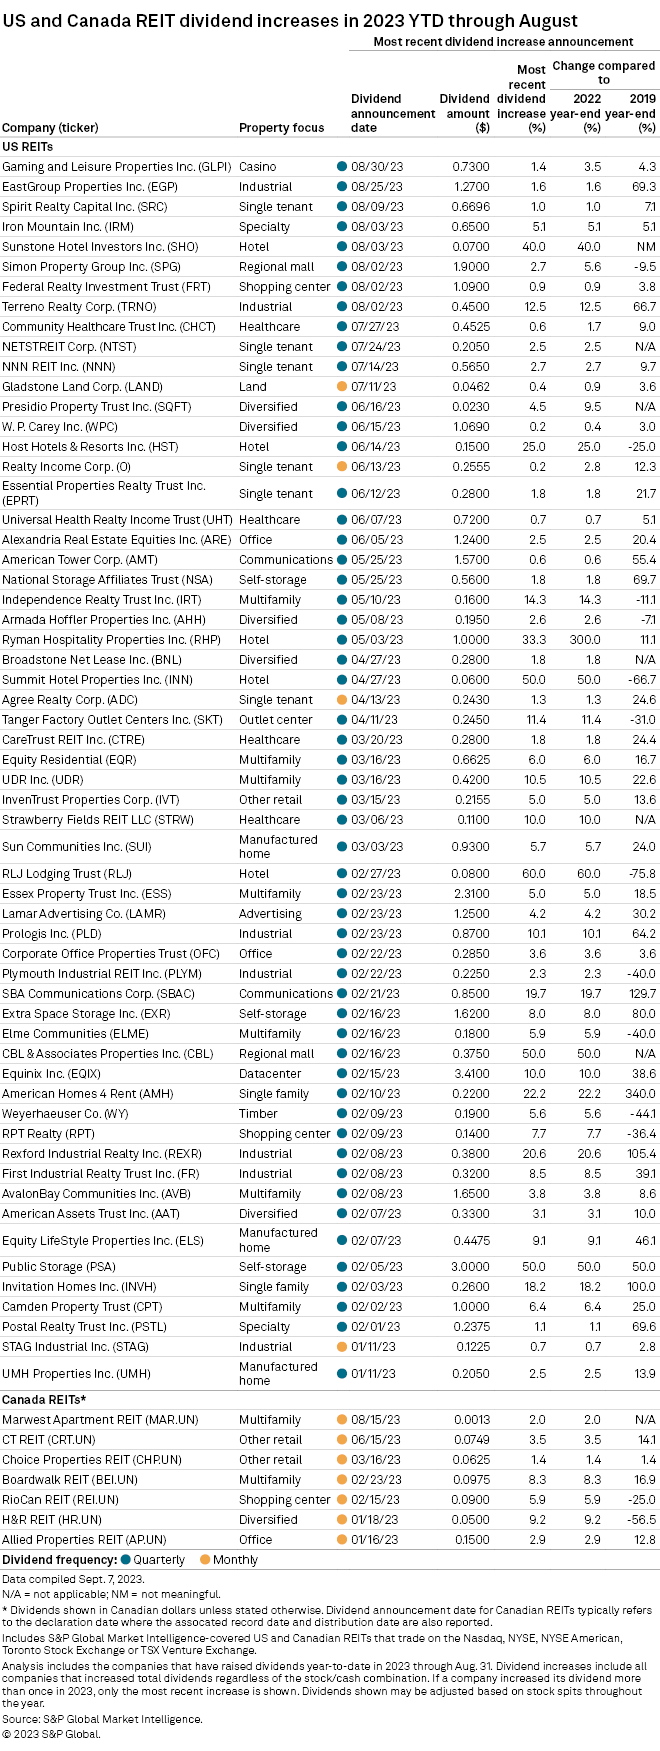
This continued fundamental growth in the REIT sector facilitates (and at times necessitates due to REIT structure rules) REITs to continue to raise their dividends. This growing income stream in a portfolio can be a significant contributor to total return. Of course, not all REITs are achieving this growth and some have actually needed to cut or suspend their dividends, so it is essential that investors do their due diligence on the company level to successfully capitalize on the continued strength of the REIT sector.
Editor's Note: This article covers one or more microcap stocks. Please be aware of the risks associated with these stocks.
Dividends are scarce, we provide the solution

For everything you need to build a growing stream of dividend income, please consider joining Portfolio Income Solutions. As a member you will get:
- Access to a curated Real Money REIT Portfolio
- Continuous market and single stock analysis
- Data sets on every REIT
You will benefit from our team’s decades of collective experience in REIT investing. On Portfolio Income Solutions, we don’t only share our ideas, we also discuss best trading practices and help you become a better investor.
This article was written by

Simon Bowler is the Chief Communications Officer at 2nd Market Capital Advisory Corporation (2MCAC). 2MCAC specializes in the analysis and trading of real estate securities. Through a selective process and consideration of market dynamics, we aim to construct portfolios for rising streams of dividend income and capital appreciation.Our Portfolio Income Solutions Marketplace service provides stock picks, extensive analysis and data sheets to help enhance the returns of do-it-yourself investors.Investment Advisory Services
We now offer a way to directly invest in our Proprietary Investment Portfolio Strategy via REIT Total Return, which replicates our activity in client accounts. Total Return client’s brokerage accounts are automatically invested simultaneously and at the same price when we make a trade in the REIT Total Return Portfolio (also known as 2CHYP).
Learn more about our REIT Total Return Portfolio.Simon Bowler, along with fellow SA contributors Dane Bowler and Ross Bowler, is an investment advisory representative of 2nd Market Capital Advisory Corporation (2MCAC), a state-registered investment advisor.Full Disclosure. All content is published and provided as an information source for investors capable of making their own investment decisions. None of the information offered should be construed to be advice or a recommendation that any particular security, portfolio of securities, transaction, or investment strategy is suitable for any specific person. The information offered is impersonal and not tailored to the investment needs of the specific person. Please see our SA Disclosure Statement for our Full Disclaimer.
Analyst’s Disclosure: I/we have a beneficial long position in the shares of IRM, TRNO, REXR either through stock ownership, options, or other derivatives. I wrote this article myself, and it expresses my own opinions. I am not receiving compensation for it. I have no business relationship with any company whose stock is mentioned in this article.
Important Notes and Disclosure All articles are published and provided as an information source for investors capable of making their own investment decisions. None of the information offered should be construed to be advice or a recommendation that any particular security, portfolio of securities, transaction, or investment strategy is suitable for any specific person. The information offered is impersonal and not tailored to the investment needs of any specific person. Readers should verify all claims and do their own due diligence before investing in any securities, including those mentioned in the article. NEVER make an investment decision based solely on the information provided in our articles. It should not be assumed that any of the securities transactions or holdings discussed were profitable or will prove to be profitable. Past performance does not guarantee future results. Investing in publicly held securities is speculative and involves risk, including the possible loss of principal. Historical returns should not be used as the primary basis for investment decisions. Commentary may contain forward-looking statements which are by definition uncertain. Actual results may differ materially from our forecasts or estimations, and 2MCAC and its affiliates cannot be held liable for the use of and reliance upon the opinions, estimates, forecasts, and findings in this article. S&P Global Market Intelligence LLC. Contains copyrighted material distributed under license from S&P 2nd Market Capital Advisory Corporation (2MCAC) is a Wisconsin registered investment advisor. Simon Bowler is an investment advisor representative of 2nd Market Capital Advisory Corporation.
Seeking Alpha's Disclosure: Past performance is no guarantee of future results. No recommendation or advice is being given as to whether any investment is suitable for a particular investor. Any views or opinions expressed above may not reflect those of Seeking Alpha as a whole. Seeking Alpha is not a licensed securities dealer, broker or US investment adviser or investment bank. Our analysts are third party authors that include both professional investors and individual investors who may not be licensed or certified by any institute or regulatory body.