Sentiment Update: Too Many Bearish Investors Signals Higher Prices

Summary
- The article discusses two master sentiment indicators, one for long-term expectations and one for short-term periods. Both are signalling this market is going higher.
- After a long price advance, it is very positive when investor sentiment rapidly switches from bullish to bearish during a small price correction. This is happening now.
- The ratio of money going into ProShares bear funds versus bull funds is still too high. This bull market is safe until more investors become convinced it's real.
Henrik5000
We created two master sentiment indicators. One measures investor expectations for the long term, the other for the shorter term. They’re formed by combining numerous other sentiment indicators into one indicator in a mathematically consistent way.
The Short-Term Master Sentiment Indicator
This graph below is the short-term master sentiment indicator. It's made from seven other indicators and is updated daily. This graph goes from 2018 to present but it’s been back tested to 2010. It’s graphed on the Sentiment King ranking scale, which is explained in this earlier article Master Sentiment Indicator Points To Higher Prices.
Essentially, Green Zone readings represent extreme bearish sentiment, which is bullish for the stock market. Red zone readings represent extreme bullishness, which is not good for higher prices. In other words, the master sentiment indicator is a contrary opinion indicator.
Short Term Master Sentiment Indicator (The Sentiment King)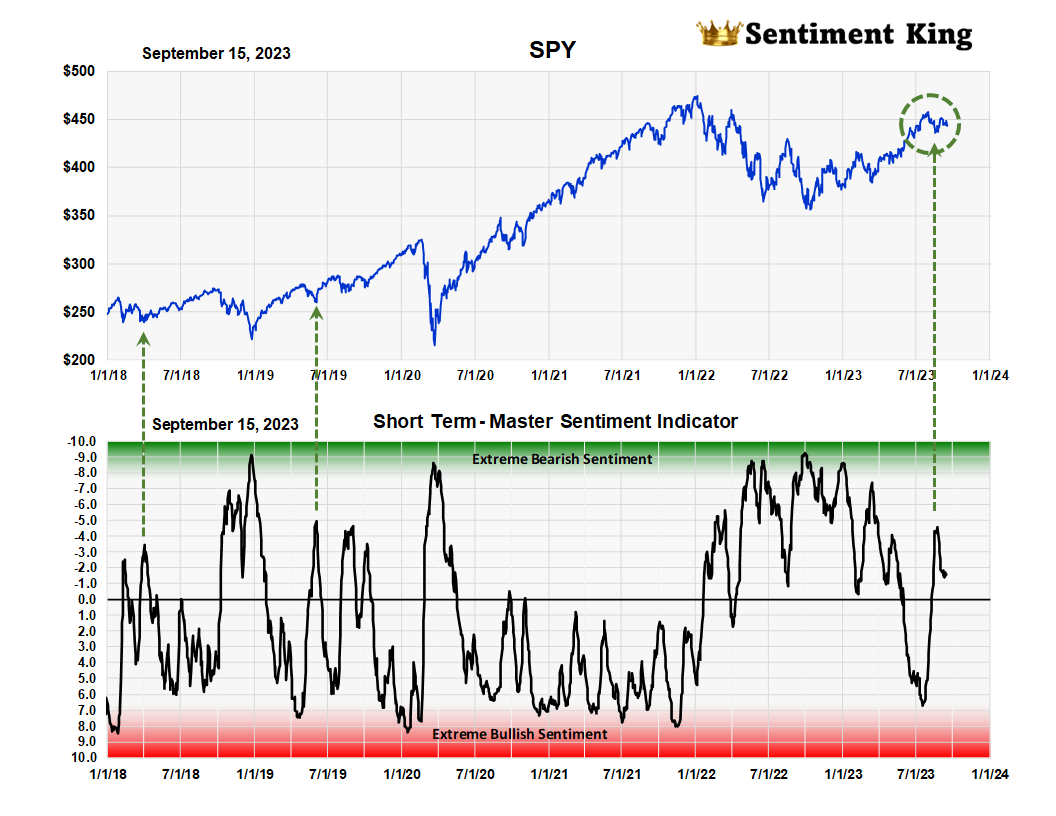
After July's rapid reversal in sentiment from red towards green, indicated by the green arrow, it continues to hover on the green or bearish side of neutral. These rapid reversals in sentiment are important since they show investor skittishness. It supports the idea that the current market is in a high level consolidation (we've circled this with green dashed line). Investors should worry when a market decline has little effect on investor sentiment since it represents complacency.
The Long-Term Master Sentiment Indicator
The next chart is the long-term Master Sentiment Indicator and is a combination of nine indicators. It’s recalculated weekly and is used to forecast bull or bear markets.
Long term Master Sentiment Indicator (The Sentiment King)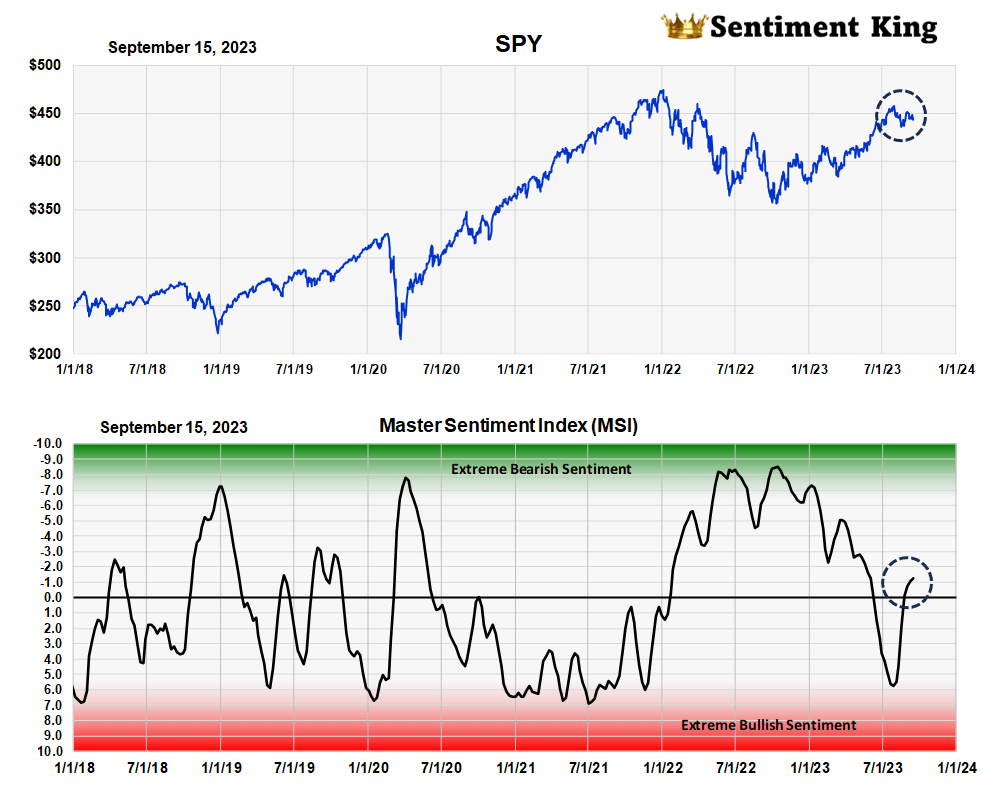
The chart shows that long term expectations (black circle) also remain on the green or bearish side of neutral. After reaching close to the red zone area in July, this indicator too has quickly swung back to a neutral reading.
Again, this kind of rapid reversal in sentiment is usually indicative of a market about to move higher. As long as unexpected global events don’t disturb the situation, we believe the market is headed higher.
We will now look at what the individual indicators that make up these master indicators are signaling. We put them in two categories - those based on surveys, and those based on what investors are buying and selling.
Investor Surveys and Opinions
This table shows the five surveys that go into our master indicators. It has the same red and green zones as the top and the bottom and a "X" marks where each indicator is on the ranking scale.
As you can see, three indicators have neutral readings, while the Investors Intelligence survey shows some bullishness, while the NAAIM survey shows about the same degree of bearishness. The average, which is marked by the yellow "X", is neutral.
Table of Surveys of Bullish or Bearish Sentiment (The Sentiment King)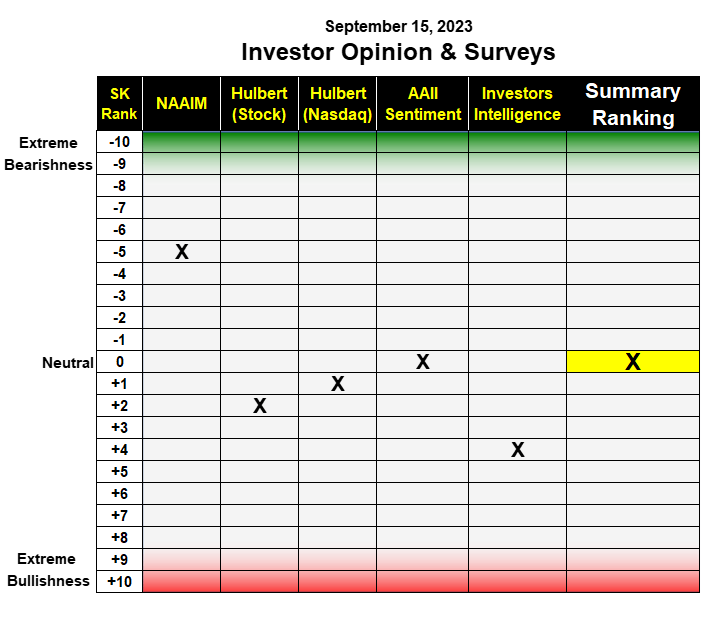
NAAIM Exposure Index: The American Association of Active Investment Managers (NAAIM) has an average investment position of 58%, which puts it at -5 on the scale. This cautious ranking makes it the most bearish of all the investment surveys.
Hulbert Surveys: There are two Hulbert surveys of newsletter writers – a general market survey and one focused only on the Nasdaq. They continue to be slightly on the bullish side of neutral.
AAII Member Sentiment Survey: Last week, 34% of AAII members were bullish while 34% percent were bearish. Members are equally divided on whether the market is going to go up or down. Our ranking of the moving average of their weekly numbers is at zero, which is completely neutral.
Investors Intelligence Newsletter Survey: Last week, 50% of newsletter writers were bullish, 22.5% bearish and 27% were expecting a correction. The Sentiment King ranking of this survey is +4, which locates it halfway between a neutral opinion and an extremely bullish one.
Summary of the Opinions and Surveys: At this time, the ranking of all the investment surveys averages to a completely neutral reading.
Buying and Selling Expectations of Investors
This table shows the sentiment ranking of six buying and selling indicators. They essentially measure if investors expect the market to go up or down. We consider the outlook for the market is bullish when too many investors get bearish in the buying, and vice versa.
Table of Investor Buying and Selling Expectations (The Sentiment King)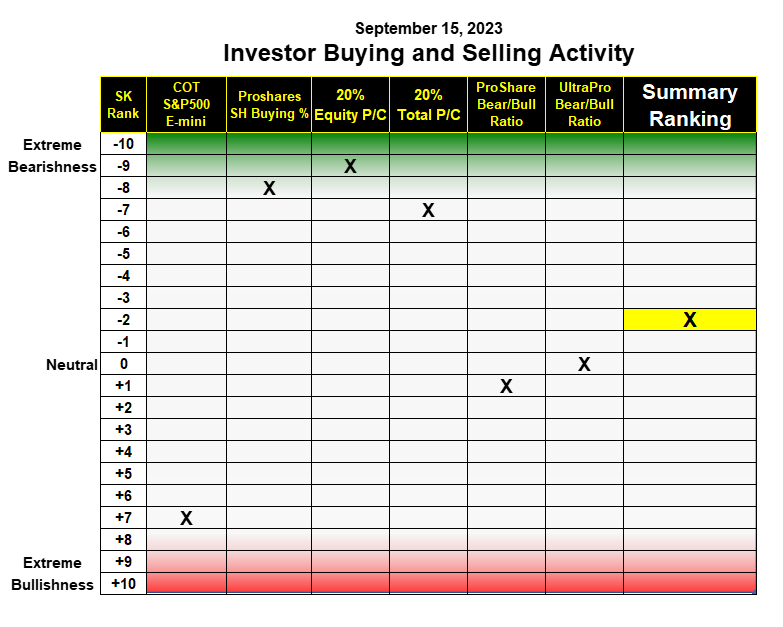
S&P 500 E-mini COT – Trader data for the S&P 500 E-mini futures shows a below average amount of short selling by money managers. This gives it a +7 ranking, which is one number away from a red zone reading, indicating too much optimism.
ProShares Short S&P 500 fund (SH): This indicator measures buying levels of the ProShares S&P 500 short fund SH. It currently shows a high level of buying, which puts it at -8. This is one number away from the green zone, which represents "too much" interest in the short side of the market by investors.
"Puts to Calls" Ratio: Both the equity "puts to calls" and total “puts to calls” ratios continue to show high levels of interest in “put” buying by investors. One is ranked -8, while the other is ranked -9. This is very bullish since it’s unusual to have this high of interest in “put” buying after an 11-month rally.
ProShares Bear/Bull Ratios: We measure investor buying of ProShares short funds compared to long funds. One measures just UltraPro funds, the other compares all the ProShares funds. Both metrics are at a neutral ranking.
Summary of Buying and Selling Indicators - The overall score for all six indicators of investor activity is minus 2, which is the bearish side of neutral and one rank less than two weeks ago.
Indicator Focus
At each sentiment update, we focus on one of the indicators that goes into making up our master indicators. Today’s indicator compares the amount of money going into ProShares "bear" funds versus "bull" funds, specifically the highly leveraged, UltraPro funds.
Ratio of Buying of ProShare UltraPro Bear and Bull Funds (The Sentiment King)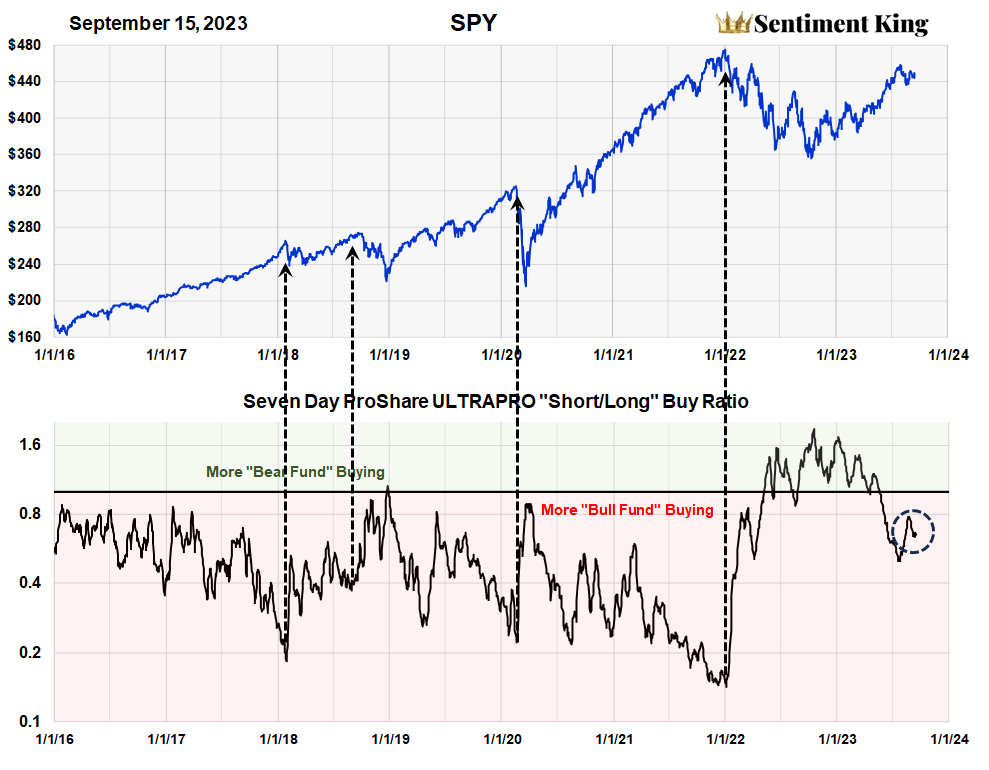
This chart shows the ratio of the amount of buying in all the ProShares UltraPro "short" funds divided by the amount of buying in the UltraPro "long" funds. These eight funds - four long and four short - contain $28 billion in assets and represent 43% of the ProShares fund family. This buying and selling metric measures the market expectations of millions of investors, so it is very broad based.
History shows that investors are consistently more bullish than bearish, so more money goes into bull funds than bear funds, except at lows in bear markets. History also shows that "peak" interest in bull funds usually occurs at the very top of the market, right before a major decline. We've indicated the moments of "peak" bullish interest that occurred right before bear markets with arrows.
This becomes a useful fact. It means that one can stay bullish on a market until you get above normal investor interest in bullish funds compared to bear funds. As you can see by the circle, we don't have that now.
We don't think you have to worry about a major market decline until the ratio gets much more extreme. Investor activity in the ProShares bull and bear funds strongly suggests this market has higher to go.
Summary
After a long rally, it is a very positive when investor sentiment rapidly switches from bullish to neutral or bearish during a small price correction. It shows caution, which is positive. We believe it's an important sign that the current correction is temporary and that the rally, which started last October, is about to move higher.
We update these indicators of investor sentiment every two weeks.
This article was written by

Analyst’s Disclosure: I/we have no stock, option or similar derivative position in any of the companies mentioned, and no plans to initiate any such positions within the next 72 hours. I wrote this article myself, and it expresses my own opinions. I am not receiving compensation for it (other than from Seeking Alpha). I have no business relationship with any company whose stock is mentioned in this article.
Seeking Alpha's Disclosure: Past performance is no guarantee of future results. No recommendation or advice is being given as to whether any investment is suitable for a particular investor. Any views or opinions expressed above may not reflect those of Seeking Alpha as a whole. Seeking Alpha is not a licensed securities dealer, broker or US investment adviser or investment bank. Our analysts are third party authors that include both professional investors and individual investors who may not be licensed or certified by any institute or regulatory body.
Recommended For You
Comments (3)
