Hercules Capital: Venture Capital Financier Offering High Yield And Robust Balance Sheet

Summary
- Hercules Capital is an internally managed business development company focused on pre-IPO and M&A in diverse industries. It offers debt financing with an accent on first-lien debts.
- HTGC has a portfolio with 120 technology and life sciences firms comprising the $2.9 billion carrying value of HTGC's debt portfolio. Additionally, it has warrants in 108 businesses for boosting returns.
- HTGC stock is fairly valued based on the dividend discount model. Besides that, it trades at a price to NAV at 1.35.
- Despite that, I give a buy rating because of the company's growth prospects, quality portfolio, and generous dividends.
chiewr
Thesis
Hercules Capital (NYSE:HTGC) is an exciting income investment offering a 10% yield, a robust balance sheet, and strong growth prospects. The company is uniquely positioned in the venture capital industry. It has two advantages: it is internally managed and debt-focused. The former is a rare bird in the VC business. Being a managed company saves expenses for external funds managers, thus improving the company`s bottom line. The latter is often overlooked, but VC debt funders will gain more traction in a higher for longer interest rates environment.
Company Overview
Hercules Capital is one of the few internally managed business development companies (BDCs). It concentrates mainly on pre-IPO and M&A, fast-growing venture capital-backed businesses at their expansion and established phases in a diverse range of technology, life sciences, and sustainable and renewable technology industries. Below is HTGC at a glance. The image is from the Q2 2023 presentation.
Hercules presentation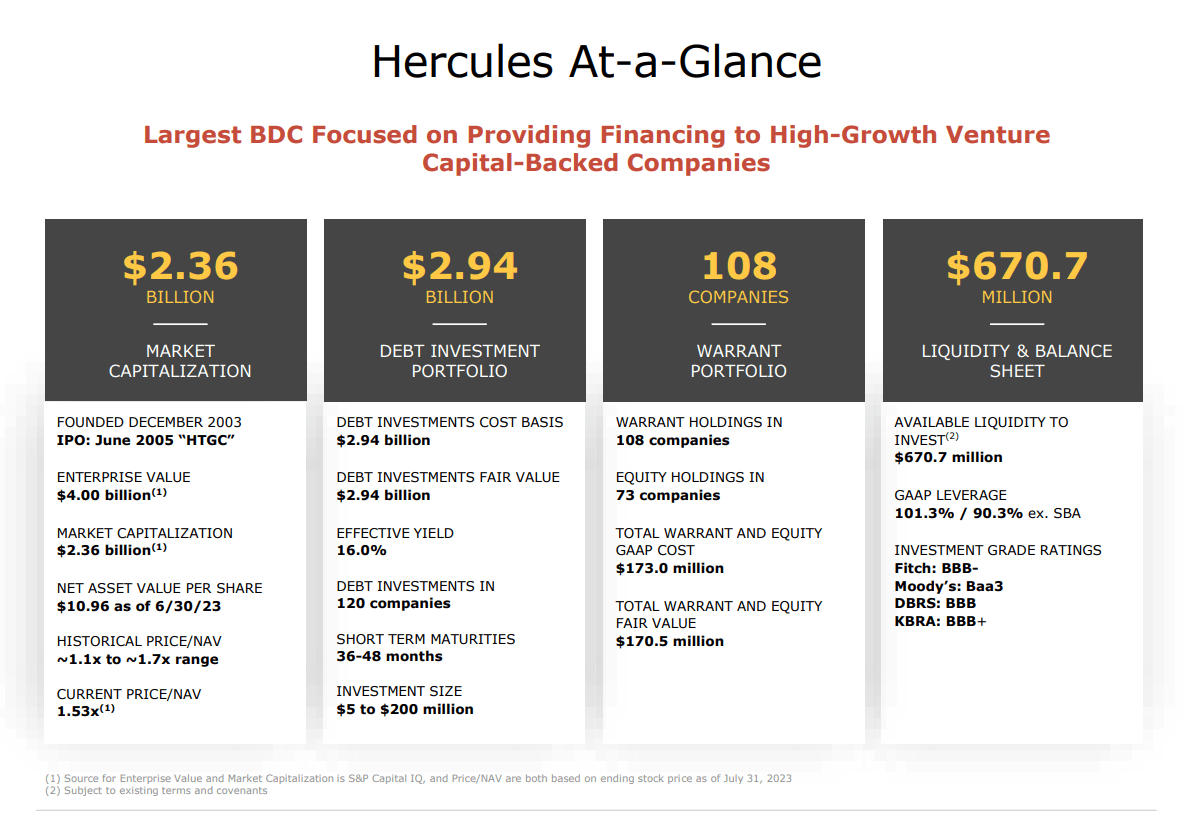
While most people are familiar with venture capital organizations, venture loan companies like HTGC are frequently overlooked. They have a crucial role in the startup ecosystem. In contrast to equity, taking on debt does not reduce current owners' shareholding, and in return, HTGC gets a reliable income stream.
Hercules opts for a debt portfolio with a high asset sensitivity of 95.5% variable rate loans and has interest rate floors. In most cases, the company is the sole lender, and 83.1% of the loans are first liens senior secured. Of the 14.9% of the company`s debt assets that are second-position senior secured, almost 95% have the option for Hercules to purchase the first lien holder. Focusing on sustainable shareholder returns, HTGC`s debt investments typically have short amortizing maturities (36-48 months). Most of the company`s investments include warrants for potential additional returns.
The image below from the last HTGC presentation shows the company`s portfolio in Q2 2023:
Hercules presentation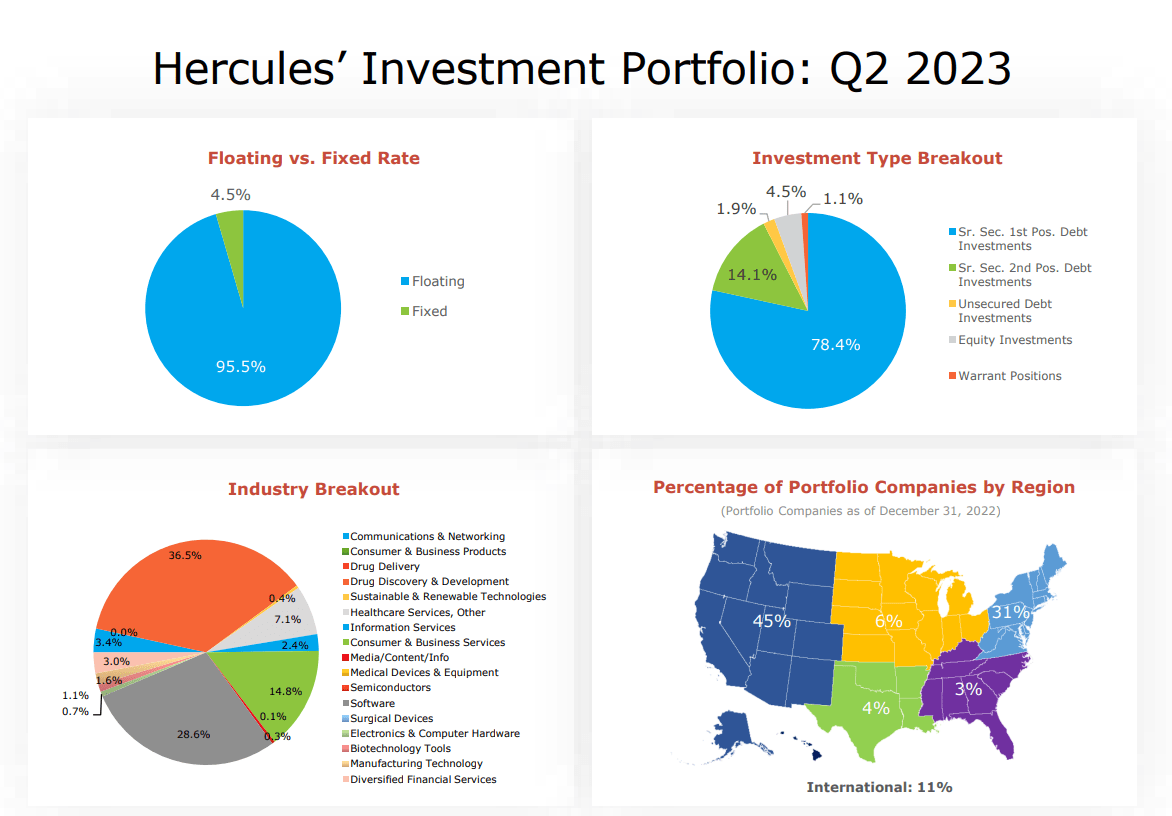
HTGC has a portfolio with 120 technology and life sciences firms comprising the $2.9 billion carrying value of HTGC's debt portfolio. Additionally, it has warrants in 108 businesses, providing a possible equity boost to increase its returns in case of a successful IPO or favorable M&A transaction. The great demand for HTGC's capital is demonstrated by its 16% effective yield on investments, further bolstered by the fact that 95.5% of its loans have a floating rate, allowing them to take advantage of rising interest rates.
Hercules Capital is governed by internal management. This signifies that they manage their investments internally rather than contracting out to a third party. Internally operated BDCs have lower operating costs. This business model has worked well for HTGC. In the ten years since its inception, Hercules has increased its total asset base at a CAGR of 10.4% for assets and 14.6% for net investment income. The chart below show HTGC performance:
Hercules presentation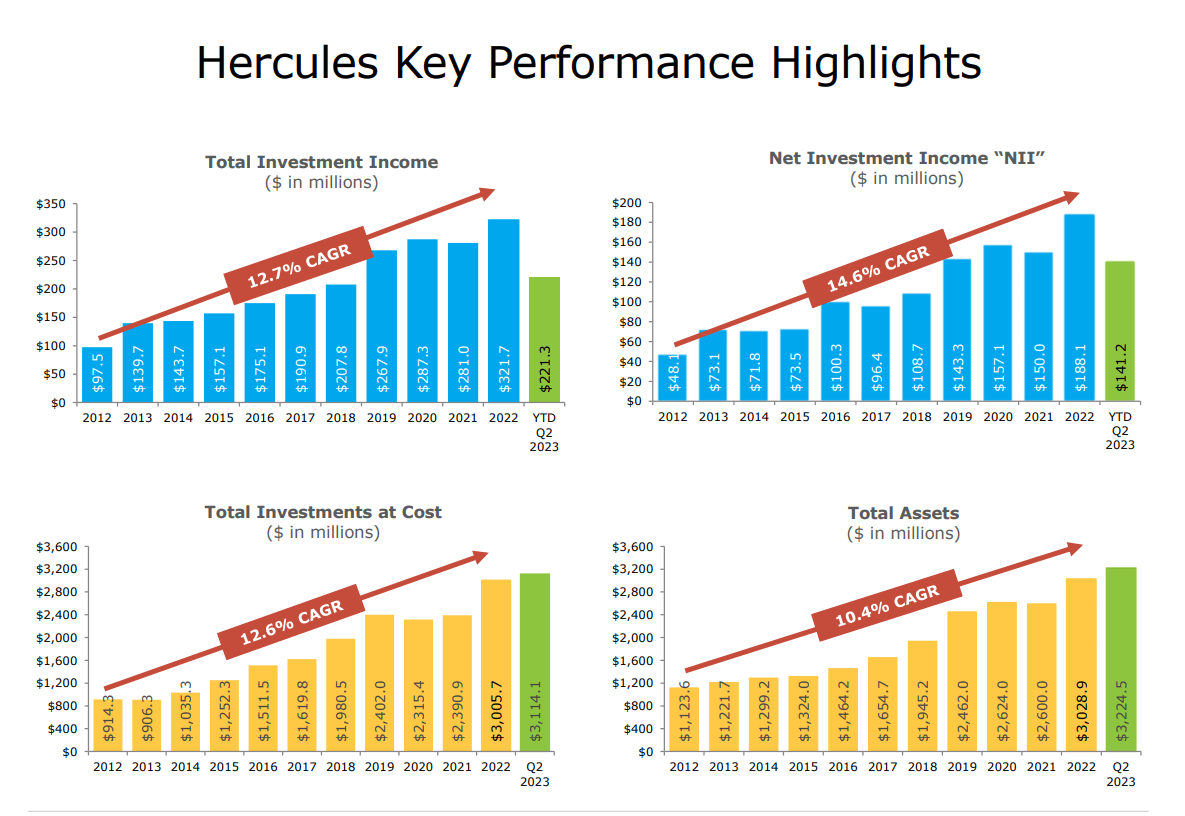
Q2 2023
HTGC shares many similarities with a traditional bank. Net interest margin is one of the best metrics to assess a company`s profitability. Regardless of the uncertain economic conditions, Hercules managed to grow its NIM, as shown below consistently:
Hercules presentation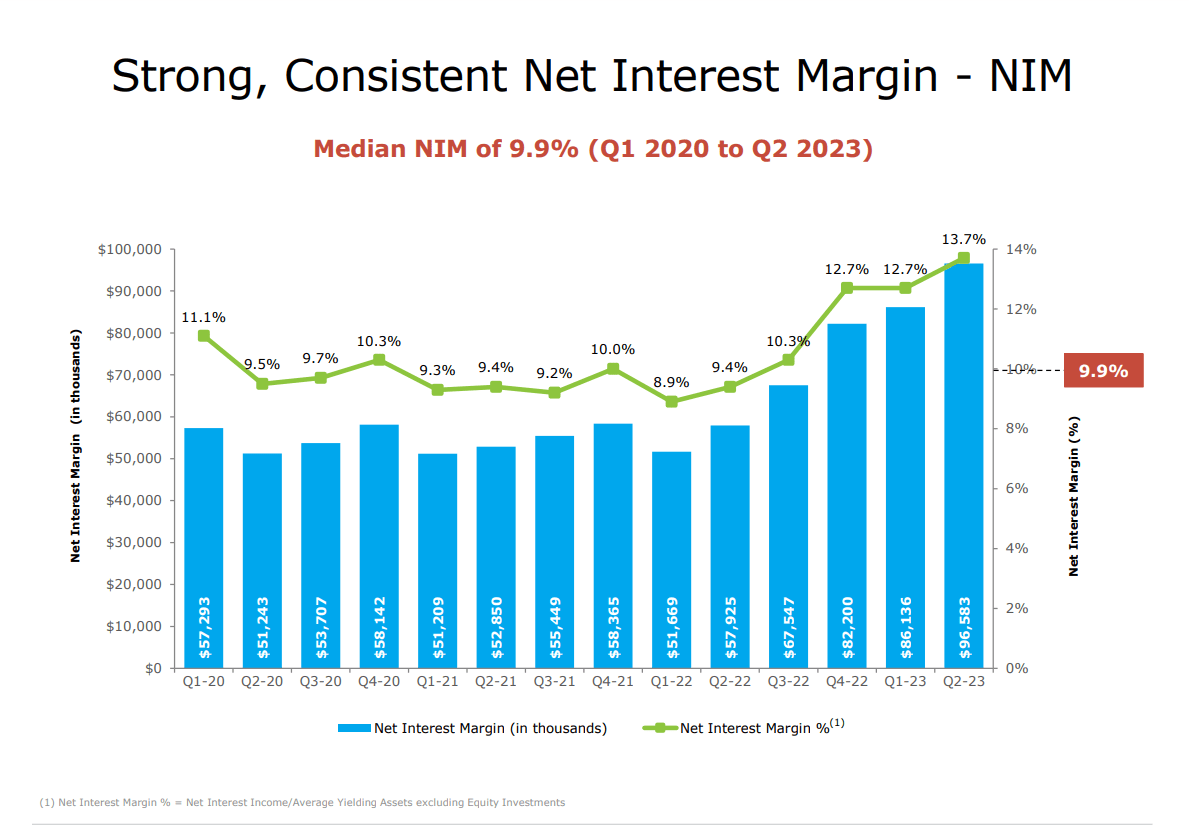
Interest rate hikes are beneficial for the company because they widen the NIM. I expect the rates to stay higher for longer due to the structural inflation period this decade. Hence, the cost of capital will rise, improving HTGC`s profitability in the long term.
Let`s go deeper in the last financial report.
Hercules presentation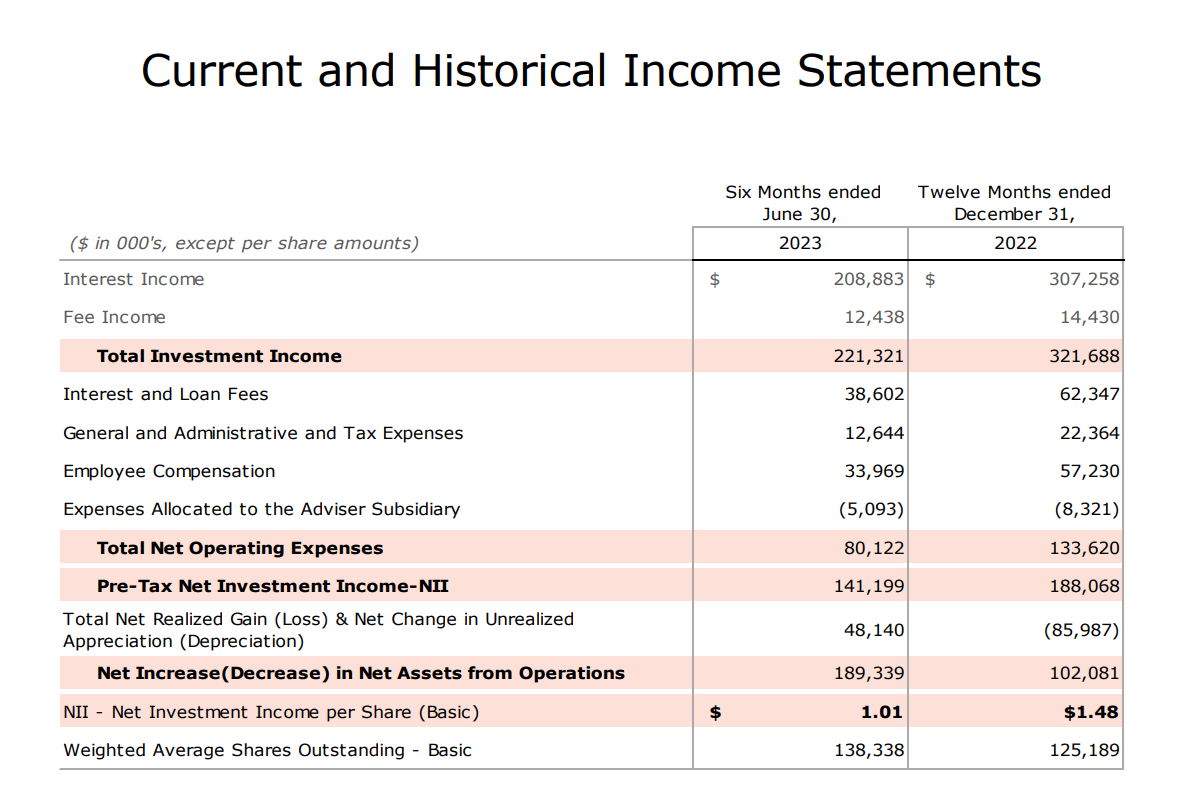
For six months ended in June 2023, Hercules realized declining results. I believe this is short due to the uncertainties in the venture industry. The cost-to-income ratio is more important in the long term than the absolute values. For banks and businesses like Hercules, that ratio shows how much interest the company pays for every dollar earned interest. For H1 2023, the cost to income is 18.5 %, and for H1 2022, it is 20.2 %, which translates into improving net interest margins. Declining G&A and compensation expenses are positive, especially during shrinking profits. This is the advantage of being an internally managed BDC.
Notably, HTGC increased its regular quarterly dividend by $0.01 to $0.40, and a safe 132% coverage ratio, based on $0.53 in NII/share, comprehensively covers the dividend.
Company Financials
The company's finances are healthy, considering its balance sheet. Below is a table showing liquidity and solvency metrics for HTGC. The data is from the last company report.
Quick ratio | 2.2 |
Current ratio | 1.3 |
Long-term debt/Equity | 100 % |
Total debt/Equity | 100 % |
Total liabilities/Total assets | 50 % |
Hercules owns enough liquid assets to weather a potential economic downturn. Its debt structure is well diversified and thus provides another layer of protection. The image below shows the company`s funding sources, portfolio weight, and maturities.
Hercules presentation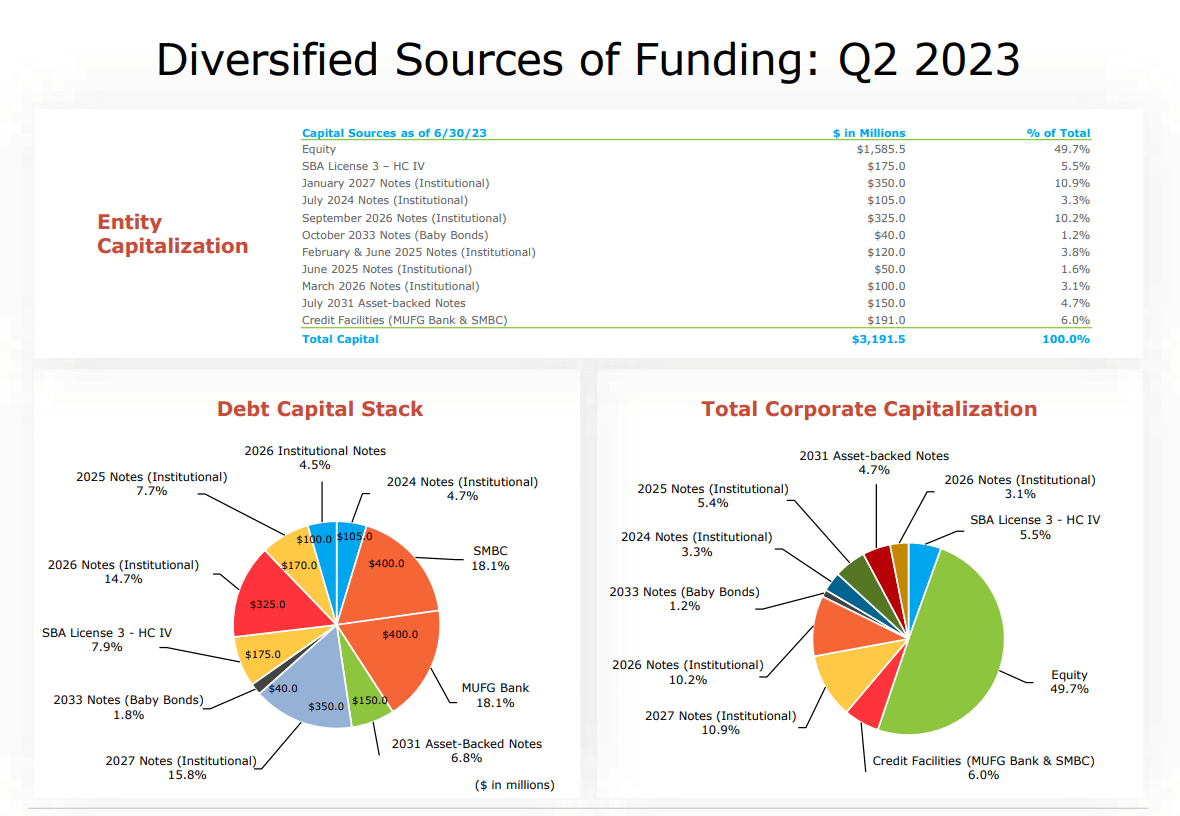
The next few years must be repaid a small portion of the company`s debt. The company's strong performance and current liquidity position will not cause difficulties.
Fitch Ratings reaffirmed Hercules' BBB- investment grade rating. The company intends to maintain a high-quality debt portfolio focusing on first-lien debt and asset coverage ratio above 25 %, while the unsecured debt is at 35 % of total portfolio weight.
HTGC`s performance is impressive. The table below illustrates some profitability metrics to measure HTGS`s efficiency. The data is from the last company report.
Interest income TTM /EV | 10 % |
Fees Income TTM/EV | 0.6 % |
Gross Margin | 100 % |
FCF Margin | 41.2 % |
ROE | 20.7 % |
ROI | 6.79 % |
Net Income per employee | $ 3,050,000 |
The company excels compared to its peers and its five-year average numbers. The most significant achievement is Net Income per employee at $ 3 million. Those numbers are more typical for royalty and streaming companies. It is 30 times higher than its peer's average. Being an internally managed BDC is one of the reasons for such outstanding performance. Efficient personnel is among the best moats one company can have, regardless of the industry. It significantly increases the business's chances to perform well in the long term.
Historically, the HTGC outperformed its competitors on ROE and ROA, too. The image below from the last company presentation illustrates that.
Hercules presentation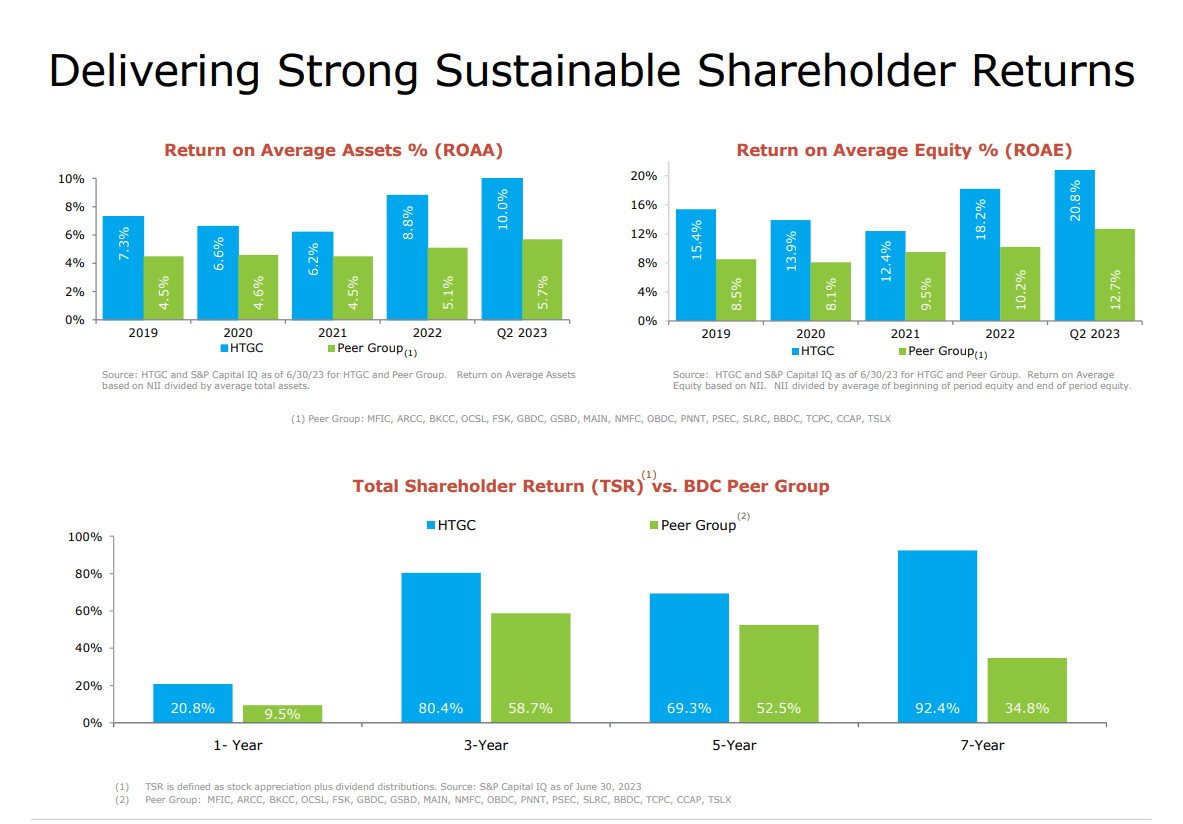
Strong results reflect the shareholders' returns. The latter exceeds the peer group average. HTGC distributes attractive dividends. This year, HTGC has distributed three special dividends totaling $0.24 per share. Below, I compare HTGC with similar companies based on their dividend metrics.
Seeking Alpha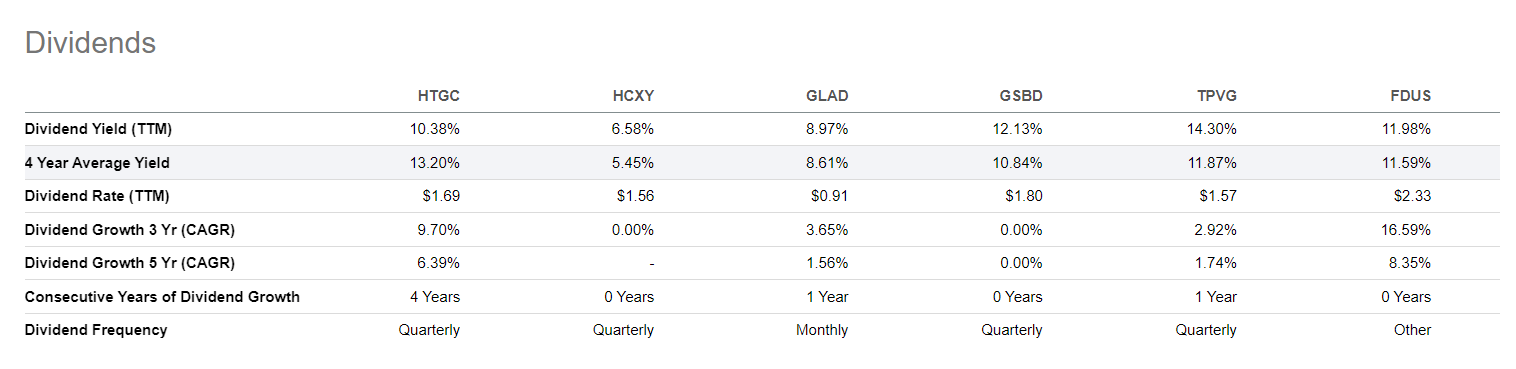
At first glance, HTGC`s dividend is not that attractive. However, dividend growth for five years CAGR is considerably higher.
Company Valuation
To calculate HTGC value with the Dividend Discount Model, I have to measure the price of the company's equity and levered beta.
To obtain those numbers, I use the following steps and assumptions:
- Risk-free rate equals the 5Y average of USA long-term Government bond Rate, 2.2%.
- Growth rate, g, equals the 5Y average of the USA long-term Government bond Rate, 2.2%.
- US's equity risk premium is 5.00 %.
- HTGC' unlevered Beta 0.96
- HTGC Debt/Equity ratio 100 %.
- The US`s effective tax rate is 25 %.
- HTGC dividend (TTM) $ 1.59
- Calculate Levered Beta with the formula below:
Levered Beta = Unlevered Beta * (1+D*(1-T)/E).
2. Calculate the discount rate (discount rate as the cost of equity) using the resulting value for leveraged beta. The formula I use is:
Cost of Equity = Risk-Free Rate + (Levered Beta * Equity Risk Premium).
3. Calculate the Terminal Value of dividends considering the Cost of Equity and Expected dividend growth:
Terminal Value = Dividend per share * (1 + expected dividend growth) / (Cost of Equity - Expected Dividend Growth)
4. Calculate the Present Value of Terminal Value assuming a constant discount rate for ten years.
For HTGC, I get the following results:
Intrinsic value per share = $ 17.21
Current Market price = $ 16.50 on Sept 16, 2023
Based on the dividend discount model, Mr. Market fairly priced Hercules. Given its price-to-NAV ratio, HTGC is not a cheap investment. The image below shows the price to NAV development for the last four years.
Hercules presentation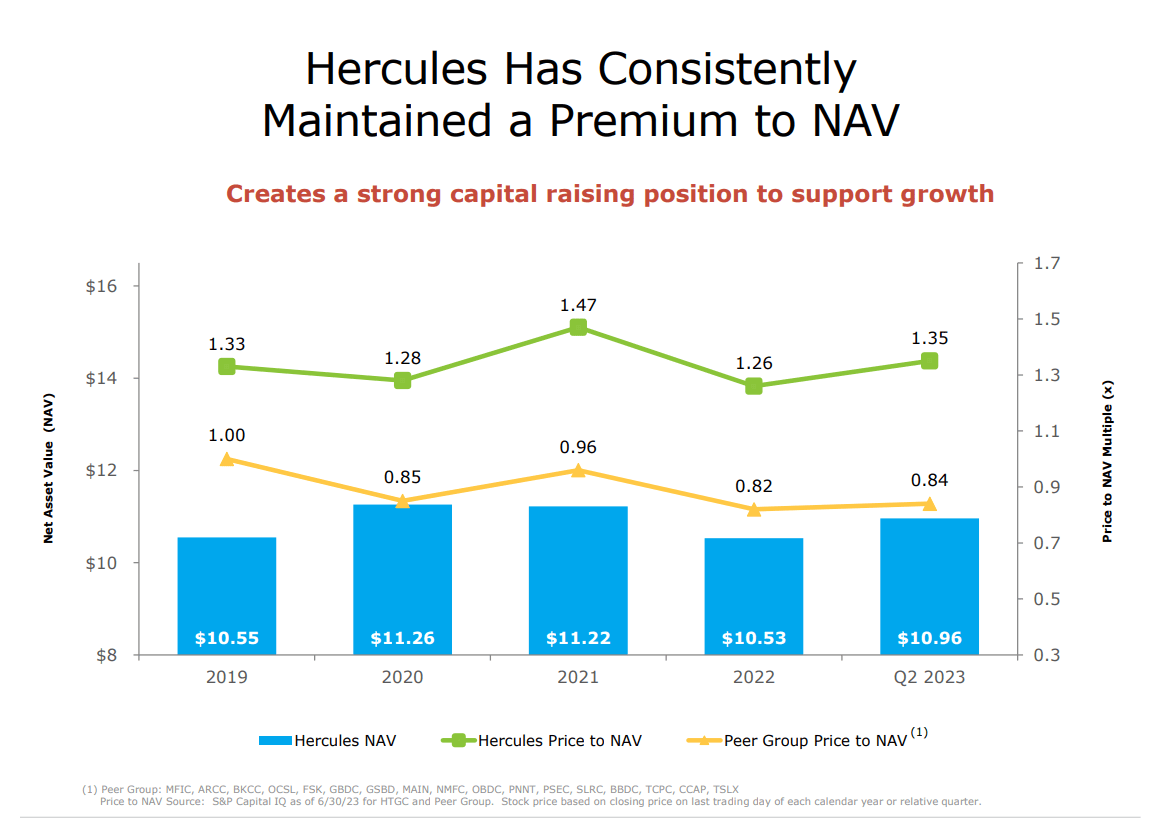
Risks
HTGC shares many similarities with banks. Thus, the inherent risks for the company are the same: liquidity, credit, market, and operational. As discussed above, HTGC has adequate liquidity to pay its debts without affecting its ability to invest in new businesses and distribute dividends. The credit risk is more pronounced. However, HTGC managers mitigated the risk with a proper loan portfolio structure emphasizing first-lien debts and an asset coverage ratio above 25 %.
The operational risk is always present. Being idiosyncratic is challenging to measure. Relying on the company`s long history and managers' expertise, I assume that risk is existent but negligible.
The double-bladed sword of rising interest rates deserves special mention. First, it increases the company`s NIM but impacts the HTGC borrower's liquidity. If the latter cannot meet its debt obligations, it will significantly increase Hercules's credit risk. I expect that the FED will pivot in 2024 with one more interest rate hike on the way. However, forecasting interest rates is one of the most unfruitful exercises. That said, HTGC has a liquidity buffer to keep the company out of trouble in case of a defaulted borrower.
Conclusion
Hercules is a rare gem and is priced as such. It is among a few internally managed BDCs focused on debt financing. It invests primarily in technology and life science. HTGC is concentrated in first-lien debt and asset coverage ratio above 25%. Its balance sheet provides adequate liquidity to pay its debts, expand its portfolio, and maintain growing dividends. HTGC is fairly valued based on the dividend discount model. Besides that, it trades at a price to NAV at 1.35. Despite that, I give a buy rating because of the company's growth prospects, quality portfolio, and generous dividends.
This article was written by

Analyst’s Disclosure: I/we have no stock, option or similar derivative position in any of the companies mentioned, and no plans to initiate any such positions within the next 72 hours. I wrote this article myself, and it expresses my own opinions. I am not receiving compensation for it (other than from Seeking Alpha). I have no business relationship with any company whose stock is mentioned in this article.
Seeking Alpha's Disclosure: Past performance is no guarantee of future results. No recommendation or advice is being given as to whether any investment is suitable for a particular investor. Any views or opinions expressed above may not reflect those of Seeking Alpha as a whole. Seeking Alpha is not a licensed securities dealer, broker or US investment adviser or investment bank. Our analysts are third party authors that include both professional investors and individual investors who may not be licensed or certified by any institute or regulatory body.
Recommended For You
Comments (8)
