The Fed May Shatter The Rate-Cut Fantasy This Week

Summary
- The Fed may signal that another rate hike may be needed due to strong economic growth and elevated inflation metrics.
- The bond market sees higher rates, suggesting that the Fed's long-run rate projection may be too low.
- The equity market expects rate cuts, while the bond market predicts rates to remain restrictive, creating a difference of opinion.
- Looking for a helping hand in the market? Members of Reading The Markets get exclusive ideas and guidance to navigate any climate. Learn More »
Kevin Dietsch/Getty Images News
The Fed may pass on raising rates this week, but that doesn't mean they are done. Given the stronger-than-expected economic growth witnessed over the last few months, it seems more likely than not that the Fed will signal through its Summary of Economic Projections that another hike may be needed while removing rate cuts for 2024.
This is critical for the Fed, especially when asset price inflation has skyrocketed, and core inflation metrics stay elevated. On top of that, commodities like oil and gasoline are again on the rise, and that effect can ripple through the economy.
This has already resulted in rates on the back of the yield curve and market-based inflation expectations. Additionally, it puts the Fed in a tough spot because if the market views the Fed as not being aggressive enough against sticky inflation, yields on the back of the curve could rise even further while inflation expectations rise.
This is why the Fed will need to communicate to the market that they remain data-dependent, that a rate hike in November is on the table, and that the unexpected outperformance of the US economy means rates in 2024 may not come down as much as expected.
Communication Through Projections
The June SEP revealed a peak Fed Funds terminal rate of 5.6% in 2023, which is then expected to come down to 4.6% in 2024, 3.4% in 2025, a long-run rate of 2.5%. Given the current data set, it seems most likely that the 2023 projection of 5.6% will remain while the 2024 and 2025 rates move higher and rate cuts are removed from the equation.
Federal Reserve 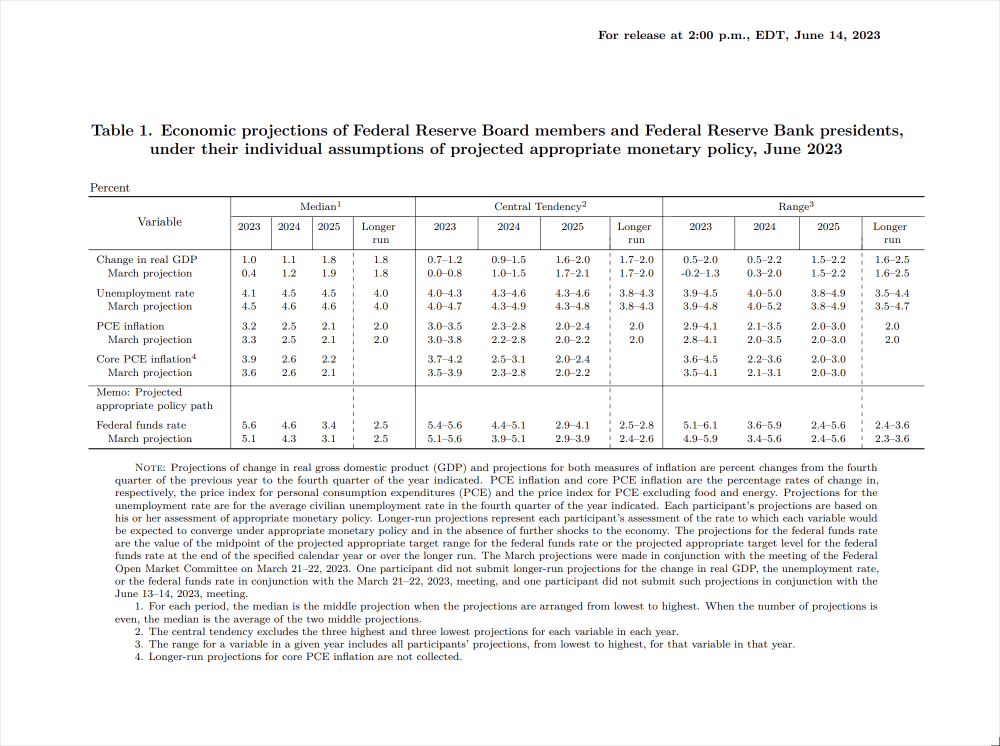
While the long-run rate stayed at 2.5% after the June meeting, its central tendency shifted from 2.4%-2.6% to 2.5%-2.8%. This suggests the Fed may see the neutral rate, which neither stimulates nor restricts economic activity, as potentially higher than before. A 2% inflation target implies a real interest rate of 0.5%. A higher long-run rate could mean the Fed estimates a higher neutral real rate for the economy.
Bond Market See Higher Rates
The market may already be one step ahead of the Fed because currently, the market sees real rates at roughly 2% across the entire yield curve out to 30 years. Compare that to where the market saw rates back in September 2018, when the market saw a neutral rate closer to around 0.75%. In September 2018, the Fed's long-run rate was 3%, with a 2% inflation rate projecting a 1% real yield.
Bloomberg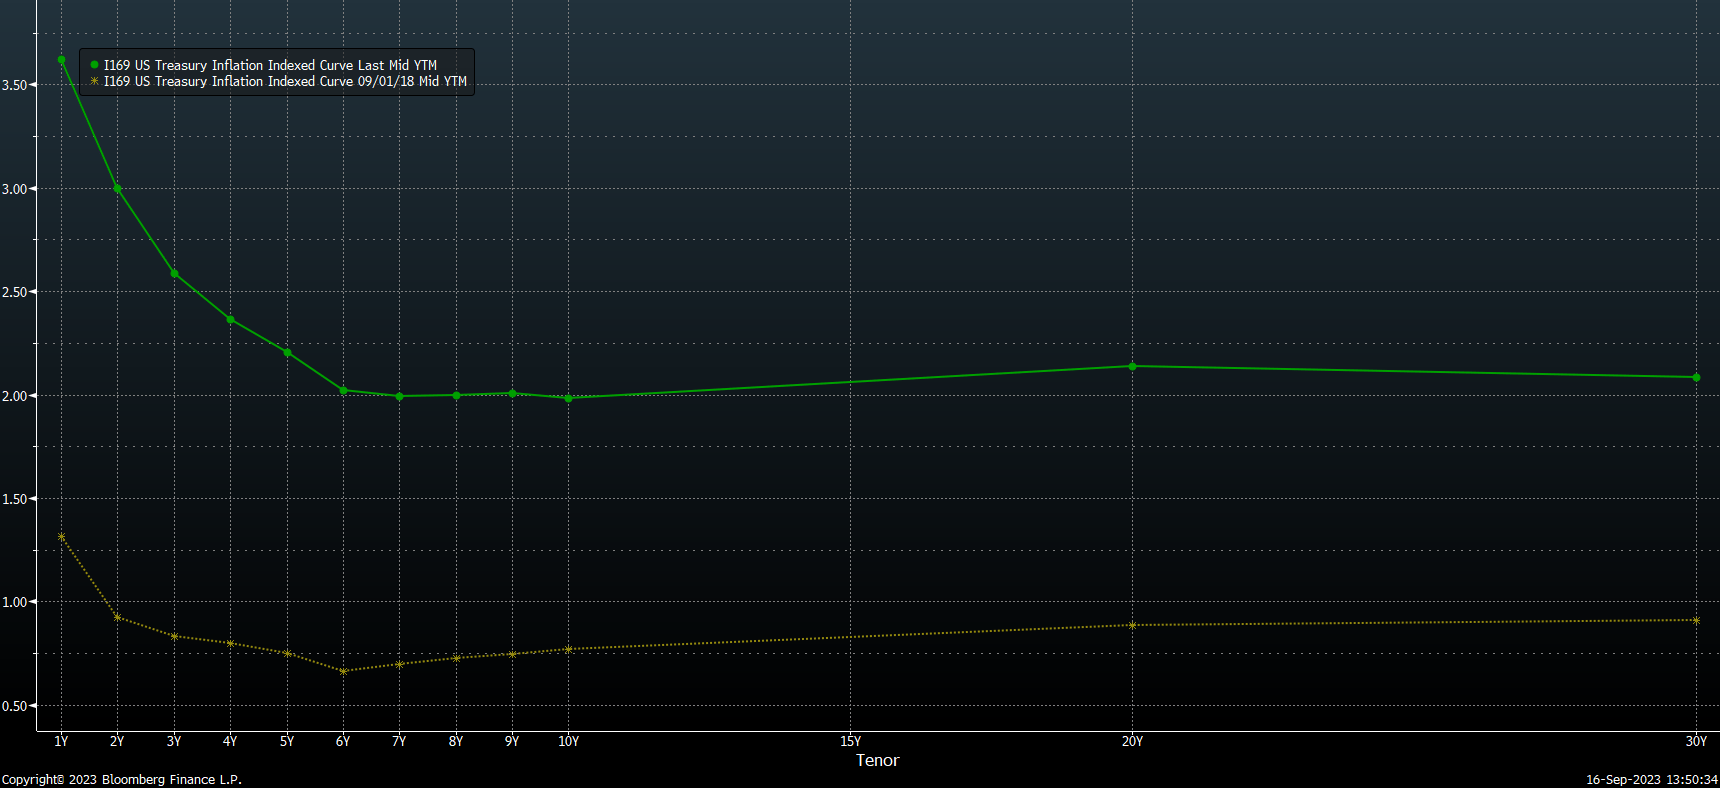
The bond market seems to be saying today that the Fed's idea of the long-run is too low, and that would suggest that one should pay particular attention to any changes in the long-run interest rate. Because it seems on the surface, just by looking at the direction of the earnings yield of the S&P 500, the equity market thinks a slew of rate cuts are coming. This is noted by the earnings yield moving lower while real yields are moving higher. This would suggest that the equity market still doesn't believe the Fed when it says that rates will have to stay restrictive for some time.
Bloomberg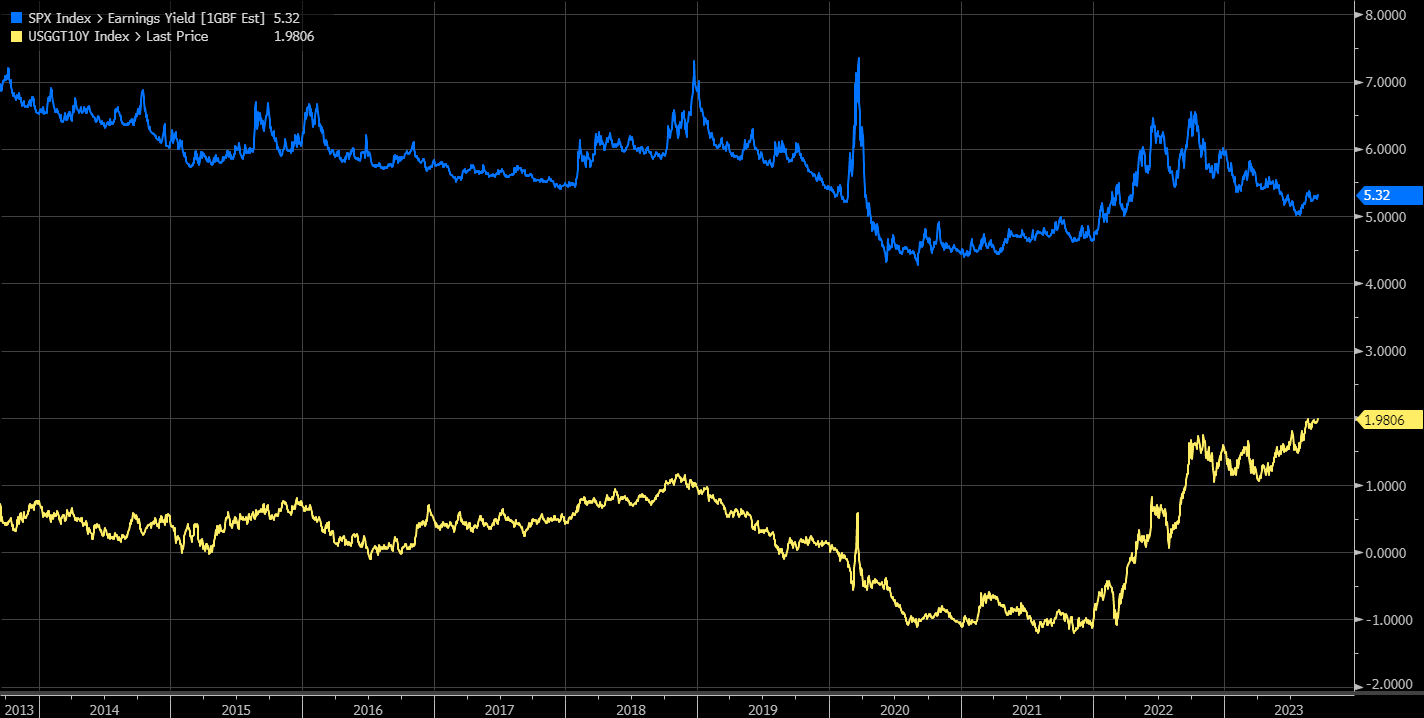
What is interesting at this point is that the bond market is in almost complete agreement with the Fed regarding the path of rates, with a peak policy rate of 5.45%, while seeing rates falling to around 4.6% by the end of 2024, which is what the SEP was forecasting back in June.
Bloomberg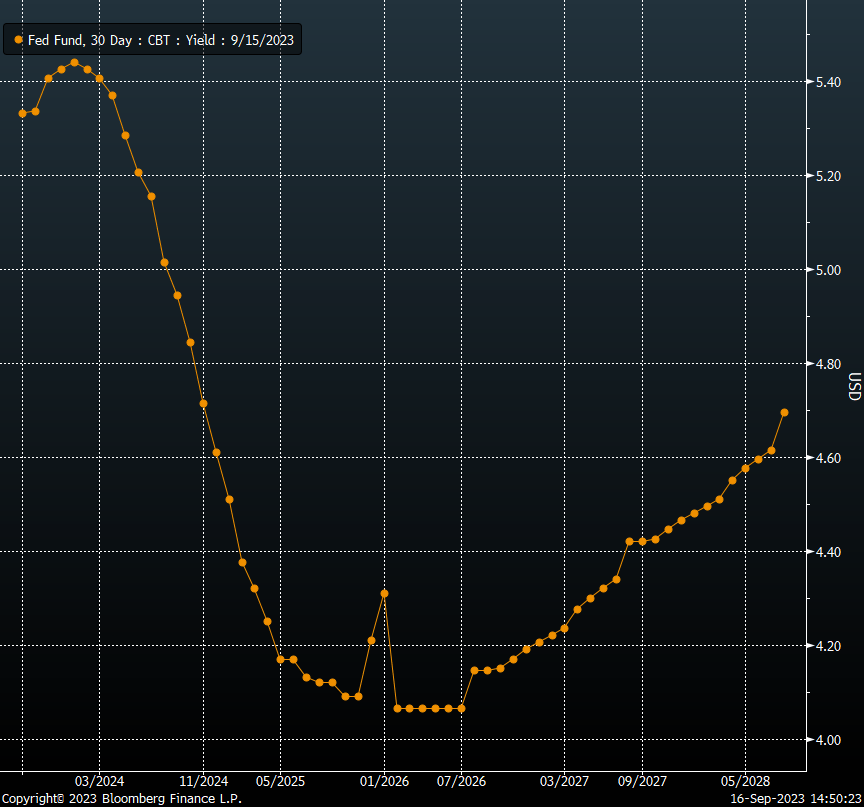
But the question becomes more about that long-run rate because a 2% inflation rate and a 2% real yield would suggest that the nominal rates stay above 4.0% over a very long period. The Fed Funds futures see rates falling to around 4.1% by 2026 and never going below. This would suggest that the Fed cutting rates to 4.6% in 2024 is probably not likely, and that will result in that 2024 estimate rising, and it probably indicates that 2025 estimates of 3.4% is way too low and will need to rise above 4% as well.
Difference of Opinion
However, the equity market seems to be pricing a much lower long-run rate than the bond market. The current earnings yield of the S&P 500 over the next 12 months is 5.3%, while the 10-year real yield is 1.98%, a spread of 3.3%. Historically, that spread averages around 5.4% over the past ten years, a difference of about 2.1%. This means the S&P 500 should be trading with an earnings yield of about 7.4% and with a 5.4% premium over the 10-year real yield, we would get a 2% real yield plus a 2% inflation target rate, giving us a long-run rate of about 4%, almost the same as bonds. However, at an earning yield of 5.3% and an average premium of 5.4%, we get a real yield of -0.1%, plus a 2% inflation target rate would give us a long-run rate of 1.9%.
Bloomberg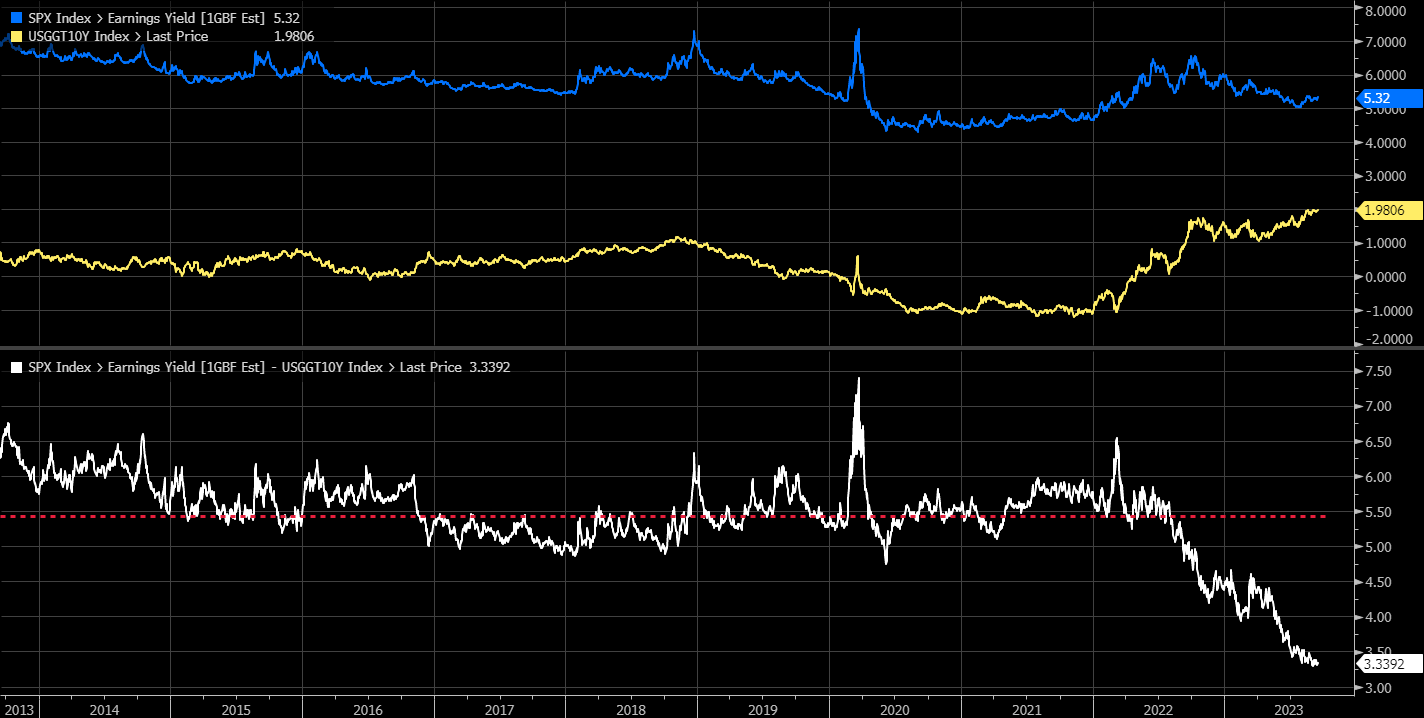
These spreads can change and valuation shift. However, if we just put the numbers aside. The message is that the bond market thinks rates will have to be restrictive for a long time, while the equity market thinks that rates won't be restrictive for a long time and that the Fed will be aggressively cutting rates.
Of course, many things can change over the next two years, and trying to predict the next six months is hard enough, let alone the next 2 or 3 years. But that is not the point; the equity market is betting on many rate cuts, which is not what the bond market says. That message of higher for longer is likely to be shown in this week's FOMC SEP, which should show rate cuts being removed while the equity market still thinks big rate cuts are coming.
TRY READING THE MARKETS AND GET THE FIRST 2-WEEK FREE
Reading the Markets helps readers cut through all the noise, delivering stock ideas and market updates while looking for opportunities. We also educate our members on what drives trading to help them make better decisions.
We use a repeated and detailed process of watching the fundamental trends, technical charts, and options trading data. The process helps isolate and determine where a stock, sector, or market may be heading over various time frames.
This article was written by

I am Michael Kramer, the founder of Mott Capital Management and creator of Reading The Markets, an SA Marketplace service. I focus on long-only macro themes and trends, look for long-term thematic growth investments, and use options data to find unusual activity.
I use my over 25 years of experience as a buy-side trader, analyst, and portfolio manager, to explain the twists and turns of the stock market and where it may be heading next. Additionally, I use data from top vendors to formulate my analysis, including sell-side analyst estimates and research, newsfeeds, in-depth options data, and gamma levels.
Analyst’s Disclosure: I/we have no stock, option or similar derivative position in any of the companies mentioned, and no plans to initiate any such positions within the next 72 hours. I wrote this article myself, and it expresses my own opinions. I am not receiving compensation for it (other than from Seeking Alpha). I have no business relationship with any company whose stock is mentioned in this article.
Charts used with the permission of Bloomberg Finance L.P. This report contains independent commentary to be used for informational and educational purposes only. Michael Kramer is a member and investment adviser representative with Mott Capital Management. Mr. Kramer is not affiliated with this company and does not serve on the board of any related company that issued this stock. All opinions and analyses presented by Michael Kramer in this analysis or market report are solely Michael Kramer's views. Readers should not treat any opinion, viewpoint, or prediction expressed by Michael Kramer as a specific solicitation or recommendation to buy or sell a particular security or follow a particular strategy. Michael Kramer's analyses are based upon information and independent research that he considers reliable, but neither Michael Kramer nor Mott Capital Management guarantees its completeness or accuracy, and it should not be relied upon as such. Michael Kramer is not under any obligation to update or correct any information presented in his analyses. Mr. Kramer's statements, guidance, and opinions are subject to change without notice. Past performance is not indicative of future results. Neither Michael Kramer nor Mott Capital Management guarantees any specific outcome or profit. You should be aware of the real risk of loss in following any strategy or investment commentary presented in this analysis. Strategies or investments discussed may fluctuate in price or value. Investments or strategies mentioned in this analysis may not be suitable for you. This material does not consider your particular investment objectives, financial situation, or needs and is not intended as a recommendation appropriate for you. You must make an independent decision regarding investments or strategies in this analysis. Upon request, the advisor will provide a list of all recommendations made during the past twelve months. Before acting on information in this analysis, you should consider whether it is suitable for your circumstances and strongly consider seeking advice from your own financial or investment adviser to determine the suitability of any investment.
Seeking Alpha's Disclosure: Past performance is no guarantee of future results. No recommendation or advice is being given as to whether any investment is suitable for a particular investor. Any views or opinions expressed above may not reflect those of Seeking Alpha as a whole. Seeking Alpha is not a licensed securities dealer, broker or US investment adviser or investment bank. Our analysts are third party authors that include both professional investors and individual investors who may not be licensed or certified by any institute or regulatory body.
Recommended For You
Comments (2)
