Western Alliance: Good Bank, Great Price, Poor Liquidity

Summary
- Western Alliance Bank Corporation is a decent regional bank with a high percentage of insured deposits and above-average profitability.
- The bank has a healthy balance sheet with relatively low exposure to US treasuries and a well-diversified loan composition.
- WAL has a low cash-to-deposit ratio, which could pose a liquidity risk in another banking system downturn.
- I give WAL a hold rating due to its below-average cash-to-deposit ratio. However, I look forward to seeing WAL`s progress in the long term.

EJ_Rodriquez
Thesis
US regional banks have been under fire for the last six months. Sure, some are overloaded with treasuries held to maturity, thus hiding unrealized losses on their balance sheets. The record pace of interest rate hikes and the bank's portfolio weight of US treasuries created a perilous situation for regional banks. The chart below from Crescat Capital illustrates how serious that issue is:
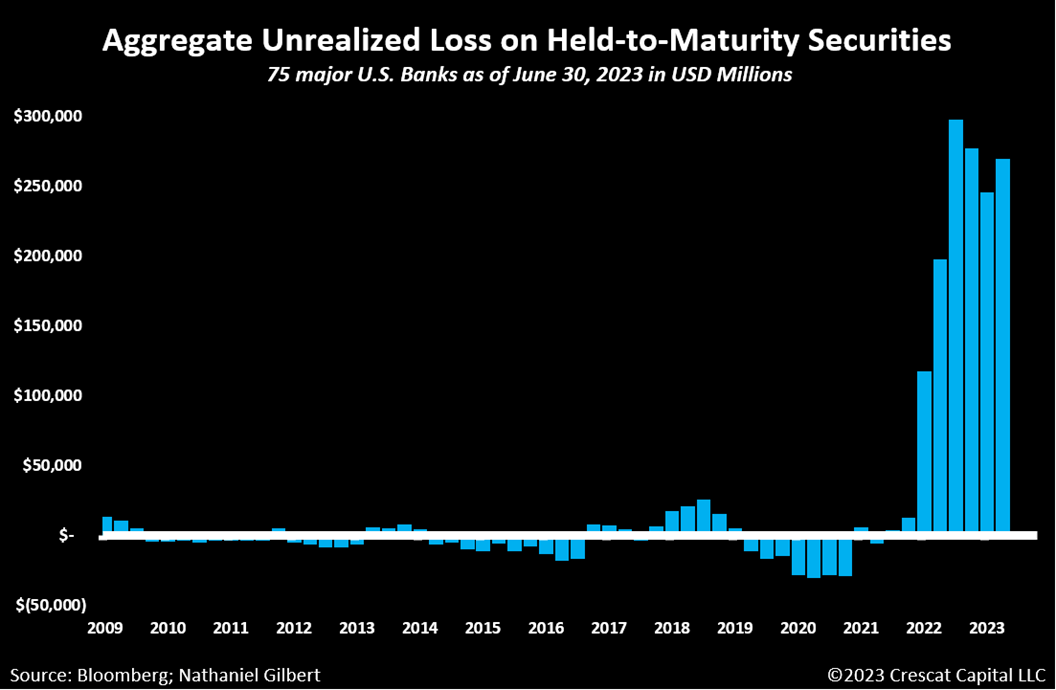
Crescat Capital
However, not all banks are equal, even the regional ones. Western Alliance Bank Corporation is among the safer regional banks. WAL has the highest rate of insured deposits and achieved higher than average profitability. The enterprise is for sale at a price barely covering its book value. However, the offer has a few drawbacks, enough to give WAL a hold rating, at least for now.
Company Overview
Like most regional banks, WAL has had difficulty making up value losses incurred during the March turmoil. Despite that, Western Alliance is among the appealing regional banks given the growing deposits and low number of US treasuries held until maturity (HTM) in its balance sheet.
A significant quantity of deposits poured back to the community bank throughout the second quarter, continuing highly encouraging patterns from the first quarter and the following period, according to Western Alliance's strong Q2'23 report.
The bank has a healthy balance sheet composition. The best thing is its low exposure to HTM and US treasuries. The table below represents WAL's balance sheet dissected into pieces. The data is from the company's last financial report.
Asset ratios: assets structure | |
Cash/Total Assets | 3.2 % |
Loans (ex., Credit cards)/Total Assets | 70 % |
Securities HTM/Total Assets | 1.9 % |
Securities AFS/Total Assets | 12.6 % |
MBS/Total Assets | 3.0 % |
US treasuries/ Total Assets | 3.3 % |
Liability ratios: capital structure | |
Deposits/ Total Liabilities | 82 % |
Other liabilities/ Total Liabilities | 15 % |
Company bonds/ Total Liabilities | 12.9 % |
Equity/ Total Liabilities + Equity | 8.3 % |
Solvency ratios: | |
Loans /Deposits | 94 % |
Cash/Deposits | 3.1 % |
Borrowings (inc. bonds)/ Total Assets | 12.9 % |
One red flag I wish to point out is the low cash-to-deposit ratio. It is lower than the average for small banks. The image below from the FRED database compares cash assets to deposits for small banks (red line) and all commercial banks (blue line).
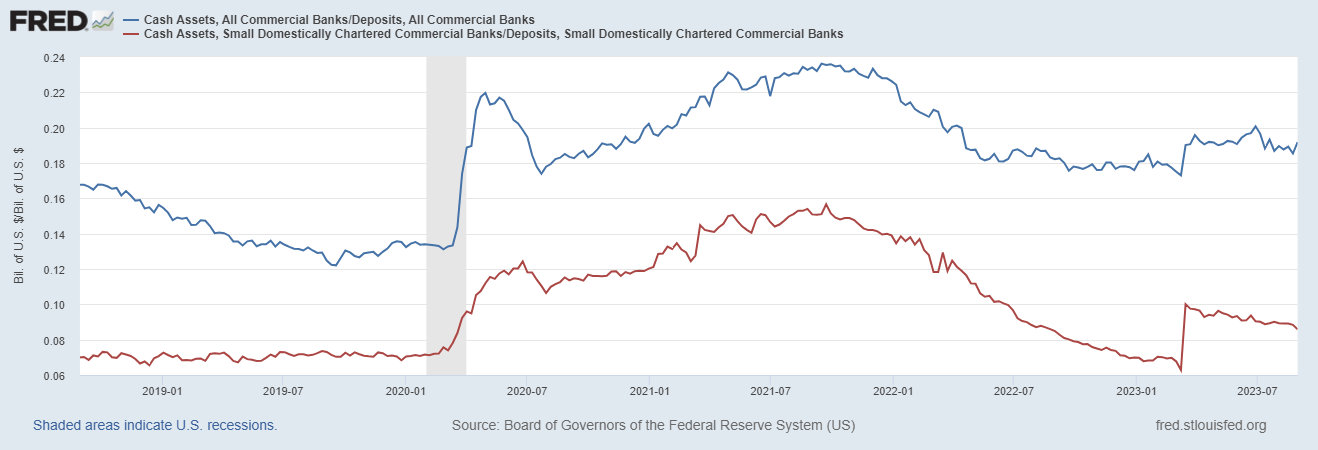
FRED database
Small banks ratio is 8.5 %, while for all banking system is 19 %. In the case of another economic downturn, WAL might end up in a liquidity crisis. Cash reserves will quickly dry up, and the bank has to liquidate other assets.
The loan composition is well diversified between C&I, mortgage consumer, and CRE loans. The image below from the last presentation shows the loan growth for the previous five quarters.
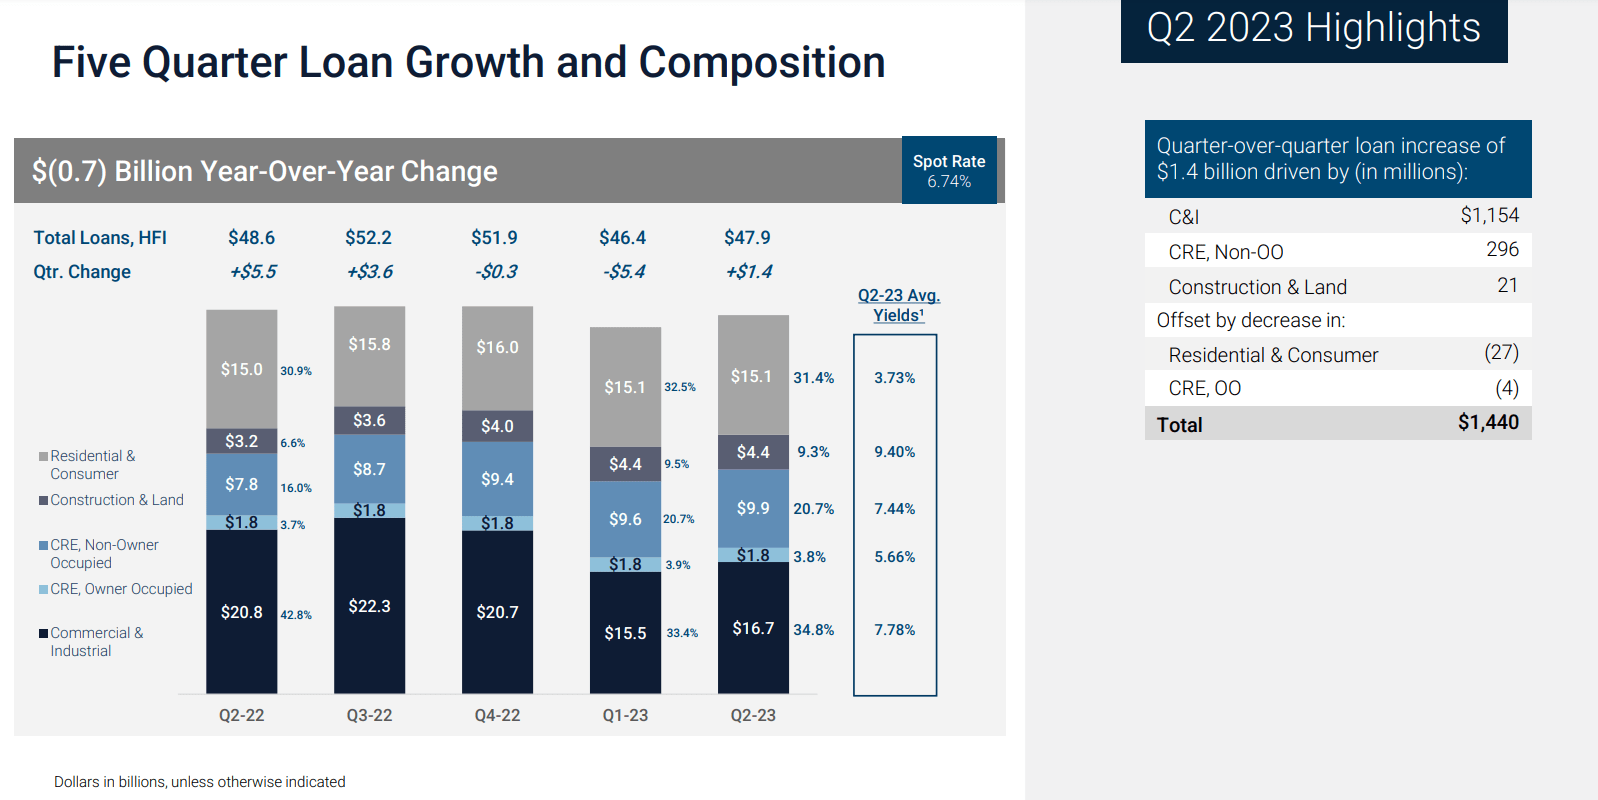
Western Alliance presentation
Given March troubles in the last company's report for Q2, C&I realized a healthy growth of 6%. The value of the loans recorded on the company's books increased from $46.44 billion to $47.88 billion. The company's exposure to loans for office-based real estate is still minimal. Only 23% of its loans for commercial real estate, or 5% of all loans, are for offices.
Let's see how is the right side of WAL's balance sheet.
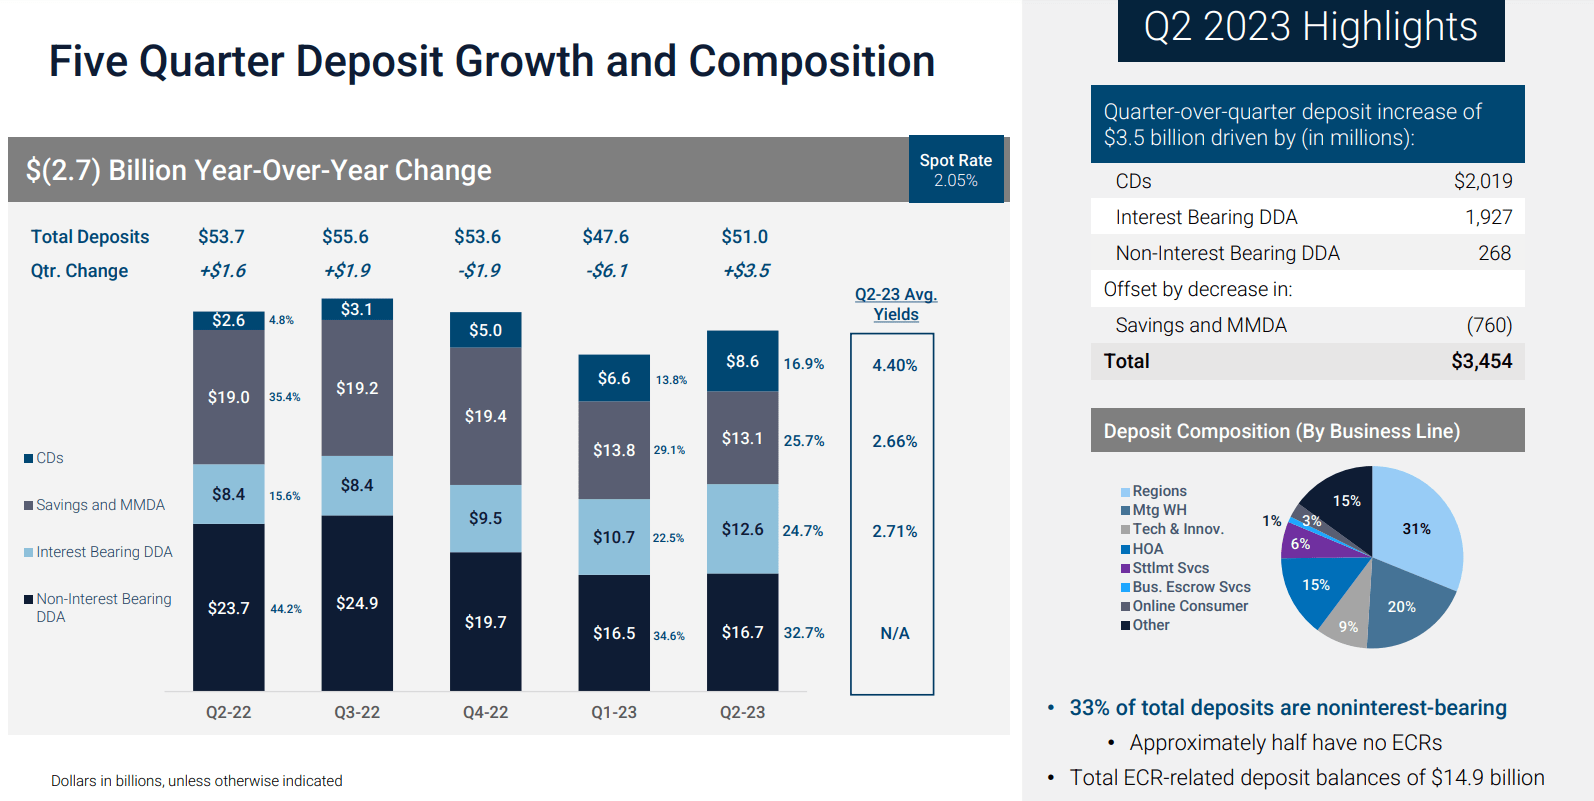
Western Alliance presentation
The deposits are adequately distributed by maturity. However, given the low cash-to-deposit ratio, the demand deposits notably exceed cash reserves. That said, WAL has a high percentage of collateralized deposits, illustrated in the image below:
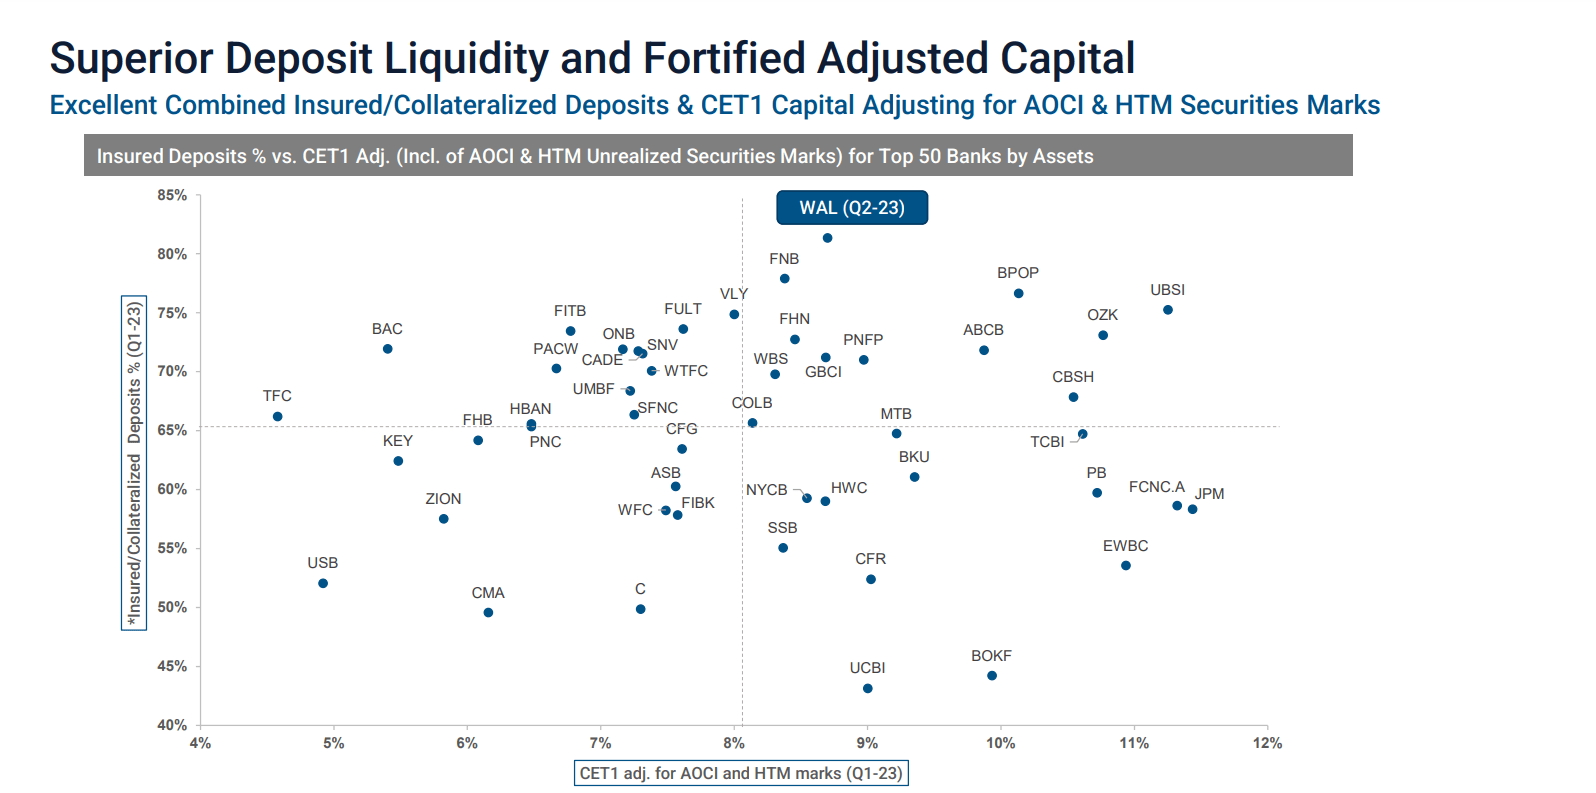
Western Alliance presentation
WAL has more than 80 % of its deposits insured. That fact compensates for the insufficient cash reserves.
Basel III ratios are an efficient guide to estimate a bank's ability to survive. WAL's numbers are not impressive at first glance. The table below illustrates the bank`s capital adequacy.
Basel III Ratios: | |
Regulatory capital ratio (Capital adequacy ratio) | 12.6 % |
Tier 1 ratio | 10.9 % |
CET1 ratio | 10.1 % |
I am not impressed with CET1. The ratio still exceeds Basel III guidelines, but considering the macro environment. I prefer to be higher, at least 12 %.
WAL's profitability exceeds the industry's average. The table below illustrates the bank's performance using profitability metrics. The data is from the last financial report for Q2 2023.
ROE | 17.2 % |
RoTE | 18 % |
RoCET 1 | 19.0 % |
ROA | 2.1 % |
Those numbers are in line with the company's five-year average. That fact has two-fold implications. First, the bank can maintain its robust performance regardless of the circumstances. Second, it might help the bank improve its liquidity in the long term. Relying on insurance and collaterals to cover a company's troubles is good at first sight. Ultimately, someone else pays the bill for management's inability to handle their financial affairs.
The company pays mediocre dividends compared to its peers. I consider any dividend mediocre, providing yield below US T bills. The latter pays you to wait while assuming almost zero risk. That said, if the main incentive to invest in any company is the dividends, their yield has to exceed fixed-income ones. Below, I weigh up WAL with its competitors based on dividend metrics.
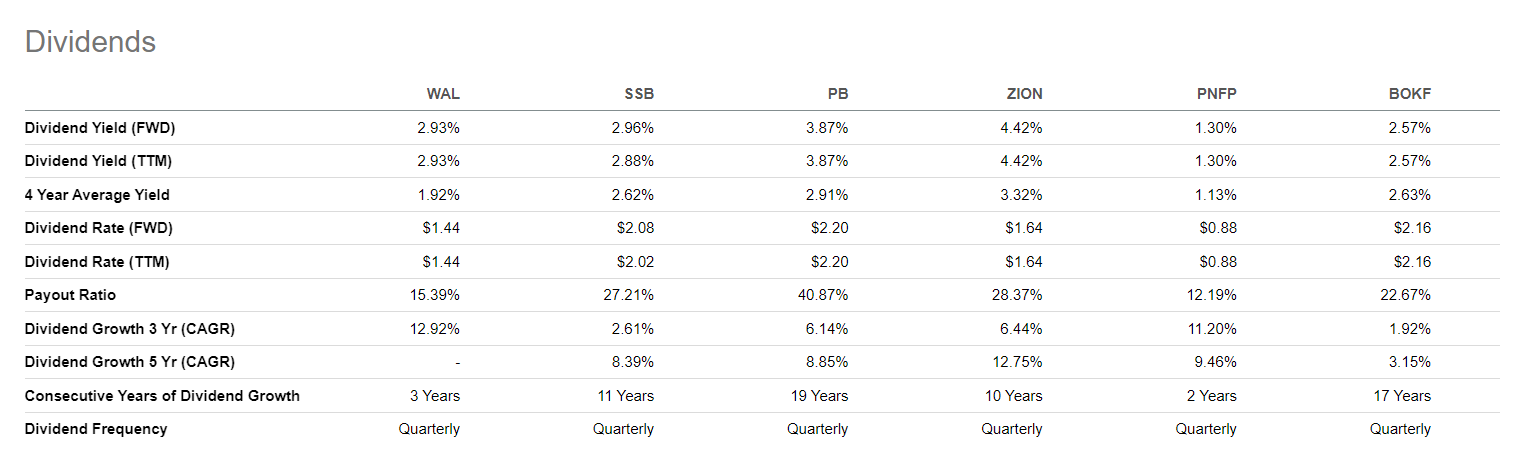
Seeking Alpha
One positive thing about WAL is the dividend growth is among the best. For the last three years, CAGR has been 12.9%.
Q2 results
Before I proceed with the company valuation, let's look at the performance for the last quarter. The table below gives some numbers for Q2, 2023.
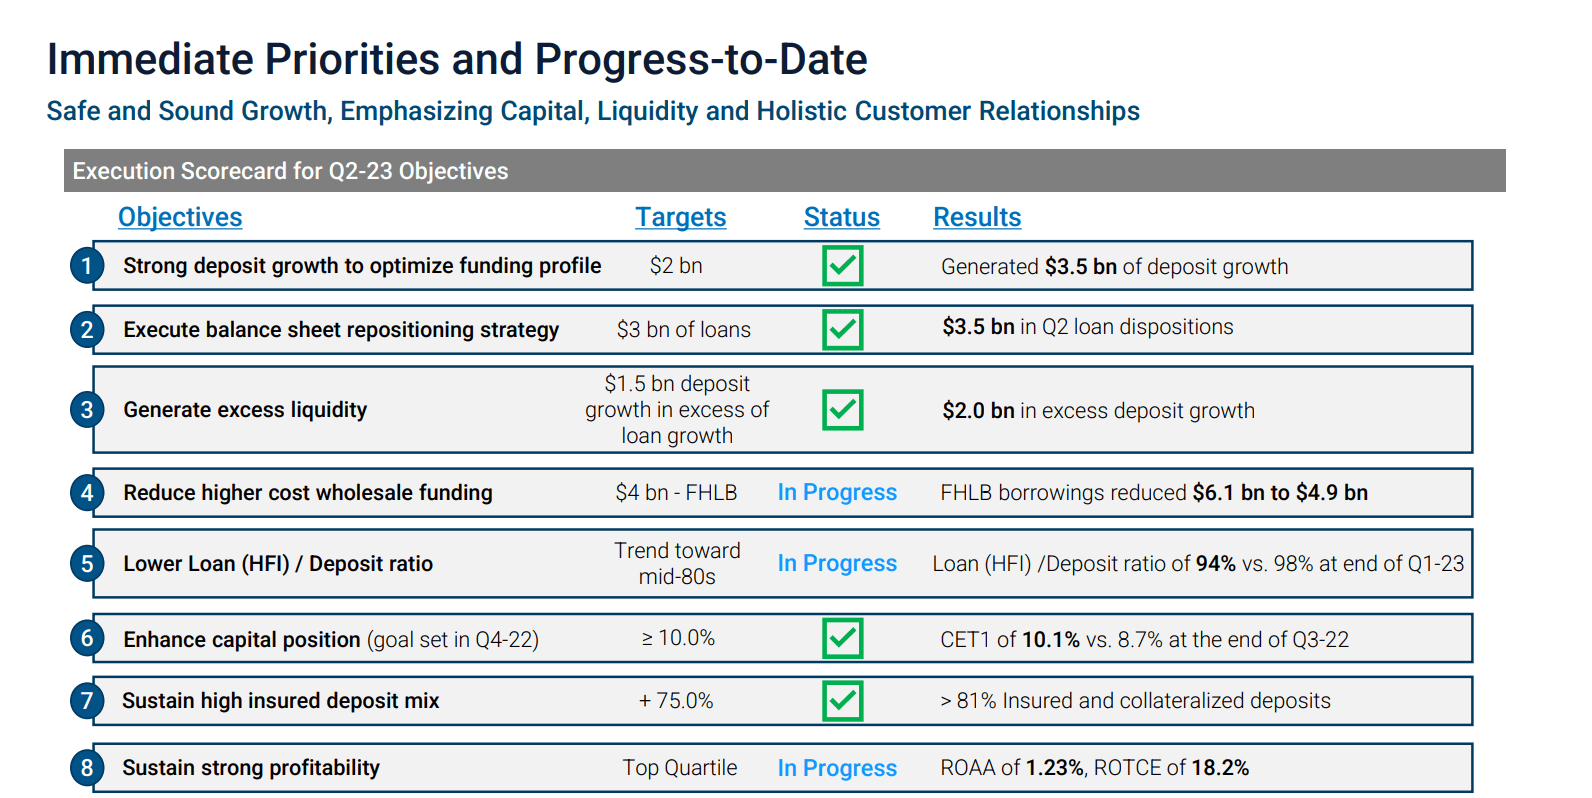
Western Alliance presentation
One of the key takeaways from WAL's Q2'23 report was the achievement of excellent deposit growth, and I think Western Alliance may be able to continue expanding its deposit base. After the second quarter, total deposits stood at $51.0 billion, a decrease of $2.6 billion from the end of FY 2023.
A positive sign is how openly the management has discussed their expectations for the remainder of this year. For the second half of this year, they predict loan growth of around $500 million per quarter. Additionally, deposits should increase by almost $2 billion each quarter throughout the same period.
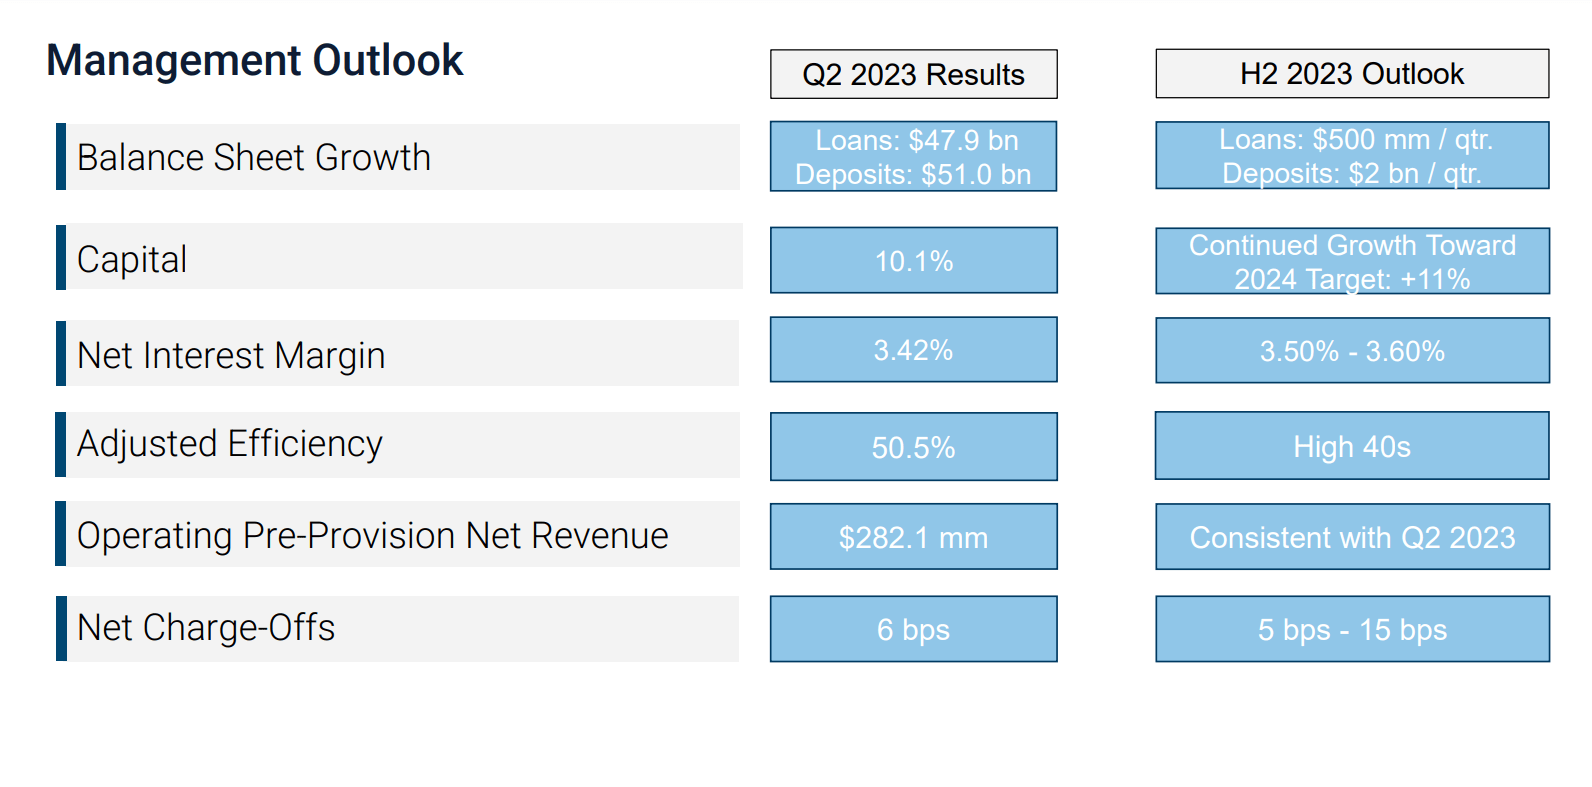
Western Alliance presentation
If the organization can accomplish both of these objectives, it will essentially force individuals who are hostile toward the company to modify their opinions. Investors may also need to be more apprehensive about the net interest margin. Management expects a net interest margin of between 3.5% and 3.6% for the remainder of this year.
Company Valuation
WAL has been paying insignificant dividends for the last few years. To value the company, I use the Excess Return Model. I do follow Professor Damodaran's framework and its database.
Assumptions and inputs:
- Risk-free rate equals the 5Y average of the USA long-term Government bond Rate, 2.2%.
- Growth rate, g, equals the 5Y average of the USA long-term Government bond Rate, 2.2%.
- USA's equity risk premium is 5.0 %.
- WAL's book value per share is $49.13 (10/09/2023).
- WAL' unlevered Beta 1.42
- WAL Debt/Equity ratio 537 %.
- USA's effective tax rate is 25 %.
- WAL ROE (TTM) 17.19 %
1. Calculate Levered Beta with the formula below:
Levered Beta = Unlevered Beta * (1+D*(1-T)/E).
2. Calculate the discount rate (discount rate as the cost of equity) using the resulting value for leveraged beta. The formula I use is:
Cost of Equity = Risk-Free Rate + (Levered Beta * Equity Risk Premium).
3. Calculate Excess Returns using WAL's ROE, Book Value, and Cost of Equity:
Excess equity return = = (Stable Return on equity - Cost of equity) x (Book Value of Equity per share).
4. Calculate Excess Returns Terminal Value assuming perpetual constant growth and stable cost of equity:
Excess Returns Terminal Value = = Excess Returns / (Cost of Equity - Expected Growth Rate).
6. Calculate the Value of Equity.
Value of Equity = Book Value per share + Terminal Value of Excess Returns.
For WAL, I get the following results:
Terminal Value of Excess Returns Per Share = $56.65
Intrinsic value per share = $106.28
Current market price = $48.91 (09/15/2023)
I compare WAL with other large US regional banks. Likely to other regional banks, WAL trades close to its book value. The image below compares WAL with similar-sized regional banks.
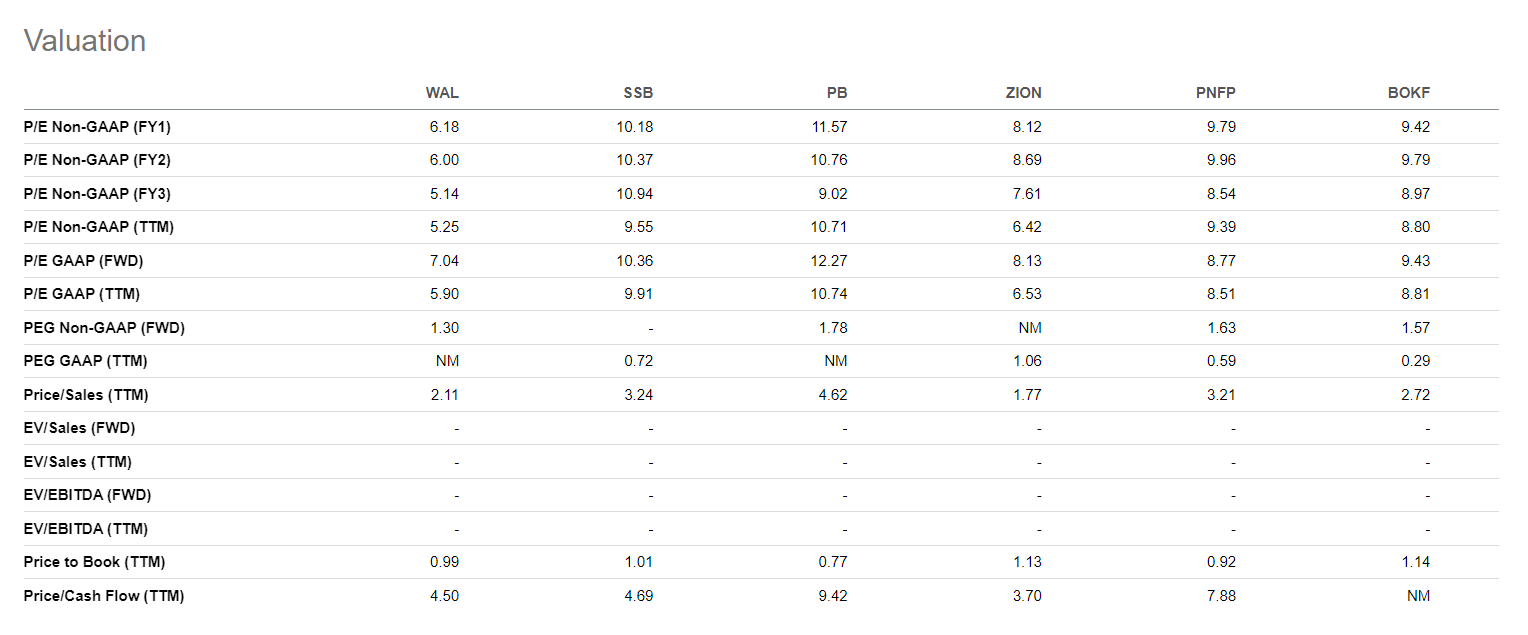
Seeking Alpha
Using P/E metrics, WAL is among the cheapest regional banks.
Risks
For all regional banks, the significant risk is liquidity. WAL is a rare exception, with the highest percentage of insured deposits. Demand deposits significantly eclipsed the cash reserves. In an emergency, the bank relies only on its insurance, which is an excellent short-term advantage. However, in the long term, WAL must increase its cash-to-deposit ratio. Hence, the bank will rely on its ability to handle future uncertainties.
On the other hand, the credit risk is well diversified between various borrowers. CRE exposure is minimized, particularly in the office segment.
The economic risk in the face of higher interest rates is crucial. The long-expected pivot might come next year. Till then, we might see another hike to achieve FED's inflation target. WAL has relatively low exposure to HTM securities and US treasury bonds. Such balance sheet composition mitigates the risk of rising interest rates.
Conclusion
Western Alliance is a good bank with growth potential. It has notable advantages over its peers; however, they are insufficient to give it a buy rating. The major drawback is the cash/deposit ratio below the US small banks' average. When I invest in banks, I like deposit ratios higher than the country's average for similar-sized enterprises. I look forward to seeing WAL's progress to give it a buy rating.
This article was written by

Analyst’s Disclosure: I/we have no stock, option or similar derivative position in any of the companies mentioned, and no plans to initiate any such positions within the next 72 hours. I wrote this article myself, and it expresses my own opinions. I am not receiving compensation for it (other than from Seeking Alpha). I have no business relationship with any company whose stock is mentioned in this article.
Seeking Alpha's Disclosure: Past performance is no guarantee of future results. No recommendation or advice is being given as to whether any investment is suitable for a particular investor. Any views or opinions expressed above may not reflect those of Seeking Alpha as a whole. Seeking Alpha is not a licensed securities dealer, broker or US investment adviser or investment bank. Our analysts are third party authors that include both professional investors and individual investors who may not be licensed or certified by any institute or regulatory body.