Stocks, Oil And The Dollar

Summary
- Markets do not move in a vacuum. In fact, all markets are all interconnected to some degree.
- We're expecting one more large swing higher in the market after the current correction is over, and this thesis is supported by oil and the U.S. dollar.
- We will revisit our broad market thesis, the levels that will confirm this thesis, and also discuss how oil and the dollar can confirm the next move higher.
- Looking for more investing ideas like this one? Get them exclusively at Tech Insider Network. Learn More »

Galina Sandalova/iStock via Getty Images
In last week’s article, we discussed the general path the SPX will likely take into the end of the year. In brief, we're expecting volatility to continue with a test of the 4275 SPX region, then a final push to new highs, which could take us into Q1 2024. The current macro environment is not threatening, signaling a near-term recession in the US now, so absent of an unforeseen event, we do not see the July top as anything more than a correction.
However, markets do not move in a vacuum. There's always a market ahead of the one you are tracking, and seemingly unrelated markets often drive the very one you are most exposed to.
Our portfolio management discipline is to track various key markets as it’s quite evident that tangential markets are inter-related. When doing so, the picture that emerges is not one that supports an uninterrupted bull market.
The two most important markets that are driving the S&P 500 is oil and the US dollar. Both are suggesting a continuation of the equity rally for another leg higher, but then also suggest a return to volatility over a longer time horizon. In this article, we will examine the levels that must hold, as well as introduce the important supporting markets to track right now so that one can maneuver any further upside in the markets as well as the coming volatility that may follow.
Growth, Inflation and Recessions
Markets do not crash randomly. They crash as a result of economic growth decelerating below expectations, which simply cannot support equity valuations at the time. With the Fed wrapping up one of the most aggressive rate hike campaigns in modern market history, investors are now left wondering if those rate hikes will filter into the economy enough to cause an unexpected decline in economic growth. We believe the lag effect on these rate hikes is giving the illusion of safety, with the effects of this campaign most likely to show up in late Q4 of 2023 – Q1 of 2024. When economic growth decelerates too much, that's usually the environment that we see deep market declines.
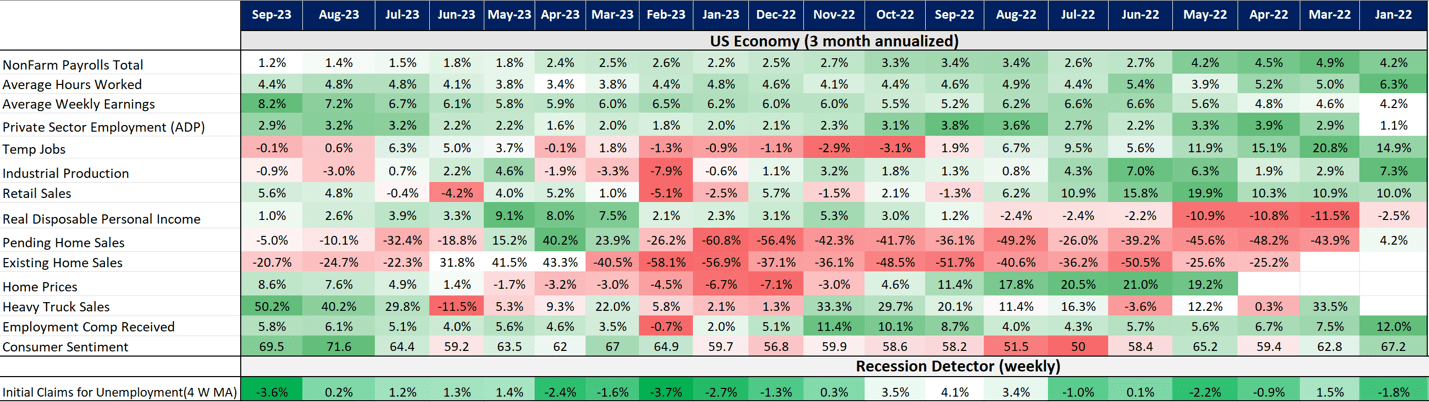
That being said, investors betting on a crash now will likely be disappointed. If we examine the trend in US growth, there's simply no evidence of an impending recession. The below graph looks at the three-month annualized trend in various metrics ranging from the consumer’s health to employment. Simply put, this is not what you see going into a recession, nor do they signal a recession is just over the horizon.
Tech Insider Network
Furthermore, we tend to see initial unemployment claims spike relatively close to market tops. As of now, this metric is signaling that the July top is likely nothing more than a correction within a larger trend higher. Employment is not weak enough, nor is the consumer weak enough to suggest that a recession is just over the immediate horizon.
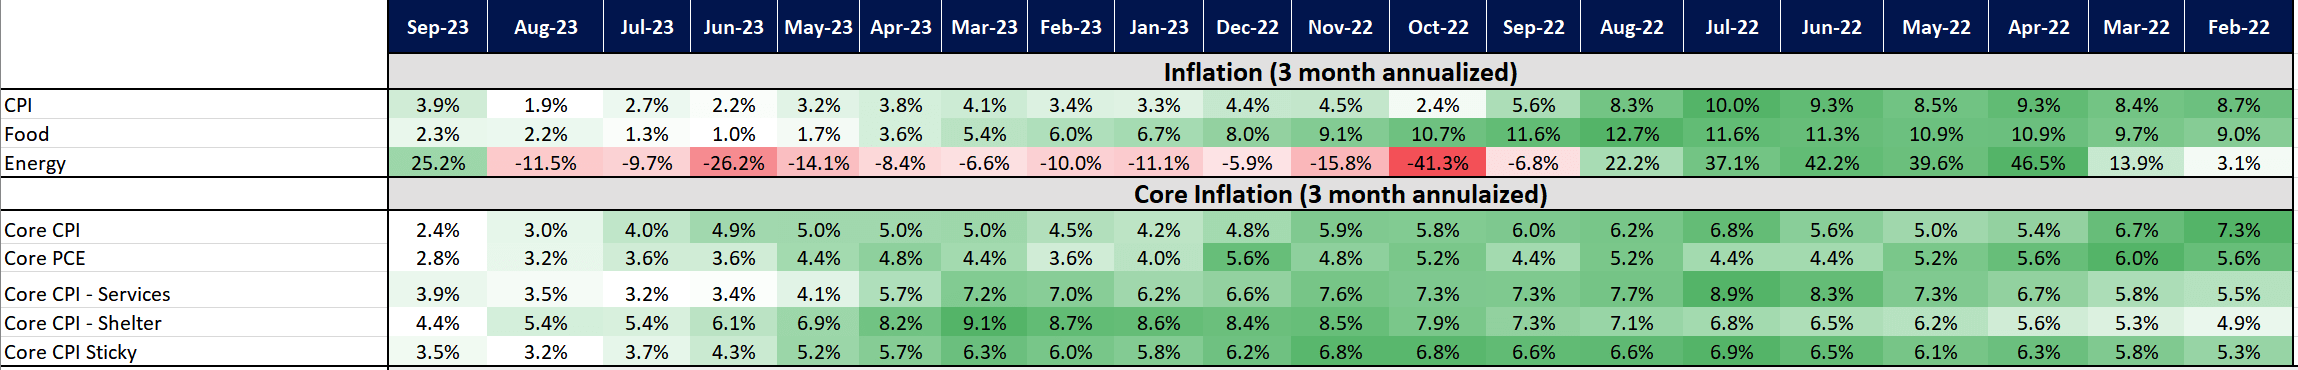
While the US economy has remained resilient for most of 2023, we also have seen a high level of disinflation, as well. While the YoY CPI numbers are still a far cry from the Fed’s 2% target, coming in recently at 3.7%, the three-month annualized trend is an encouraging step toward that goal. Keep in mind, in order to get to the YoY target, you need to see several months in a row of the 3-month annualized trend come in at, or below your target. So, this trend is encouraging.
Tech Insider Network
However, when you dig under the surface of what’s driving the current level of disinflation, a concerning picture emerges. There are only three general drivers within the CPI print – energy, food, core inflation.
The three-month annualized trend in core inflation has remained within the 4% - 5% for over a year, with our first move toward 3% - 2% in the last print two prints. While this is a move in the right direction, keep in mind that the YoY print for Core CPI is 4.3%. This is still more than double the Fed’s target.
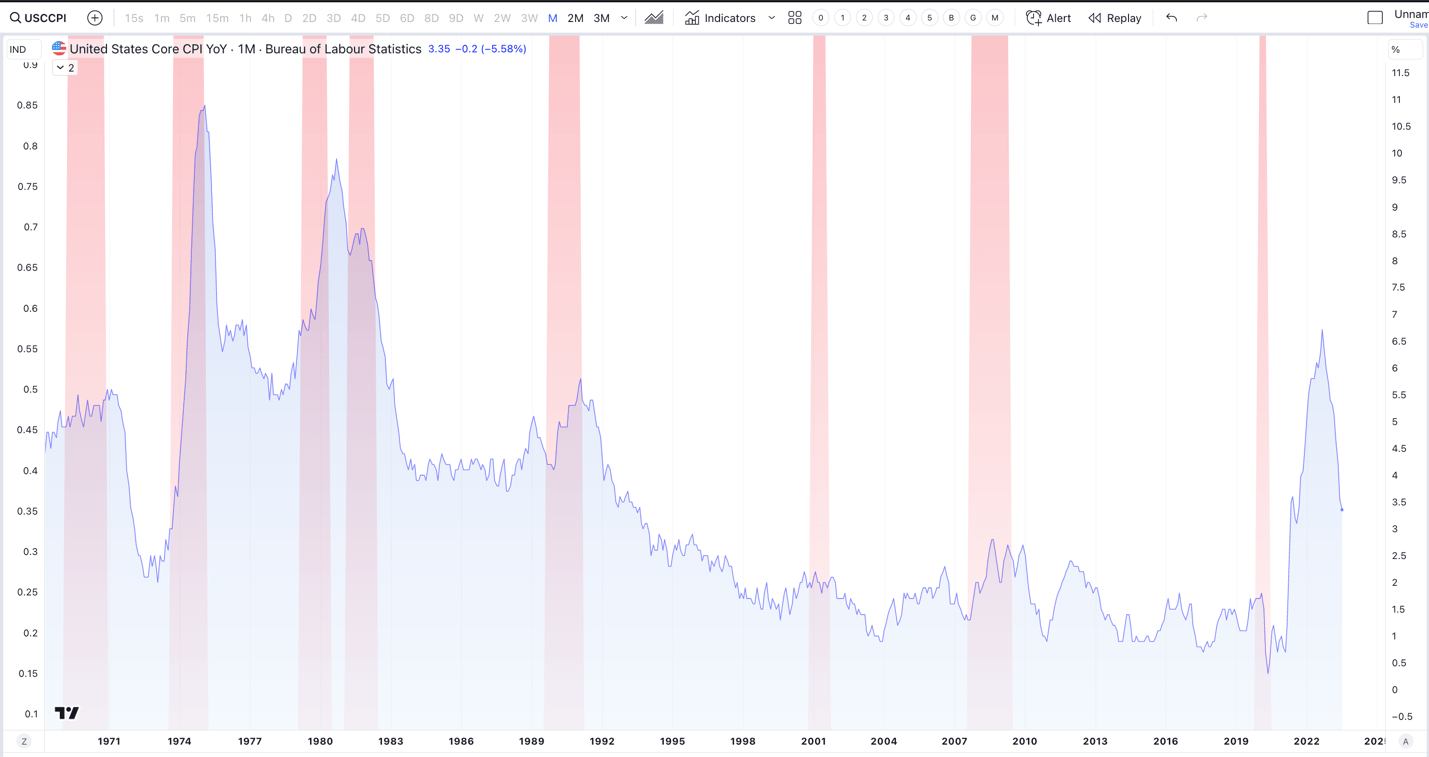
This falls in line with what market history has taught us about inflation and recessions. Once core inflation gets out of control and moves well above the Fed’s target for that business cycle, it requires a recession to get it back in line. More importantly, there's no instance in modern market history where core inflation has naturally gone back to the Fed’s target without the help of a recession. The last two shoes to drop in the business cycle are always employment, then inflation, which is exactly what we are seeing right now.
Tech Insider Network
So, while the trend in core inflation is promising, a current YoY reading of 4.3% is still too far away from the Fed’s target of 2%. This means that energy has been the primary driver of the current disinflation trend, which is obvious in the graph above. For this reason, oil prices are crucial right now in confirming what equity prices have priced in – the Fed pausing further rate hikes. If oil continues higher, inflation will certainly come back, forcing the FED to continue raising higher than equity valuations are currently priced.
Oil
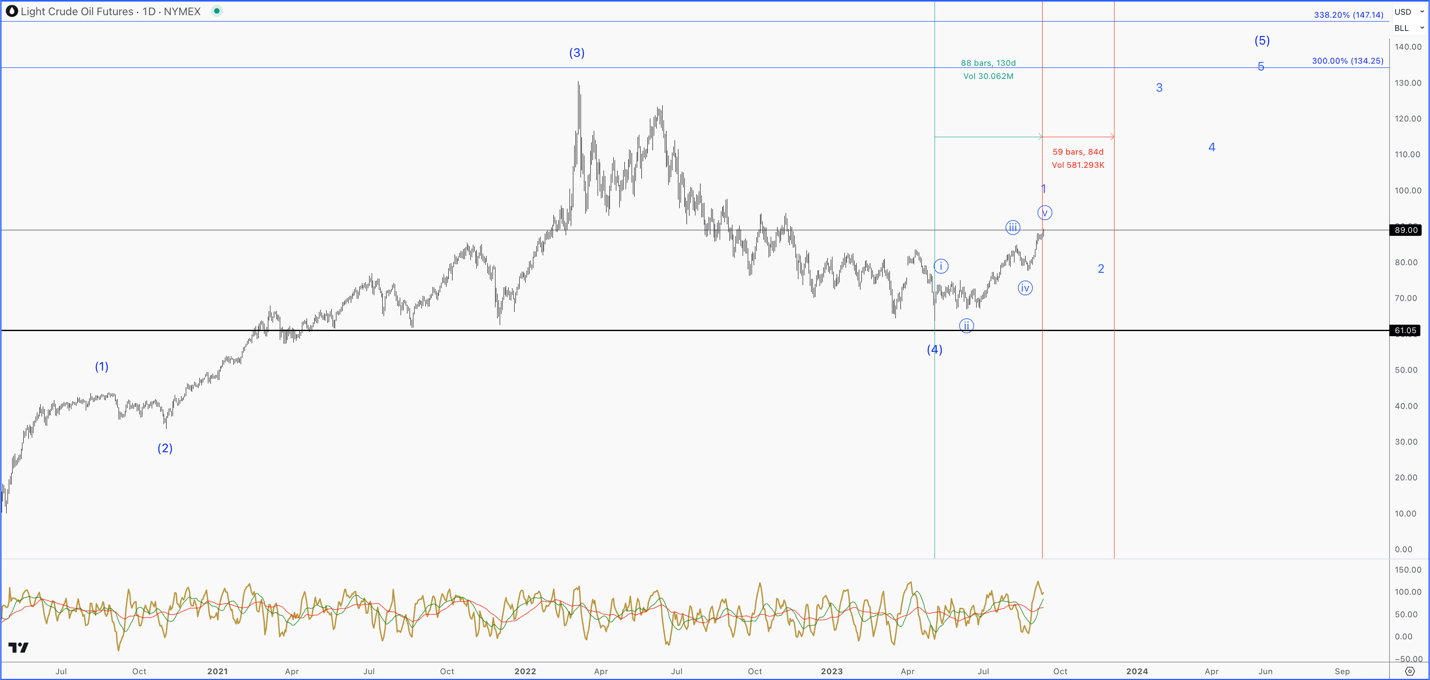
From its high just under $130/barrel in March of 2022, to its low just above $63/barrel on May of 2023, crude oil has seen a 50%-plus drawdown over 14 months. This deceleration in oil caused the disinflation that equity prices are celebrating, as core inflation remained virtually unchanged during that time
However, since the May low, crude oil is up over 30%, making its first series of higher highs and higher lows in over a year. What this means for future inflation readings is that energy will actually hurt the disinflation narrative, meaning that core inflation will have to decelerate to pick up the slack. Considering the health of the consumer, coupled with the lessons in history, we find this to be unlikely.
However, it’s important for investors to understand that equities are forward looking. As oil prices broke out to a new high in early August, equities topped one week prior, causing the drawdown we are currently in. Technically, the odds favor a larger uptrend in oil prices over the coming year; however, we just completed a 5-wave pattern off the May low. What follows this pattern is usually a 3-wave retrace of the same degree.
Tech Insider Network
In other words, the 5-wave uptrend took about four months to complete. So, I’d expect at least a 2-3-2 month retrace over the coming months. If oil gives us a proper pullback, which it seems likely, expect equities, especially tech, to continue higher. This sets us up for that final push higher into early 2024.
The US Dollar
My favorite means of tracking the US dollar (USD) is through the dollar index (DXY). This is simply an index of popular currency pairs to the USD that has a lot of price history to analyze. What is undeniable in this market is the inverse relationship between DXY and US equities.
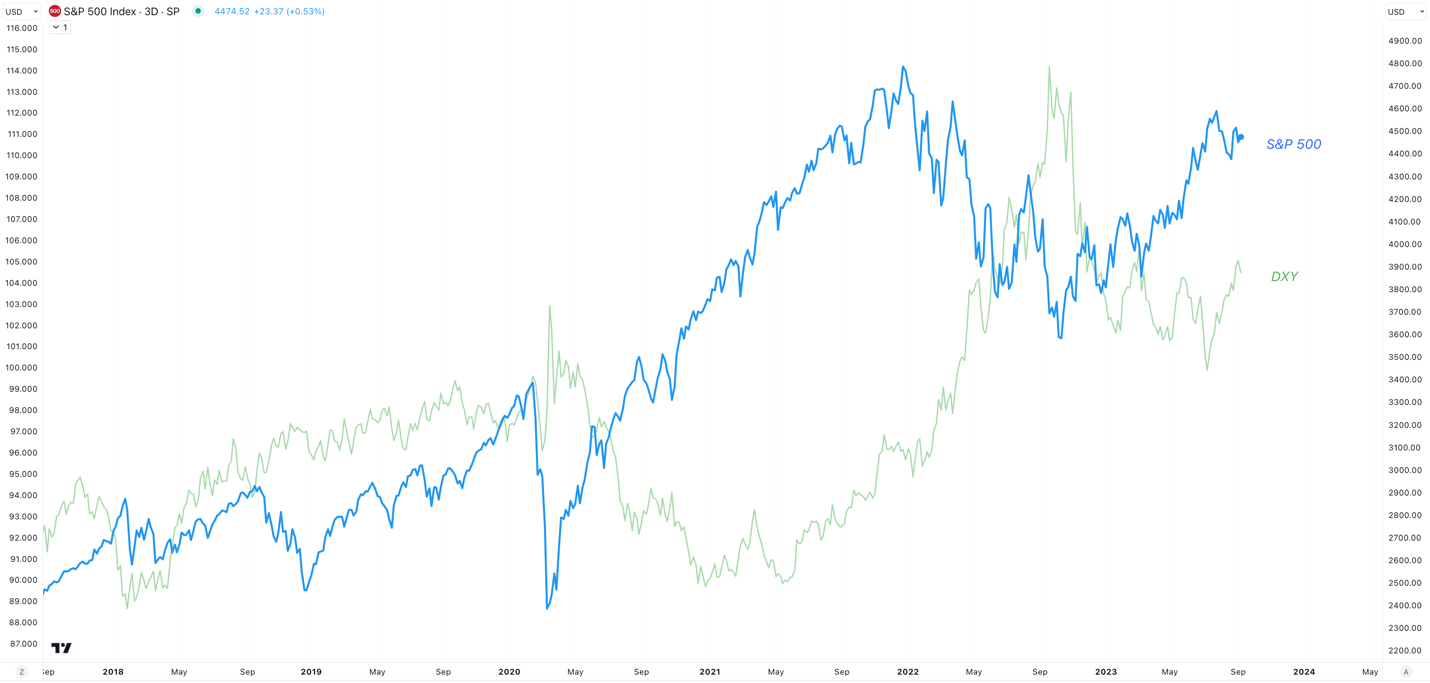
Tech Insider Network
The reason for this relationship is based on the abundance of global debt denominated in the US dollar. Some estimates claim that $12 trillion of global debt is denominated in the US Dollar, while others have claimed its even as high as $65 trillion. This would be debt in US dollars coming from non-US banks and shadow banks. These figures are in relation to a global GDP of $104 Trillion.
Regardless of the actual denomination, with so much global debt priced denominated in dollars, when the dollar goes up in value, compared to a country’s own currency, the cost to service this debt is also going up. This drains liquidity from that foreign economy, which is less money to spend on stocks. Adversely, the opposite is true, which is one of the reasons why we have seen such a sharp increase in US equities. As the dollar has dropped sharply from its high, global liquidity has also bottomed and slowly trended up.
If we analyze DXY, it appears to be in the final stages of the corrective rally within a larger correction. It hit the lower target around $105; however, the structure looks like it can extend towards $107 in the coming weeks.
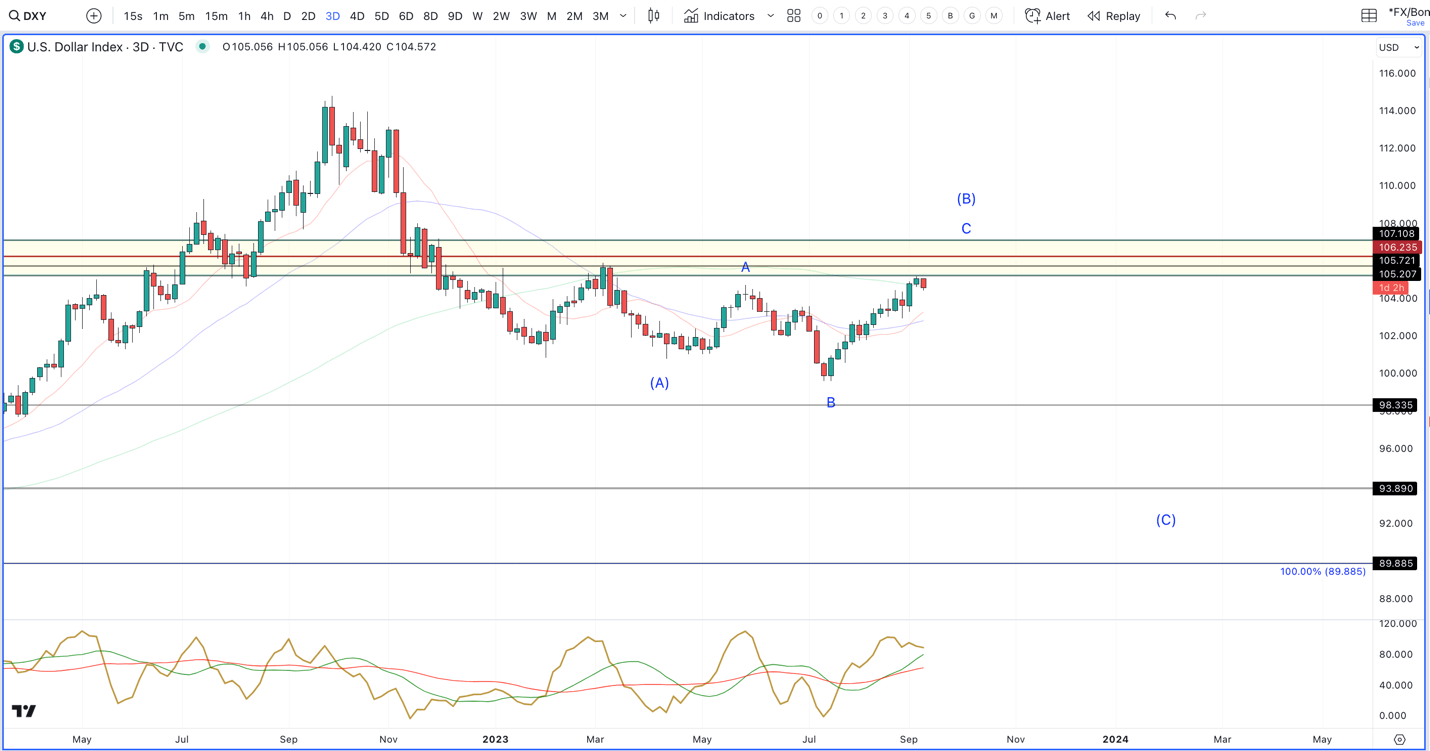
Tech Insider Network
As long as DXY goes up, expect volatility to continue in the markets. However, what is encouraging is that once this corrective rally terminates, we should see a final leg lower in DXY, which will also support another rally in equities.
Broad Market Levels
It's our belief that we are about to start the final leg higher in equities before topping. This is supported by two of the most important markets that have a significant effect on equity prices. The catalyst for a larger top will likely be a recession. Absent of an unforeseen event, our timing of this recession is November 2023 – March of 2024. The above supporting markets also line up with this thesis – Oil and DXY should see a multi-month decline, which will support equities moving higher. However, these moves will be a correction in much larger trends.
Regarding price levels, our belief is that the broad market is in a correction, which should make another move lower into late fall/early winter. Confirmation of this move will be a break below 4430 SPX, and our targets for the last leg in this correction will be around 4275 SPX. This is laid out in the green count below.
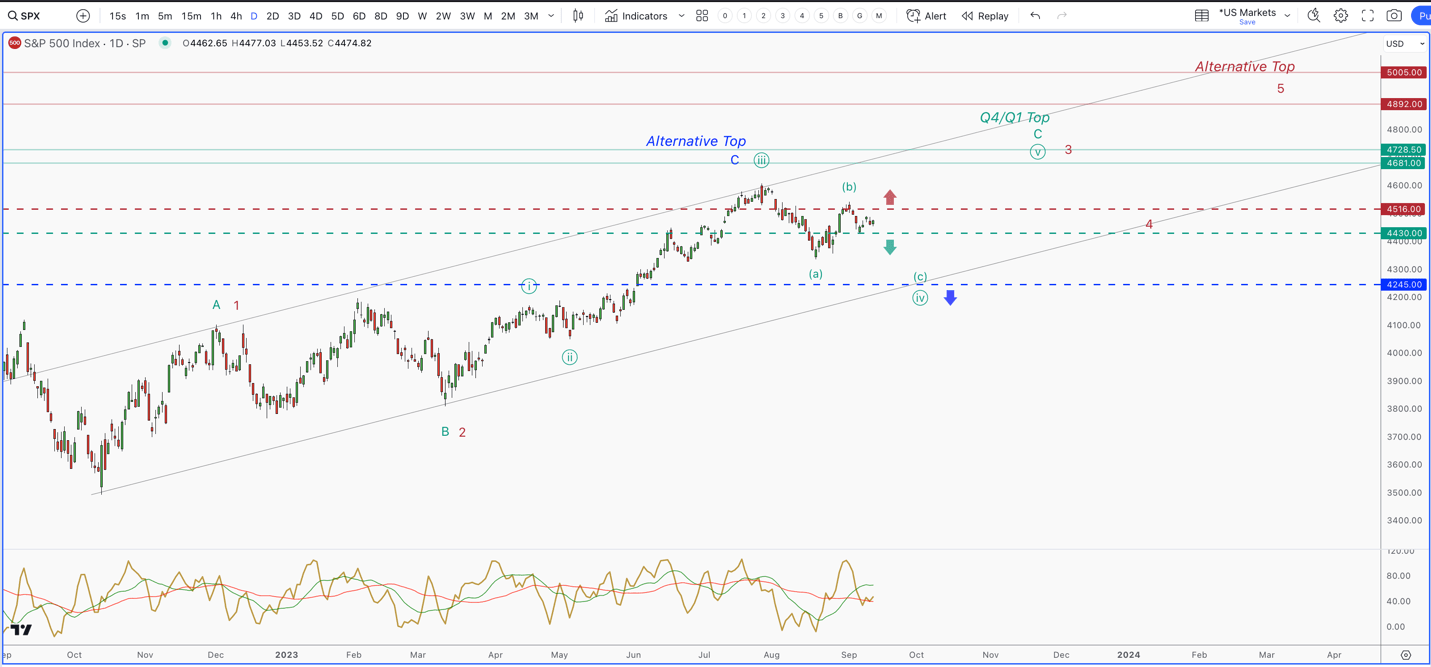
Tech Insider Network
However, I cannot ignore that the bears have, so far, been unable to take advantage of the setup pointing us lower. For this reason, I’ve added the red count to the chart, which suggests a direct push towards 4700 – 4800 SPX. If we see the market breakout above 4516 SPX, this will become my primary expectation.
The final alternative count is in blue. This will not be considered until we see a break below 4245 SPX. If this does happen, it will make the probabilities of a major top being in, and we will risk manage accordingly. As I do not see any evidence of a recession brewing now, this blue count would likely be the market picking up on some type of event.
In conclusion, there are three broad market levels investors need to focus on in order to best risk manage their portfolios into the end of the year. We do believe that we are marching toward a recession, but that recession is not in the data now, which favors higher levels. But, based on the trends in oil and the US dollar, which are key markets driving equity returns, any additional upside should be met with caution until the macro environment changes.
Due to these dynamics, we believe the odds of a final swing higher are quite high. If we get confirmation of this move, we will target 4700 – 4800. Our plan is to trim substantially when we get to this region, and play defense until the market and economy proves otherwise. If we see a continuation of the current correction we are in, we consider it to be a buying opportunity as long as we stay above 4245 SPX. Below this level, and a major top is likely in.
Check out my premium service "Tech Insider Network"
We offer tech sector coverage that combines fundamentals and technicals. After recommending a stock, we provide entries and exits.
Our audited 3-year results of 47% prove we are a top-performing tech portfolio. This compares to popular tech ETFs at negative 46% and the Nasdaq at 19%.
We are the only retail team featured regularly in Tier 1 media, such as Fox, CNBC, TD Ameritrade and more.
Our services includes an automated hedge, portfolio of 10+ positions, broad market analysis, real-time trade alerts PLUS a weekly webinar every Thursday at 4:30 pm Eastern.
This article was written by

Knox Ridley began consulting on portfolios in 2007 and is an experienced growth investor in both bull and bear markets. As the portfolio manager of the I/O Fund and Tech Insider Network, he beat the top-performing funds on Wall Street in both 2020 and in 2021. His real-time trade notifications to premium subscribers have garnered 28 entries with over 100% gains in the last three years.
Knox began his career as an ETF wholesaler in 2007 before becoming a portfolio consultant for large RIAs, FAs, and Institutional accounts. He is very keen on macro trends and is trained in Fibonacci Trading, Elliott Wave theory, as well as Gann Cycles. He also uses classical technical analysis to manage risk and identify great risk/reward setups. Knox is known for increasing and decreasing allocations for record-breaking returns.
The I/O Fund officially launched on May 8th, 2020 and his portfolio performance illustrates his ability to compete with the best Funds on Wall Street. Our audited results prove we are one of the best-performing tech portfolios since our inception. Our cumulative returns since inception are 46.92% – which is more than double the Nasdaq-100’s return of 18.65%. Notably, this was achieved during a risk-of environment when indexes typically outperform individual portfolios. Losses are geometric in nature, which means we are 174% ahead of other all-tech portfolios since inception. If you had invested $10,000 with the Tech Insider Network's picks versus other all-tech portfolios at inception, the difference would be a portfolio value of $14,692 with TIN versus $5,358 with institutional tech-focused portfolios. The difference in value is 174%. Every entry and exit he does is logged and recorded in real-time.
Analyst’s Disclosure: I/we have no stock, option or similar derivative position in any of the companies mentioned, and no plans to initiate any such positions within the next 72 hours. I wrote this article myself, and it expresses my own opinions. I am not receiving compensation for it. I have no business relationship with any company whose stock is mentioned in this article.
Seeking Alpha's Disclosure: Past performance is no guarantee of future results. No recommendation or advice is being given as to whether any investment is suitable for a particular investor. Any views or opinions expressed above may not reflect those of Seeking Alpha as a whole. Seeking Alpha is not a licensed securities dealer, broker or US investment adviser or investment bank. Our analysts are third party authors that include both professional investors and individual investors who may not be licensed or certified by any institute or regulatory body.
Recommended For You
Comments (1)
63,5…. It is in huge in wave 3 up to 180-200$ at least🚀 The stocks are also in bull market and seem to be at least for 2 more years - although the correction in Q1-Q2 is quite possible both in stocks and oil