QQQJ: Not All Nasdaq Funds Are Created Equal

Summary
- The Invesco NASDAQ Next Gen 100 ETF is a mid-cap growth ETF that has lagged behind the QQQ Trust in 2023.
- The Nasdaq Next Generation 100 Index is a modified market capitalization-weighted index, where each security is capped at 4%.
- The fund is up only 5.7% this year, telling the same story of other mid-cap funds, which have severely lagged large cap names in 2023.
- Technology and Healthcare are the largest sectoral exposures in this fund.
- Valuation metrics for the underlying names in the ETF are stretched, with very high P/E and P/B ratios.
travelpixpro
Thesis
The Invesco NASDAQ Next Gen 100 ETF (NASDAQ:QQQJ) is an equity exchange traded fund. As its nomenclature suggests, the fund is a technology-oriented fund that invests in companies in the Nasdaq:
The Fund will invest at least 90% of its total assets in the securities that comprise the NASDAQ Next Generation 100 Index by investing in the 101st to the 200th largest companies on the NASDAQ. As a result, the portfolio may be concentrated in mid-capitalization stocks. The Index is comprised of securities of the next generation of Nasdaq-listed non-financial companies; that is, the largest 100 Nasdaq-listed companies outside of the NASDAQ-100 Index®. The Fund and Index are rebalanced quarterly and reconstituted annually.
As a reminder, the Nasdaq is a stock exchange that contains most of the largest technology companies. The acronym actually originates from the 'National Association of Securities Dealers Automated Quotations Stock Market', founded in 1971. When an enterprise in the U.S. wants to go public via an IPO, it can choose which exchange it lists its shares on. Historically, technology companies have chosen the Nasdaq due to several benefits. One of them is the lower listing cost, but the 'meat on the bone' so to speak resides with structural requirements.
For example, any company listed on the NYSE must have an internal audit function and corporate governance guidance and materials. These are not required for companies listed on the NASDAQ. Fast growing companies that have focused more on product, revenue and expansion do not always tick all the boxes required for NYSE listings, and prefer to forego the creation of all the relevant internal departments needed to list via the NYSE.
However, not all technology companies are created equal. While 2023 has seen an astounding rally in the largest mega-tech companies, the mid-cap growth names have lagged:
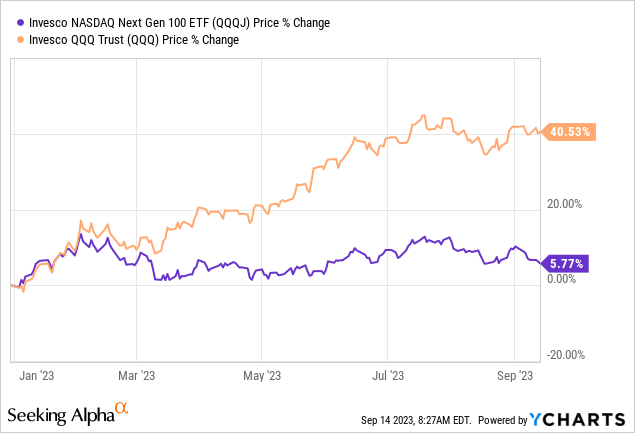
The largest 100 Nasdaq names as composed via the Nasdaq-100 Index are up over 40%, while the next 100 names on the exchange are up just a paltry 5.77%. The difference in performance is shocking, and it truly boils down to what the 'magnificent seven' have achieved in terms of market valuation:
Magnificent Seven (GS)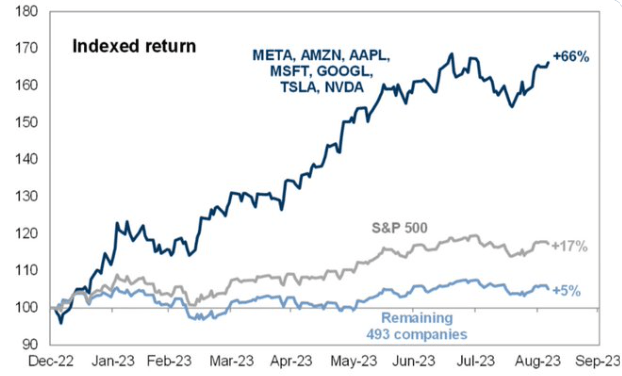
The above snapshot gives a reader a comparison point in respect to the SPY, but the story with the Nasdaq is very similar. The largest seven names have cannibalized all the positive performance this year, while the rest of the Nasdaq names, similarly to the remaining 493 names in the S&P 500, have produced very little in terms of performance.
As a retail investor, one needs to understand that growth names as translated into Nasdaq stocks are not all created equal. While the largest names have done very well, the mid-cap growth equities represented by QQQJ have failed to deliver eye-watering results.
In this article we are going to have a close look at QQQJ's composition, its index methodology, the underlying valuation metrics and performance allocation.
What is the NASDAQ Next Generation 100 Index
The Nasdaq Next Generation 100 Index is created to measure the performance of the largest 100 companies outside of the Nasdaq-100 Index. The Invesco QQQ ETF (QQQ) is the one tracking the Nasdaq 100 Index, so QQQJ is the ETF tracking the next 100 names on the exchange. The methodology is fairly simple:
At each Index Reconstitution, all issuers that meet the applicable Security Eligibility Criteria are ranked by market capitalization, with the issuer having the highest market capitalization getting a rank of 1, the issuer having the second highest market capitalization getting a rank of 2, and so on. The largest 100 ranked issuers by market capitalization that are not in the Nasdaq-100 Index® are included in the Index.
In effect, the methodology takes the largest 200 companies listed on the Nasdaq and while the first 100 are allocated to QQQ, the next 100 in terms of size are put into QQQJ.
From a weighting standpoint, this is where the Nasdaq Next Generation 100 Index does a poor job. The index is a modified market capitalization-weighted one, where each security is capped at 4%, and the weighting follows the standard calculation:
Constituent weighting process Index Securities’ initial weights are determined by dividing each Index Security’s market capitalization by the aggregate market capitalization of all Index Securities.
The fund ends up with the following top names as of its latest fact sheet, as per the stated methodology:
Top Holdings (Fund Fact Sheet)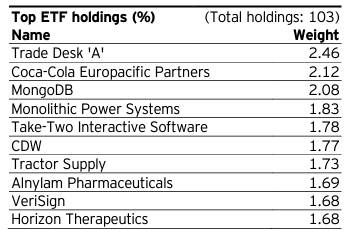
Holdings
As expected, the fund is overweight technology names, followed by healthcare:
Sector Allocation (Fund Fact Sheet)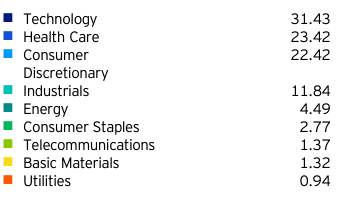
The generic Healthcare sector contains the Biotechnology sub-sector where the likes of Alnylam Pharmaceuticals (ALNY) can be found. We can see this name in the top holdings for the fund. Just to give readers a flavor for this name, let us look at the equity snapshot from Seeking Alpha:
ALNY Snapshot (Seeking Alpha)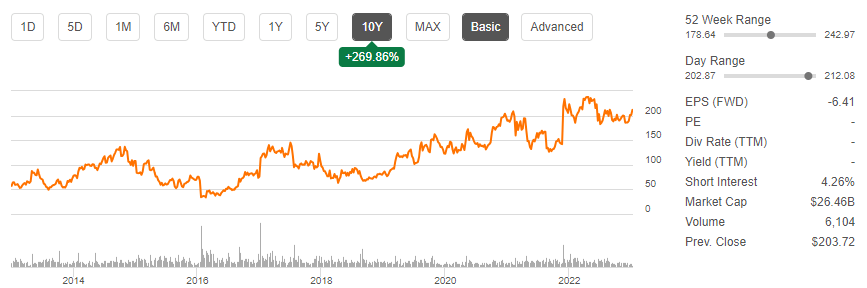
The company has a $26 billion market cap but a negative EPS profile and no yield. It has done very well in the past ten years from a share price perspective.
From a valuation standpoint, the sector looks stretched:
Valuation Metrics (Fund Fact Sheet)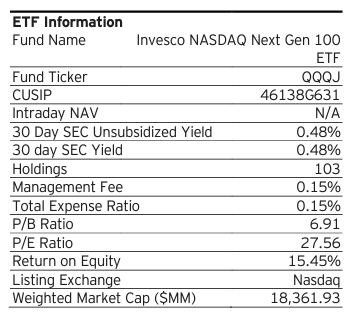
The fund's average P/E ratio is at 27x, while its average price to book ratio is a gargantuan 6.9x. As seen in the individual example above, many of the underlying names in this fund are your classic growth companies that aim to increase revenues with innovative areas in their industries without presently generating significant earnings. An investor needs to understand that the names in this portfolio can represent very enticing growth propositions, but are harder to value using classic value metrics such as free cash flow, EPS or P/B ratios.
Performance
The fund falls in the Midcap Growth bucket per the Morningstar categorization:
Morningstar Allocation (Morningstar)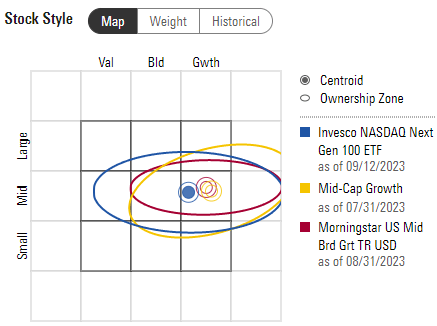
As opposed to QQQ, which falls in the Large Growth box, QQQJ passes investors the returns associated with midcap growth names.
Similarly to the larger equity space, midcaps have lagged significantly when compared to large cap names:
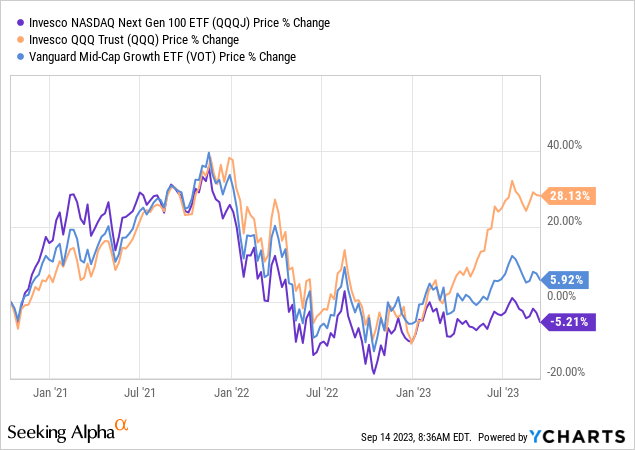
On a 3-year lookback period, QQQ outperforms, while midcap growth names lag. Furthermore, QQQJ underperforms another ETF in the midcap growth space, namely the Vanguard Mid-Cap Growth ETF (VOT).
Conclusion
QQQJ is an equity exchange traded fund. The vehicle falls in the Midcap Growth category when utilizing the Morningstar categorization box, and represents a modified market capitalization-weighted take on the second 100 largest companies listed on the Nasdaq. While QQQ gives investors exposure to the largest 100 names, QQQJ passes the return profile of the next batch. The fund represents a 'modified' market capitalization weight methodology because it caps the exposure to any name at 4%.
Not all Nasdaq companies are created equal, with QQQJ severely underperforming QQQ this year, being up only 5.77% versus up over 40% for the QQQ Trust. Midcap names have not done well in 2023, both on the Nasdaq exchange as well as in the wider market. With stretched valuations, QQQJ's components are not a compelling proposal at this stage, especially with risk free rates above 5%. While large, profitable mega-techs have been insulated from higher rates by their bullet-proof balance sheets, midcaps are absorbing higher costs of capital as we speak, providing for muted returns until the Fed starts cutting rates aggressively. We are on Hold with respect to this name presently.
This article was written by

Analyst’s Disclosure: I/we have no stock, option or similar derivative position in any of the companies mentioned, and no plans to initiate any such positions within the next 72 hours. I wrote this article myself, and it expresses my own opinions. I am not receiving compensation for it (other than from Seeking Alpha). I have no business relationship with any company whose stock is mentioned in this article.
Seeking Alpha's Disclosure: Past performance is no guarantee of future results. No recommendation or advice is being given as to whether any investment is suitable for a particular investor. Any views or opinions expressed above may not reflect those of Seeking Alpha as a whole. Seeking Alpha is not a licensed securities dealer, broker or US investment adviser or investment bank. Our analysts are third party authors that include both professional investors and individual investors who may not be licensed or certified by any institute or regulatory body.