Fenbo Holdings Seeks $5 Million In U.S. Micro-IPO

Summary
- Fenbo Holdings Limited has filed for a $5 million IPO to raise capital for its personal care electric appliances business.
- The company's financial performance has been declining, with decreasing revenue, gross profit, and cash flow from operations.
- The IPO carries risks such as reliance on a single customer and exposure to regulatory and financial changes in China.
- My outlook for the Fenbo Holdings Limited IPO is to Sell [Avoid].
- Looking for more investing ideas like this one? Get them exclusively at IPO Edge. Learn More »
torwai/iStock via Getty Images
A Quick Take On Fenbo Holdings Limited
Fenbo Holdings Limited (FEBO) has filed to raise $5 million in an IPO of its ordinary shares, according to an SEC F-1 registration statement.
The firm develops and sells personal care electric appliances.
Given the firm’s contracting topline revenue, reduced gross profit, lowered cash flow from operations, and other attendant risks, my opinion on the IPO is to Sell [Avoid].
Fenbo Overview
Hong Kong-based Fenbo Holdings Limited was founded to manufacture hair dryers under the Remington brand for sale in numerous countries and regions worldwide.
Management is headed by Chairman and CEO Mr. Li Siu Lun Allan (Allan Li), who has been with the firm since June 2021 and is the son of Mr. Li Kin Shing, the founder of the company.
The company’s primary offerings include the following:
Curling wands and irons
Flat irons and hair straighteners
Others - trimmers, nail polishers, pet shampoo brushes, eyebrow pliers.
As of December 31, 2022, Fenbo has booked fair market value investment of approximately $1.3 million in equity and debt from investors, including Yuk Tong Lam and Majestic Dragon Investment Co.
Fenbo Customer Acquisition
The company acts as an original equipment manufacturer and has, in the past, acted as an original design manufacturer for the personal care electric device market.
The firm's factory, located in Shenzhen City, is capable of producing three million units per year, and its sole customer is Spectrum Brands.
Selling and Marketing expenses as a percentage of total revenue have dropped as revenues have declined, as the figures below indicate:
Selling & Marketing | Expenses vs. Revenue |
Period | Percentage |
Year Ended Dec. 31, 2022 | 1.7% |
Year Ended Dec. 31, 2021 | 2.1% |
(Source - SEC.)
The Selling and Marketing efficiency multiple, defined as how many dollars of additional new revenue are generated by each dollar of Selling and Marketing expense, was negative (11.1x) in the most recent reporting period, indicating sharply worsening results. (Source - SEC)
Fenbo’s Market & Competition
According to a 2022 market research report by Allied Market Research, the global market for personal care electrical appliances was an estimated $19.6 billion in 2020 and is forecasted to reach $42.5 billion by 2031.
This represents a forecast CAGR (Compound Annual Growth Rate) of 6.8% from 2022 to 2031.
The primary drivers for this expected growth are an increase in disposable income across developed and emerging markets and a desire by consumers for time-saving and appearance-improving products.
Also, the chart below shows the relative market size and expected growth for various product types:
Personal Care Electric Devices Market (Allied Market Research)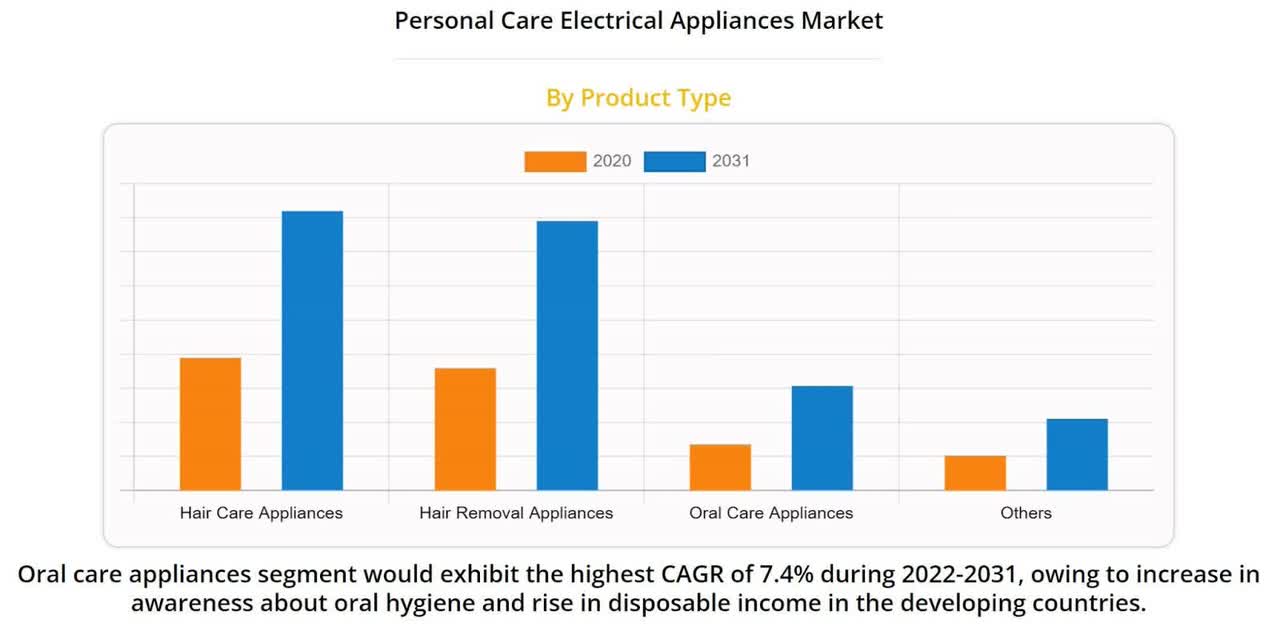
Major competitive or other industry participants include the following firms:
Procter and Gamble
Conair Corp
Royal Philips Electronics NV
Panasonic Corporation
Groupe SEB
Colgate-Palmolive
Helen of Troy L.P
HoMedics Inc.
LION Corp.
Fenbo Holdings Limited Financial Performance
The company’s recent financial results can be summarized as follows:
Declining top line revenue
Dropping gross profit and gross margin
A swing to operating loss
Reduced cash flow from operations.
Below are relevant financial results derived from the firm’s registration statement:
Total Revenue | ||
Period | Total Revenue | % Variance vs. Prior |
Year Ended Dec. 31, 2022 | $ 15,347,000 | -16.1% |
Year Ended Dec. 31, 2021 | $ 18,289,050 | |
Gross Profit (Loss) | ||
Period | Gross Profit (Loss) | % Variance vs. Prior |
Year Ended Dec. 31, 2022 | $ 2,415,000 | -20.0% |
Year Ended Dec. 31, 2021 | $ 3,017,430 | |
Gross Margin | ||
Period | Gross Margin | % Variance vs. Prior |
Year Ended Dec. 31, 2022 | 15.74% | -4.6% |
Year Ended Dec. 31, 2021 | 16.50% | |
Operating Profit (Loss) | ||
Period | Operating Profit (Loss) | Operating Margin |
Year Ended Dec. 31, 2022 | $ (315,000) | -2.1% |
Year Ended Dec. 31, 2021 | $ 431,210 | 2.4% |
Comprehensive Income (Loss) | ||
Period | Comprehensive Income (Loss) | Net Margin |
Year Ended Dec. 31, 2022 | $ 780,000 | 5.1% |
Year Ended Dec. 31, 2021 | $ 237,250 | 1.3% |
Cash Flow From Operations | ||
Period | Cash Flow From Operations | |
Year Ended Dec. 31, 2022 | $ 730,000 | |
Year Ended Dec. 31, 2021 | $ 768,950 | |
(Source - SEC.)
As of December 31, 2022, Fenbo had $1.8 million in cash and $5.6 million in total liabilities.
Free cash flow during the twelve months ending December 31, 2022, was $659,000.
Fenbo Holdings Limited IPO Details
Fenbo intends to raise $5 million in gross proceeds from an IPO of its ordinary shares, offering one million shares at a proposed midpoint price of $5.00.
The company is also registering for sale two million shares for sale by selling stockholders. If these shares were to come onto the market in a concentrated time frame, it would likely adversely affect the price of the company's stock.
No existing shareholders have indicated an interest in purchasing shares of the IPO at the same IPO price.
Assuming a successful IPO, the company’s enterprise value at IPO would approximate $51 million, excluding the effects of underwriter over-allotment options.
The float to outstanding shares ratio (excluding underwriter over-allotments) will be approximately 9.09% so that the stock will be a "low-float" stock subject to potentially higher volatility.
The firm is also a "foreign private issuer" and an "emerging growth company," indicating that it may take advantage of rules for less disclosure of company information.
Such companies have generally performed poorly in U.S. public markets post-IPO.
Management says it will use the net proceeds from the IPO as follows:
[i] to expand our production capacity and capability; [ii] to strengthen our engineering, research, and development capability; [iii] to penetrate and further expand into new and existing geographical markets; and [iv] for general working capital. We will not receive any of the proceeds from the sale of the Ordinary Shares by the Selling Shareholder.
(Source - SEC.)
Regarding outstanding legal proceedings, management said the company or its subsidiaries is not a party to any legal proceedings that would have a material adverse effect on its financial condition or operations.
The sole listed bookrunner of the IPO is EF Hutton.
Valuation Metrics For Fenbo
Below is a table of relevant capitalization and valuation figures for the company:
Measure [TTM] | Amount |
Market Capitalization at IPO | $55,000,000 |
Enterprise Value | $50,884,000 |
Price / Sales | 3.58 |
EV / Revenue | 3.32 |
EV / EBITDA | -161.54 |
Earnings Per Share | $0.07 |
Operating Margin | -2.05% |
Net Margin | 5.08% |
Float To Outstanding Shares Ratio | 9.09% |
Proposed IPO Midpoint Price per Share | $5.00 |
Net Free Cash Flow | $659,000 |
Free Cash Flow Yield Per Share | 1.20% |
Debt / EBITDA Multiple | -4.48 |
CapEx Ratio | 10.28 |
Revenue Growth Rate | -16.09% |
(Source - SEC.)
Commentary About Fenbo’s IPO
FEBO is seeking U.S. public capital market investment to fund its general corporate working capital needs.
The company’s financials have shown reduced topline revenue, lower gross profit and gross margin, a swing to operating loss and a drop in cash flow from operations.
Free cash flow for the twelve months ending December 31, 2022, was $659,000.
Selling and Marketing expenses as a percentage of total revenue have dropped as revenue has decreased; its Selling and Marketing efficiency multiple was negative (11.1x).
The company has previously declared dividends but expects that in the future, all of its earnings, if any, will be used to further its growth initiatives and provide working capital.
Fenbo’s recent capital spending history indicates it has spent minimally on capital expenditures as a percentage of its operating cash flow.
EF Hutton is the only underwriter, and its trailing twelve-month IPO performance has been substantially negative.
The market opportunity for manufacturing personal care electric appliances is large and is expected to grow at a moderate rate of 6.8% CAGR through 2031.
Business risks to the company’s outlook as a public company include its reliance on only one customer for all of its revenues.
Other risks to investors include its wholly foreign-owned subsidiary structure, which means investors would only have an equity interest in a Cayman Islands firm and not in any underlying assets.
Additionally, the firm has its primary operations in China and is subject to unpredictable regulatory and financial conditions changes by the government.
Given the firm’s contracting topline revenue, reduced gross profit, lowered cash flow from operations, and other attendant risks, my outlook on the IPO is to Sell [Avoid].
Expected IPO Pricing Date: To be announced.

Gain Insight and actionable information on U.S. IPOs with IPO Edge research.
Members of IPO Edge get the latest IPO research, news, and industry analysis.
Get started with a free trial!
This article was written by

I'm the founder of IPO Edge on Seeking Alpha, a research service for investors interested in IPOs on US markets. Subscribers receive access to my proprietary research, valuation, data, commentary, opinions, and chat on U.S. IPOs. Join now to get an insider's 'edge' on new issues coming to market, both before and after the IPO. Start with a 14-day Free Trial.
Analyst’s Disclosure: I/we have no stock, option or similar derivative position in any of the companies mentioned, and no plans to initiate any such positions within the next 72 hours. I wrote this article myself, and it expresses my own opinions. I am not receiving compensation for it (other than from Seeking Alpha). I have no business relationship with any company whose stock is mentioned in this article.
Seeking Alpha's Disclosure: Past performance is no guarantee of future results. No recommendation or advice is being given as to whether any investment is suitable for a particular investor. Any views or opinions expressed above may not reflect those of Seeking Alpha as a whole. Seeking Alpha is not a licensed securities dealer, broker or US investment adviser or investment bank. Our analysts are third party authors that include both professional investors and individual investors who may not be licensed or certified by any institute or regulatory body.