SMDV: Dividend Growers Might Have Become Tactically Attractive, Do Not Forget To Monitor Quality

Summary
- SMDV represents a group of small- and mid-cap dividend growers, predominantly from the financial, industrial, and utilities sectors.
- The ETF has meaningfully disappointed since the previous note, delivering a negative total return despite the U.S. market rally.
- Owing to a few improvements in factor exposure that are not obvious upon a cursory review, like a higher EY, SMDV might still be considered tactically attractive.
- On the negative side, quality concerns remain, so there will be no upgrade today.
fotolgahan/iStock via Getty Images
Thanks to the sprawling ETF universe, dividend growth investing enthusiasts can easily achieve the factor balance they consider most opportune. For instance, if they are on the lookout for smaller companies with established DPS growth stories, the ProShares Russell 2000 Dividend Growers ETF (BATS:SMDV) is worth taking a closer look at. Its idea is to represent small- and mid-cap U.S. equities with no less than a 10-year DPS growth track record, which is enough (there are nuances) to qualify for the Russell 2000 Dividend Growth Index, which has been the crux of the ETF's strategy since its inception in February 2015.
The SMDV fact sheet says that the index "invests in the Russell 2000 companies that have increased dividends each year for at least 10 consecutive years," with the minimum number of constituents being "40 stocks, which are equally weighted." Sector weights are capped at 30%. It is rebalanced quarterly, with "an annual reconstitution during the June rebalance."
I have covered SMDV twice in the past, with the most recent note published in March 2023. Back then, I emphasized that the fund delivered a rare paradox of too expensive valuation (on a relative basis) and too weak quality, a factor combination that is hardly worth buying into regardless of the market's direction.
Today, an update is necessary for two main reasons. First, SMDV has grossly disappointed investors, delivering a 4.7% price decline since the beginning of the year and a negative 6.58% total return since the article was published on March 8, which looks especially discouraging if juxtaposed to the tech-driven rally of the S&P 500 index.
Seeking Alpha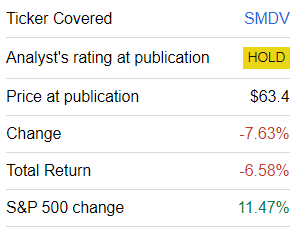
Second, the portfolio has seen a few adjustments as the index was reconstituted in June; the next rebalance is due this September. In theory, its lackluster performance coupled with the recalibration of the portfolio might finally improve the factor story, with a much-needed increase in overall quality and some progress on the valuation front. Perhaps we will see positive developments regarding growth as well. So, let us dig in.
Newcomers Boost Value Characteristics Contribute to Profitability
Comparing tickers from the March and September datasets, I found out that the portfolio has become slightly heavier, with 102 holdings vs. 96 as of the previous coverage. More specifically, approximately 20.8% of SMDV's net assets as of September 8 were allocated to 21 newcomers that were added most likely upon the annual reconstitution. Comfort Systems USA (FIX), Matson (MATX), and Premier Financial Corp. (PFC) are the three key names that made the cut, now accounting for slightly more than 1% of the net assets each.
The principal question worth asking is whether these additions contributed to a better factor profile of SMDV. And the answer would be mostly yes. Truly, out of 21 newcomers, 15 have a Quant Valuation grade of at least B-, with the above-mentioned PFC, as well as Central Pacific Financial (CPF), The First of Long Island Corporation (FLIC), and Horizon Bancorp (HBNC) being A- rated. Also, we see 11 companies from this group with single-digit P/Es, which should contribute to the fund's earnings yield (more on that below). Next, a few strong profitability stories can be spotted as well, including MATX. In my previous note, I expressed dissatisfaction with SMDV's too small share of high-quality stocks, which contradicted the concept of the dividend-growth portfolio (or, in other words, made the DPS growth thesis weaker and less sustainable). Below, we will see whether this issue has become less acute or not.
Importantly, new positions have also contributed to the dividend growth characteristics of the fund. For instance, Artesian Resources (ARTNA), a small-cap utility company, boasts 27 consecutive years of dividend increases.
Meaningful dividend compound annual growth rates are also present, with Johnson Outdoors (JOUT) being the leader in the group, sporting 22.2% and 23% 3-year and 5-year CAGRs, respectively. On the negative side, with sales forecast to remain flat going forward and diluted EPS anticipated to fall as much as 16.4%, it is questionable whether JOUT will be capable of sustaining such a solid pace of increases in the near future.
The following table is supposed to provide more context on how portfolio-wise factor exposures changed in the wake of additions and removals and the share price appreciation/depreciation of its holdings.
| Metric | March | September | Difference |
| Market Cap, $ billion | 2.870 | 2.396 | -0.474 |
| EY | 5.2% | 6.92% | 1.7% |
| P/S | 3.26 | 2.54 | -0.73 |
| EPS Fwd | 9.1% | 7.6% | -1.4% |
| Revenue Fwd | 7% | 5.3% | -1.6% |
| ROE | 16.04% | 36.82% | 20.78% |
| ROA | 4.54% | 4.5% | -0.04% |
| DY | 2.85% | 3.47% | 0.62% |
| Div Growth 3Y | 6.36% | 7.01% | 0.65% |
| Div Growth 5Y | 7.9% | 7.75% | -0.16% |
| Quant Valuation B- or better | 27.2% | 44.2% | 17% |
| Quant Valuation D+ or worse | 46.8% | 33.1% | -13.7% |
| Quant Profitability B- or better | 33.7% | 38.2% | 4.5% |
| Quant Profitability D+ or worse | 12.7% | 14.9% | 2.2% |
Calculated using data from Seeking Alpha and the fund
Let us address the main developments briefly.
- With a negative 7.6% price return, small wonder the fund's weighted-average market cap is now about $474 million lower than it was in March, as SMDV remains mostly a mid-cap play but with a much larger share of small caps, close to 43% vs. 31% previously.
- A reduction in the market cap opened the door for an increase in the earnings yield, which is slightly below 7%, as well as a compression in the Price/Sales ratio. The improvement in the forward dividend yield is also notable, as it has almost reached 3.5%.
- Most importantly, we see a much larger share of companies with a B- Quant Valuation grade, while there are fewer stocks with poor valuation ratings. This, together with a higher earnings yield, implies SMDV is better prepared for potential surprises on the inflation and monetary policy fronts, but does not immediately make it a Buy.
- Unfortunately, growth factor exposure has become smaller, with both EPS and revenue growth rates declining meaningfully. This is hardly a coincidence, as 13 stocks that were added are forecast to deliver lower EPS going forward, with 7 names from this group anticipated to experience revenue contraction as well.
- Regarding dividend growth, I would not say the fund has recorded substantial improvements, as the 3-year dividend CAGR has advanced slightly while the 5-year rate simultaneously fell.
- Ultimately, quality exposure is now more supportive of a positive view on the fund, with the contribution of the holdings with strong Quant Profitability ratings. Nevertheless, an allocation of about 38% to such names is hardly ideal, especially for a dividend-centered vehicle. Also, a more than 2x increase in Return on Equity is, on the surface, a spectacular development. But upon a more scrupulous analysis, it becomes obvious that the change was driven by just one company with an abnormally high four-digit ROE, Cogent Communications Holdings (CCOI).
Performance: Let Us Contextualize Recent Softness
A bleak performance this year is just the tip of the iceberg. In fact, even though it was mostly successful competing with the iShares Russell 2000 ETF (IWM), SMDV has had a hard time keeping pace with the iShares Core S&P 500 ETF (IVV) since its inception in 2015. The table below shows that it did beat IWM during the March 2015 - August 2023 period, delivering a CAGR a few bps higher as well as a lower standard deviation, but IVV was unrivaled nonetheless.
| Portfolio | SMDV | IVV | IWM |
| Initial Balance | $10,000 | $10,000 | $10,000 |
| Final Balance | $17,718 | $25,038 | $17,233 |
| CAGR | 6.96% | 11.40% | 6.61% |
| Stdev | 15.44% | 15.66% | 20.38% |
| Best Year | 32.51% | 31.25% | 25.39% |
| Worst Year | -5.88% | -18.16% | -20.48% |
| Max. Drawdown | -24.71% | -23.93% | -32.29% |
| Sharpe Ratio | 0.43 | 0.69 | 0.35 |
| Sortino Ratio | 0.65 | 1.05 | 0.52 |
| Market Correlation | 0.8 | 1 | 0.91 |
Created using data from Portfolio Visualizer
Moreover, in a group of dividend and/or dividend-growth vehicles I cover, SMDV delivered a hardly attractive 3-year total return of 28.2%, which is below the median by almost 10%. Price returns over shorter periods were also sluggish, as shown below.
| 6M Performance | YTD Performance | 1Y Performance | |
| SMDV | -7.92% | -4.58% | -3.69% |
| Median for the group | 0.12% | 1.95% | 3.44% |
Created using data from the Seeking Alpha portfolio tool
Final Thoughts
SMDV represents a group of small- and mid-cap dividend growers, predominantly from the financial (29.3%), industrial (23.1%), and utilities (16.2%) sectors. Unfortunately, the ETF has meaningfully disappointed since the previous note, delivering a negative total return despite the U.S. market rally. However, owing to a few improvements in factor exposure that are not obvious upon a cursory inspection, like a higher EY, the fund might still be considered tactically attractive for investors with a more hawkish view on interest rates. On the negative side, quality concerns remain, so there will be no upgrade today.
This article was written by

Analyst’s Disclosure: I/we have no stock, option or similar derivative position in any of the companies mentioned, and no plans to initiate any such positions within the next 72 hours. I wrote this article myself, and it expresses my own opinions. I am not receiving compensation for it (other than from Seeking Alpha). I have no business relationship with any company whose stock is mentioned in this article.
Seeking Alpha's Disclosure: Past performance is no guarantee of future results. No recommendation or advice is being given as to whether any investment is suitable for a particular investor. Any views or opinions expressed above may not reflect those of Seeking Alpha as a whole. Seeking Alpha is not a licensed securities dealer, broker or US investment adviser or investment bank. Our analysts are third party authors that include both professional investors and individual investors who may not be licensed or certified by any institute or regulatory body.