Patterson-UTI Energy: Dividends And Buybacks Well Supported, ~85% NOPAT Distributable

Summary
- Patterson-UTI Energy trades at tight multiples relative to its assets and cash flows, presenting potential to unlock risk capital.
- Demand for PTEN's services is high due to increased oil and gas prices and a shortage of Tier-1 rigs.
- PTEN has committed to returning 50% of its free cash flow to shareholders through dividends and buybacks, and its merger with NexTier Oilfield Solutions offers additional upside potential.
- Net-net, rate buy.
Pgiam/iStock via Getty Images
Investment summary
There is potential to unlock risk capital in owning the equity stock of Patterson-UTI Energy (NASDAQ:PTEN) in my informed opinion. The company trades at excessively tight multiples relative to the assets owned and cash flows produced by the business. Such operating capital is tremendously productive and threw off 14.5% trailing rate of return in Q2, resulting in $316mm in FCF that can both be redeployed back into the business and returned to shareholders.
The company books revenues from its contract drilling, pressure pumping, and directional drilling lines. It also recognizes income from other sources like oilfield rentals, equipment servicing, electrical controls and automation. It also has oil and natural gas working interests in a number of sites.
- Market dynamics—demand for PTEN's services
Last year (2022) was a remarkable year for commodity prices, crude oil prices included. As expected, demand for drilling and related services shot up rapidly into '23. This resulted in a shortage of Tier-1, "super-spec" rigs due to industry demand.
Oil prices cooled in FY'23 along with other commodities, but this has begun to change in the back end of '23. Current demand is high as non OPEC+ oil suppliers stretch up their capacity and output. During Q2, the average crude oil price was $73.54/Bbl, whereas spot natural gas price averaged $2.16 per MMBtu. The elevated prices for both set the stage for high demand in spec-rigs, which bodes in well for PTEN.
- Strong capital returns
As an added feature, PTEN has committed to returning ~50% of its FCF to shareholders through a combination of dividends and buybacks. In H1 FY'23, the company exceeded this target as it opportunistically repurchased shares during the period. It's NexTier Oilfield Solutions (NEX) merger, completed in June, in an all-scrip transaction of 0.7520 shares of PTEN per 1 share of NexTier is something to consider as well. Per the CEO on the Q2 earnings call:
As we roll it into NexTier, what we're really going to gain is the integration of all the other ancillary services that we can layer on there. whether it's wire line, logistics, sand handling, things like that, the power fuel systems that they have for natural gas blending at the well site, so we'll be able to layer that over time on our 12 spreads, and that's where we get a lot of upside on the 12 spreads that we're running today."
Net-net, I rate PTEN a buy based on structural dynamics in its end-markets, robust growth in unit economics, and the economic characteristics discussed in this report. I am eyeing a price band of $17–$21/share.
Figure 1.
Data: Updata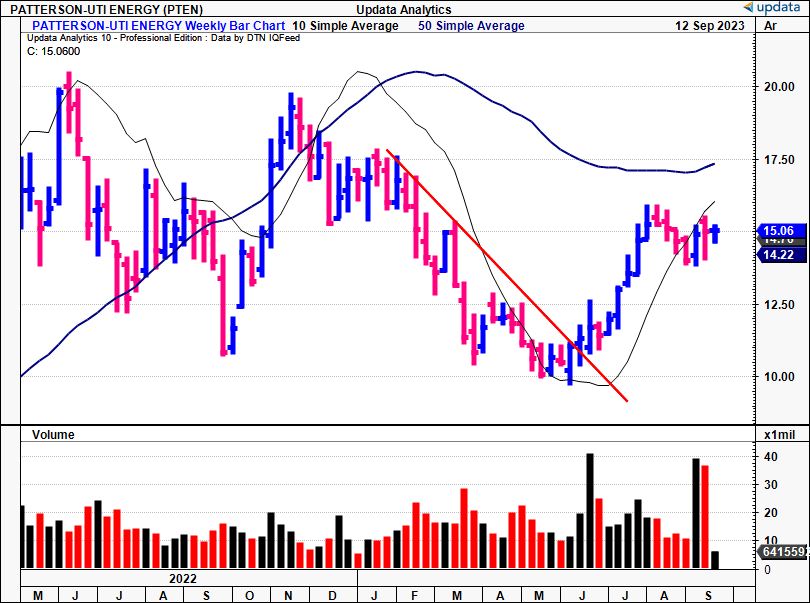
Risks to consider:
Investors should recognize the following risks in full before proceeding:
- The obvious risk is commodity price volatility. If 2022/'23 has shown us anything, is that commodity prices can swing violently, and this can result in changes to underlying market demand.
- Given the sensitivity to oil and gas prices, PTEN's share price could swing in correlation to this, without much change in business activity.
- Maco-level risks also are at play here, and this could have an impact to the company's operations, namely, the inflation/rates axis.
These risks need to be understood in full before proceeding any further.
Critical facts to investment debate
1. Overview of latest numbers
PTEN clipped a decrease in revenues from $792mm in Q1 and put up $759mm in Q2 FY'23. Revenues were still up ~22% YoY and 37% in H1 FY'23 from H1 last year. PTEN averaged 40 jobs per day in Q2, flat on last year.
Management now calls for $230mm in Q3 turnover, aiming to pull this to $37mm in gross (backing depreciation out of the calculus).This could spin off $117mm in FCF when baking in cash flow and CapEx forecasts (discussed below).
Looking to the remainder of '23, management narrowed its CapEx forecast to $485mm by yearend. The allocations include (i) $280mm for contract drilling, (ii) $140mm for pressure pumping, (iii) $20mm for directional drilling, and (iv) ~$45mm for other business expenses. The company also expects an avg. of 71 rigs to operate under term contracts in Q3, and an avg. of 44 rigs for the four quarters ending in June 2024. PTEN's operating performances for H1 FY'23 across all 3 segments are observed in Figure 2, along with the CapEx schedule YTD. Critically, growth investment in its directional drilling business was up >100% YoY and outpaced the maintenance investment charge by a similar amount, whereas contract drilling investment was up by ~$53mm over the 12 months.
BIG Insights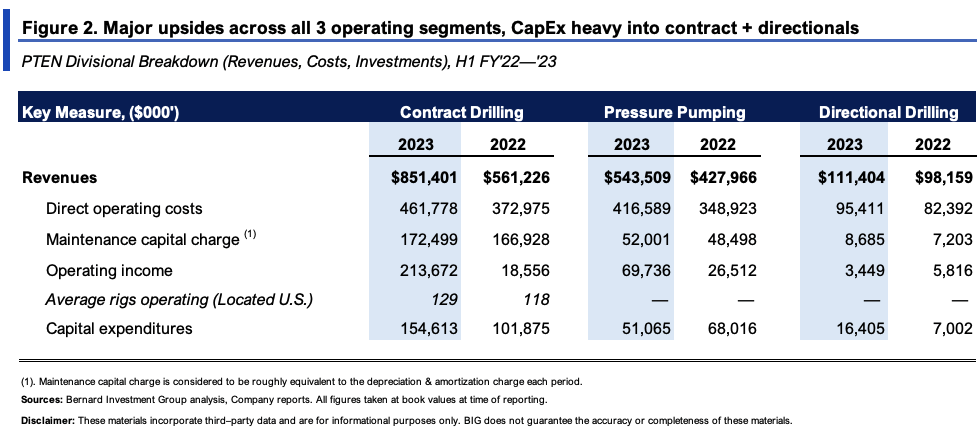
Drilling down to the core unit economics (no pun intended), the company made commitments to reducing its drilling rig count by 10 in Q3, with 6 rigs already released and 2 more expected soon. As of August, PTEN had an average of 117 drilling rigs in operation in the US, and for the 2 months ending in August, the average was 120 rigs.
As to the divisional takeouts from Q2, observe the following data points:
- Contract drilling rig margin per day was up $1,030 sequentially to $16,910/day. This stemmed from a $1,190 increase in avg. daily rig revenue of $35,940. As of Q2, PTEN held term contracts for drilling rigs in the US valued at ~$760mm (calculated at this day-rate of drilling revenue). In Colombia, Q2 contract drilling revenues tallied $12.9mm, on adj. gross margin of $3.7mm. PTEN forecasts generating approximately $8.4mm in contract drilling revenue during Q3 in Colombia.
- In the pressure pumping ("PP") segment, headwinds were seen via increased calendar gaps and lower pricing. Both impacted revenues and margins. PP revenues were booked at ~$250mm on gross of $53.8mm, 21.5% margin. In Q3, PTEN plans to operate 11 spreads, resulting in expected PP revenues of approximately $230mm, on gross of $37mm.
- Critically, however, the unit economics of its PP business look to be accretive to value in FY'23. Figure 3 outlines the H1 results across '22—'23. Total jobs were up by 6, whereas revenues/job were up ~25% YoY on average, costs up 18%, and gross margin per job grew a mammoth 58% YoY.
- Lastly, directional drilling revenues came to $55.1mm on gross of $7.8mm.
BIG Insights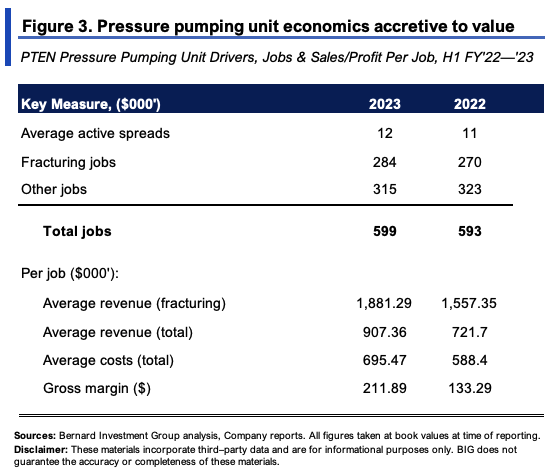
2. Capital productivity, earnings rate on capital deployed
Several factors are relevant in this thoughtful analysis of PTEN's economics. Figure 4 outlines the gross capital productivity earned on the assets employed in PTEN's business.
Gross capital productivity is a financial metric that calculates the gross profit generated by a business in the last 12 months, divided by the total amount of assets employed in the business. It includes both core and non-core assets,—which, for PTEN, are largely tangible assets that are used to perform its core services in drilling and pumping. This metric shows the percentage of gross profit that a business produces from its assets and is expressed in dollars per $1 of assets on the balance sheet at book value.
Gross profitability has increased from $0.10 on the dollar to $0.34 per $1 of assets last period, 240% incremental return. This is a superb display of capital productivity and speaks to the current state of demand in the market in my view.
BIG Insights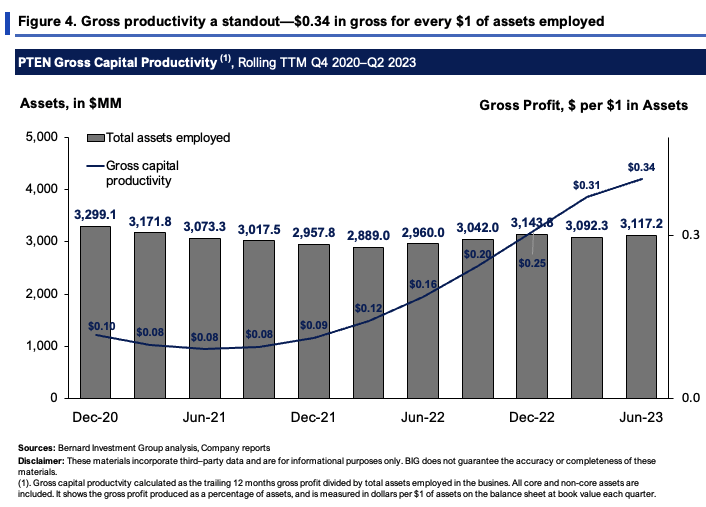
A more granular evaluation of the company's earnings rate on capital deployed is in Figure 5. Around $12.70/share in capital produced $1.83/share in NOPAT last period (TTM values).
This equates to ~14.5% return on investment, around double that seen at the end of FY'22. This should be heavily factored into the investment debate here.
More critically, the firm invested an additional $69mm to grow trailing post-tax earnings by $194mm, a 281% incremental return on capital. These are attractive economics that warrant further evaluation on the valuation front. Including all dividends and buybacks, it spun off $2.60/share to shareholders, and produced $319mm in TTM free cash flow by Q2.
By the looks of it, a bulk of this can be redeployed back into the business, and you'd be looking at $2.95Bn in capital deployed if this were the case, which could pull in $413mm in NOPAT presuming the same 14.5% rate on capital, an 8% growth on TTM values. Further, because it only reinvested 16% of earnings into the business last period at the 14.5% return, the remaining 84% is available for shareholders as buybacks and dividends (critical, as it aims to return 50% of FCF to shareholders, as mentioned).
Moreover, capital turnover and post-tax margins are both ratcheting up for the company (1.16x and 12.4% respectively) and this is a solid bedrock to continue the momentum for H2 and beyond.
BIG Insights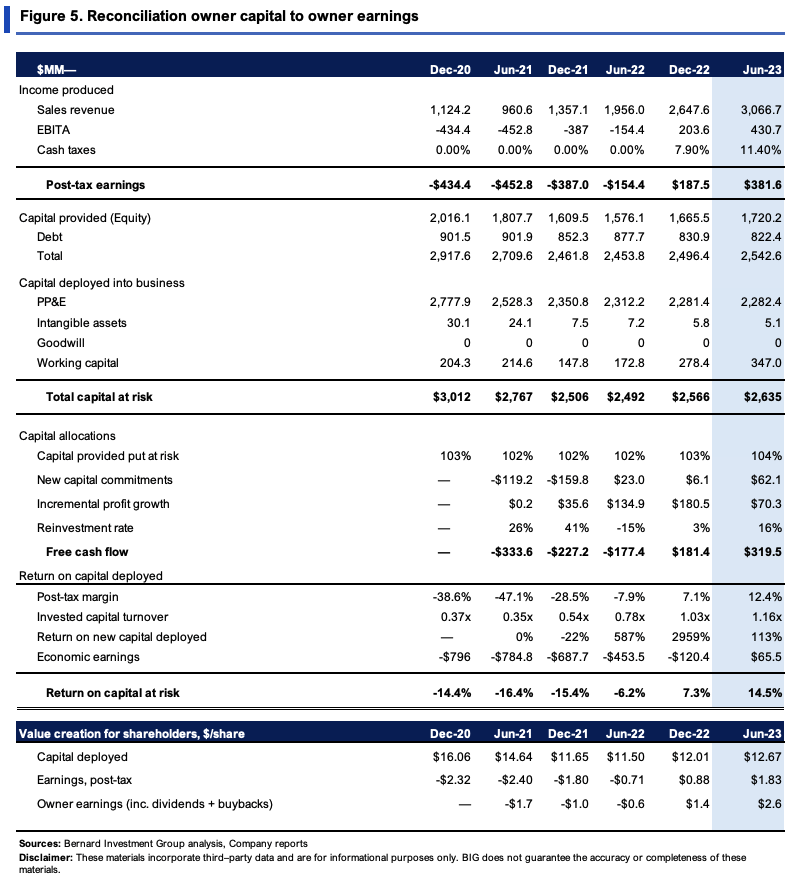
3. Valuation and conclusion
The stock sells at 10x forward earnings and 7.7x forward EBIT. These are tremendously attractive on absolute terms, and offer statistically significant upside potential provided the company can continue on its current growth rates. You're also buying a 25% forward cash flow yield in PTEN today, itself signifying the potential value on offer.
Figure 6 illustrates the market's pricing of PTEN relative to the incremental earnings rate on capital shown in Figure 5. Comparing the EV/IC to the ROIC/hurdle rate is a fruitful exercise. Both show the rate of return PTEN produced on capital. One shows the business returns, the other, the market returns on investment (the hurdle rate is 12% here). At the 113% return from Q2 FY'22—'23, and the current EV of $4.35Bn as I write, it would appear the market has only priced in ~18% of the earnings power PTEN can deliver into the coming periods. It also trades at 9.6x trailing NOPAT as I write (on a $3.66Bn market cap), and invested 16% of post-tax earnings at to produce 113% return, compounding the intrinsic value at 18% (1.13x0.16 = 0.18). Carrying this forward, and presuming the same 9.2x multiple, gets you to an implied market value of $4.14Bn or $17/share.
BIG Insights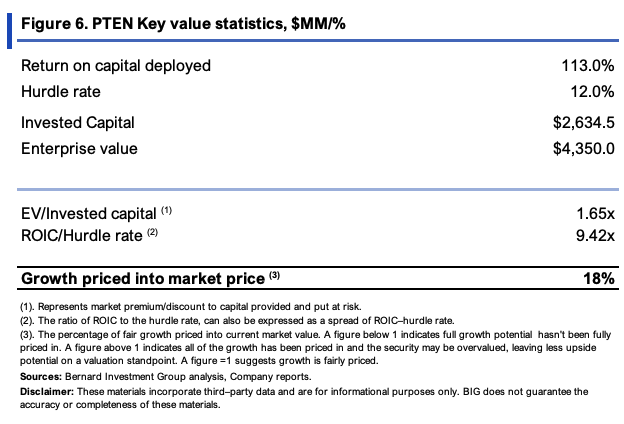
Price structure on market technicals is also supportive in my view. The stock is trading above cloud support [Figure 7] with the lagging line (in blue) in hot pursuit. PTEN tested the cloud top throughout August and has peeled away from this mark with conviction. Figure 8 shows the upside targets to $21 based on the latest price thrusts. It's good to have these levels on the P&F studies as these charts remove much of the noise and provide a more convincing directional view.
Figure 7
Data: Updata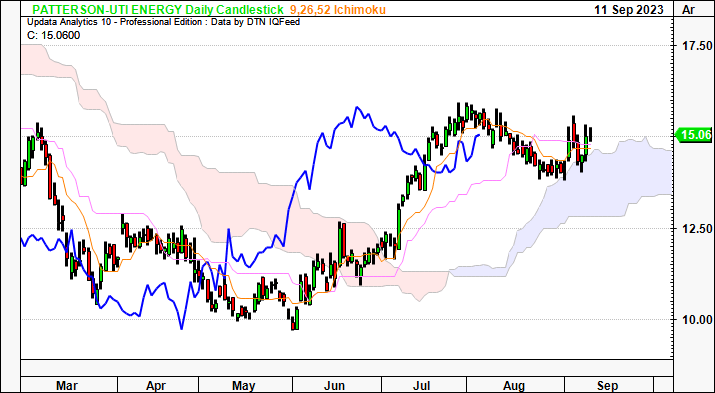
Figure 8.
Data: Updata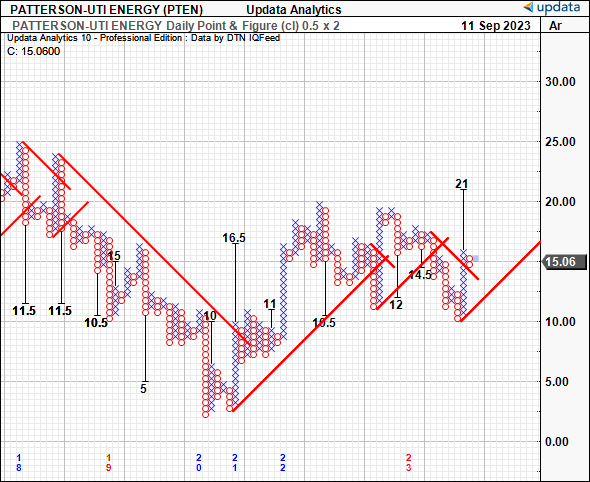
In short, the insights presented here today square off well with the economics of PTEN's business, warranting a buy rating. Earnings multiples are heavily compressed but on a 25% forward cash flow yield, whereas the rate of profits earned on capital deployed into the business is stretching higher as well. If stock returns closely follow business returns over time, this bodes in well for PTEN. Key performance indicators in its 3 segments are also positive in H1 FY'23, setting the stage for a strong back end of the year. Net-net, I rate PTEN a buy, eyeing a $17-$21/share price band based on fundamental and technical inputs.
This article was written by

Analyst’s Disclosure: I/we have a beneficial long position in the shares of PTEN either through stock ownership, options, or other derivatives. I wrote this article myself, and it expresses my own opinions. I am not receiving compensation for it (other than from Seeking Alpha). I have no business relationship with any company whose stock is mentioned in this article.
Seeking Alpha's Disclosure: Past performance is no guarantee of future results. No recommendation or advice is being given as to whether any investment is suitable for a particular investor. Any views or opinions expressed above may not reflect those of Seeking Alpha as a whole. Seeking Alpha is not a licensed securities dealer, broker or US investment adviser or investment bank. Our analysts are third party authors that include both professional investors and individual investors who may not be licensed or certified by any institute or regulatory body.
Recommended For You
Comments (2)

