Gibraltar Industries: Revenue Is The Key Lever - A 5% Sales Growth Potential In 2024

Summary
- Gibraltar Industries has differentiated offerings in its solar racking business lines and residential business, contributing to top-line expansion.
- Sales growth appears critical factor in determining the corporate value going forward, meaning ROCK can surprise to the upside based on 2024 estimates.
- Net-net, rate buy.
Pgiam/iStock via Getty Images
Investment briefing
Those seeking to unlock risk capital might be interested in the economic prospects of Gibraltar Industries (NASDAQ:ROCK). The company has differentiated offerings in its solar racking business lines, which, combined with its residential business, contributed to top-line expansion and rotated capital invested at ~1.4 turns these past 12 months.
This report will unpack the moving parts in the ROCK investment debate and link this back to the economics of the business and what value can be unlocked going forward. It would appear that corporate value is most sensitive to sales growth for ROCK and thus it would be wise to benchmark this KPI going forward. Other factors to consider are discussed here. Net-net, I rate ROCK a buy at an $80-$88 target band.
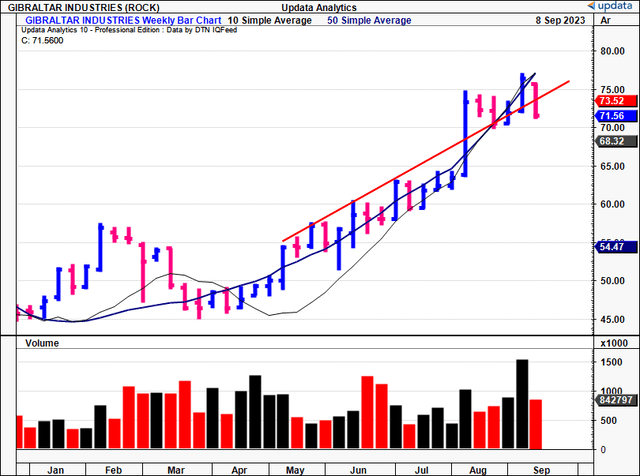
Figure 1. ROCK price evolution in 2023 (weekly bars)
Key risks to thesis
Investors should recognize the following set of risks in full:
- Findings presented here illustrate the sensitivity of ROCK's measures of value to top-line sales. A large correction in the firm's sales growth could hamper its ability to create market value.
- Macro-level risks could hamper the company's ability to grow operations whilst adding costs to business returns (from the inflation/rates axis)
- Being a company with smaller capitlization, ROCK's equity stock may be subject to asymmetrical price risk, that may arise from market forces, and not reflect underlying business fundamentals. This should be heavily considered.
Investors must realize these in full before proceeding further.
Critical investment facts forming buy thesis
Insights from Q2 FY'23 numbers
Sales growth in Q2 was down ~850bps YoY. ROCK booked $364mm at the top line on adj. EBITDA growth of 18% YoY and EPS upside of 23%. It printed $76mm in OCF on the sales clip, so ~21% of Q2 turnover was therefore 'cash revenues'.
Cash collections were higher from the combination of (i) inventory work through, (ii) collections from its receivables account, (iii) increased accounts payable, and (iv) shorter lead times on its project-related deposits and billings. All up, $40mm was realized from NWC improvements. ROCK also bought back ~368,000 of its common shares for $17.8mm, at an avg. cost of $48.40/share. These repurchases were paid for with OCF as well. It also acquired a Utah-based building accessory company for $10.4mm, at 1.2x sales or 6x EBITDA. Given this free cash flow came in at 20% of turnover for Q2, important for its growth initiatives going forward.
Based on these results and the current outlook for its markets, management raised its full-year guidance and now expects consolidated sales between $1.36Bn-$1.41Bn on an operating margin of 11.1%-11.3%, ~12% higher vs. previous guidance. It is eyeing EPS of $3.46-$3.66 on these numbers.
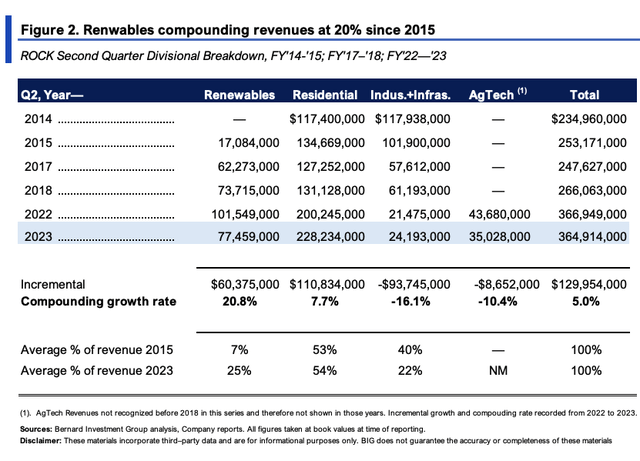
Regarding ROCK's intra-segment growth, Figure 2 depicts the long-term growth rates of each operating segment since 2014 in selective periods. Several critical factors are noted.
- First is the infrastructure division has shrunk in revenue terms at a 16% geometric rate since 2014, clipping $24.2mm in Q2 '23, vs. $117.9mm in Q2 '14. This fits with investment trends seen in infrastructure investments in the broader economy.
- Secondly, the residential arm brings in the most income on an absolute basis, and clipped $228.3mm last quarter, having compounded at a 770bps rate since 2014.
- It's also worth noting that sales from its renewables division (solar racking products + services) has grown at a 21% compounding rate since 2015, making it the highest-growth division.
- Finally, infrastructure as a percent of total sales has crimped by ~18 percentage points, with its renewables segment picking up the revenue share (7% in '14 to 25% in Q2 '23).
Circling back to the quarter just been, the divisional highlights were as follows:
- ROCK's residential sales were up 14% to $228.2mm as mentioned earlier. Growth was largely organic, with its Quality Aluminum Products ("QAP") acquisition driving the remainder of upsides. Management estimates the residential market is following normal seasonal patterns, with expected volumes in Q2 and Q3 thus far. One of the major tailwinds I have noted here is that-unlike in many adjacent and separate sectors-inventory destocking in ROCK's is basically complete, resulting in a good showing of demand in ROCK's residential markets. For many names within our investment universe destocking is a persistent problem in 2023, particularly those in the biotech, pharmaceuticals, med-tech/medical instruments, electric utilities + components, technology distributors, and other industrials. Due to the 2022 supply-chain fiascos, demand and order volumes have pared right back as customers overstocked to avoid the supply volatilities. With many still going through the destocking phase, companies are being forced into inventory corrections/write-downs, plus there's plenty of delinquent inventory out there. Given ROCK seems to have worked through this in its residential markets, this could be a meaningful tailwind for the next 6-12 months in my view.
- Renewables bought in quarterly revenues of $77.5mm, down from $101.5mm the year prior. A number of scheduling changes was responsible for the tighter revenue clip (module supply, local permitting delays, so not necessarily company related). But as a tailwind, management said that new bookings "more than doubled in the quarter". The segment's backlog was therefore up 17% sequentially from Q1, and is up 6% YoY.
- The AgTech segment was down 16.1% YoY due to commercial business delays and project start delays. This is an exogenous problem related to new starts in the industry. But new orders in its produce business are expected to drive sales growth in H2, as backlog 16.2% sequential increase in backlog. It also secured a c.$30mm produce project during the quarter, representing phase 1 of a 2-phase project.
- Revenues booked in its infrastructure business were up 12.6% sales due to strong demand, participation gains, and the positive impact of infrastructure investment. There's been a notable upswing in global infrastructure investment so I'm not surprised to see this spill over to ROCK in H1 this year. As further evidence of this, order flow for ROCK's infrastructure line is robust, with a 46% YoY backlog growth in both fabricated and nonfabricated product lines.
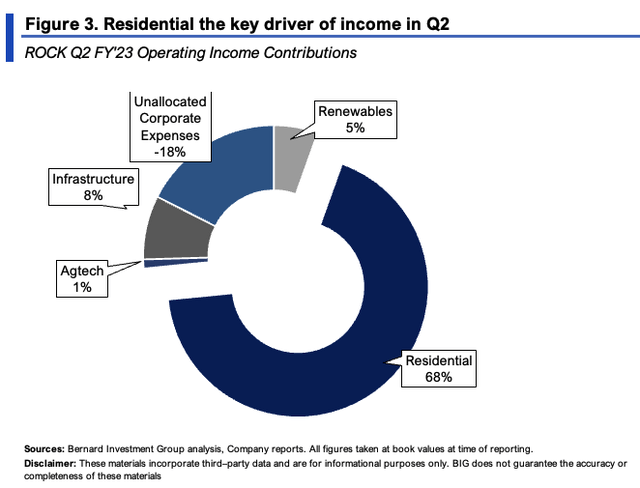
The breakdown on Q2 contributions to operating income is observed in Figure 3, below.
Value drivers observed to date
A thoughtful analysis of ROCK's value drivers over the last 3 years provides unique insights into the operating characteristics of the building products manufacturer.
Figure 4 outlines the key numbers from 2020-2023 on a rolling TTM basis. There are 6 drivers to operating value discussed here, and I've also checked the M&A contribution for a holistic view, but it is excluded from the final calculus. The rates of change in NWC and fixed assets are taken with respect to the incremental change in revenues.
Sales growth was 2.8%, roughly in line with global GDP growth over this time. Pre-tax margins were stable and averaged ~11.9% over this time.
Since 2020 the company has invested $0.117 for every new $1 in sales. Investments in fixed capital were $0.05 on the dollar, but the increase in NWC requirements was were most of the money went-for every $1 in new sales, the company increased its NWC by $0.14. Intangible intensity was down 7.4%.
BIG Insights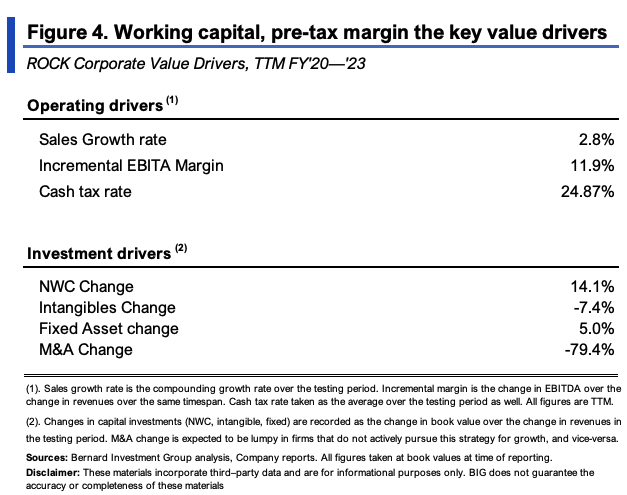
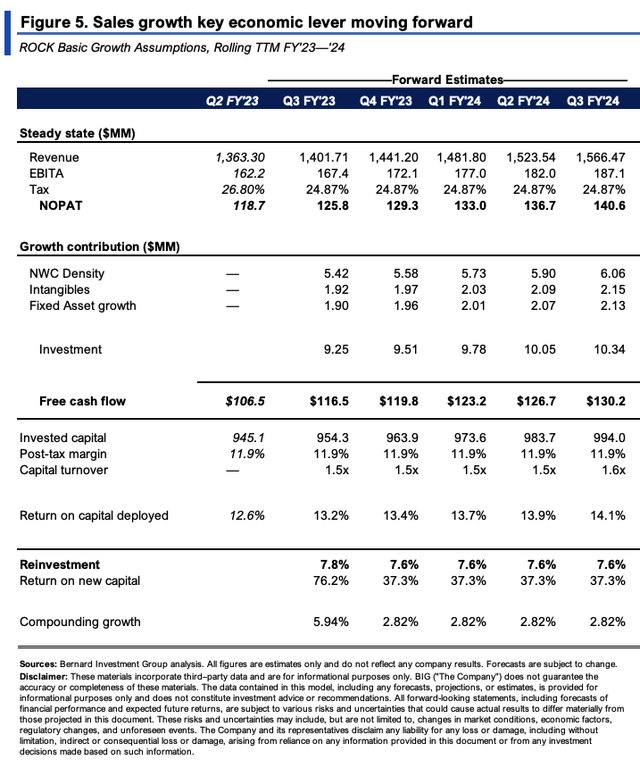
As a very simplistic exercise, I carried these drivers forward to see what cash flows ROCK could produce downstream. This estimates what it can do at its steady state, including the average reinvestment rate.
All assumptions from Figure 4 are plugged into the output shown in Figure 5. I included intangible intensity at 5% of the change in sales (versus the negative 7.4%), which are forecast to grow at 2.8% each period.
On these basic assumptions, ROCK could spin off $130mm in FCF in the 12 months to Q3 FY'24, reinvesting just 7.6% of earnings each period to get there (note: excludes buybacks). This could see it compound intrinsic value at ~280bps on average each period as well (17.2% cumulatively).
Again, Figure 5 presumes no changes from that seen in the last 2 years, and for ROCK to carry this 'steady-state' through until H2 FY'24. But should revenues grow at 5% (a 2.2 percentage point increase), this gets you to $136mm in FCF and ROIC of 15%, compounding intrinsic value at 5% on average.
If sales growth stays flat, and operating margin increases by 2.5 percentage points (to 14.4%), this gets you to $139mm in FCF, 17% ROIC, but no additional change in intrinsic value beyond the average-2.8%.
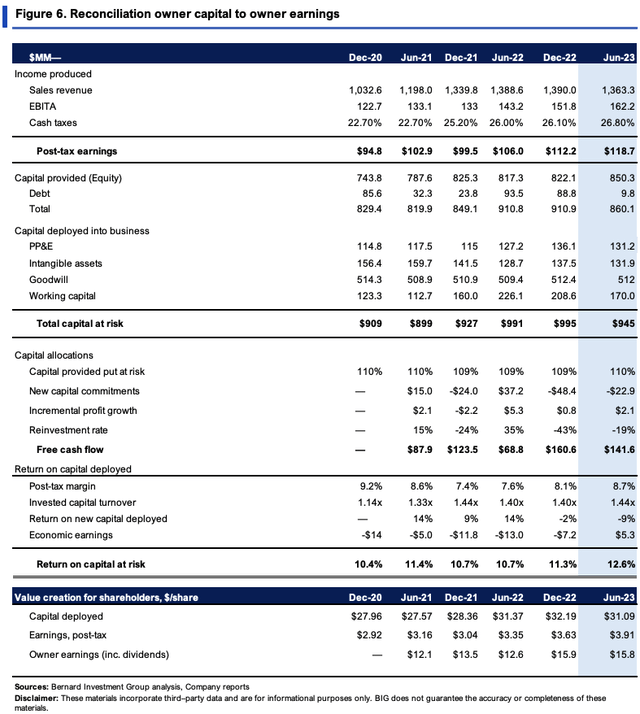
Figure 6 is a more granular view of Figure 4, reconciling owner earnings produced on capital provided by investors (and then put at risk by the company) on a rolling TTM basis.
ROCK has deployed 110% of the capital it's been provided (the extra 10% via retained earnings) as of Q2 FY'23. A reduction in NWC density has pared back the total capital required to run the business, which is $945mm or $31.09/share.
The c.$31/share produced $3.91/share in earnings, a 12.9% return on investment. Critically, the company has grown the return on existing capital at risk by 280bps from 2020. It brought in $5.3mm in economic earnings for the period, and spun of $15.8/share to shareholders after all investments are tallied (this includes buybacks). The lever is in capital turnover, as post-tax margins are thin, but what investments ROCK does make returns back ~$1.40 on the dollar in sales.
You'll note that in Figure 5 it stipulates the firm's rate of return on capital could push to avg. ~13.5% if it continues at its current growth rates. This is a potential bullish point, corresponding to $136mm in NOPAT produced on ~$984mm capital at risk by Q2 FY'24. It would need to produce another $17.3mm in NOPAT off a $38.6mm incremental investment in the next 12 months to hit these numbers.
Valuation and conclusion
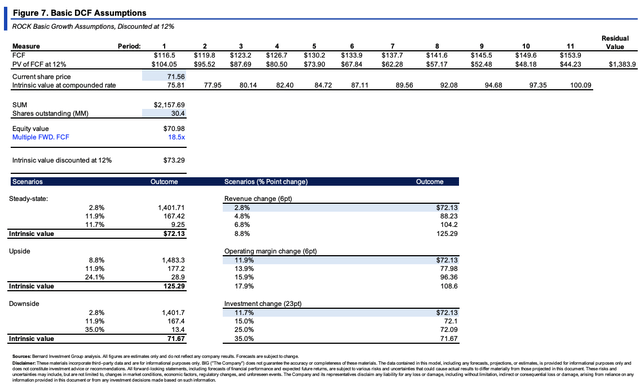
The stock sells at 17.8x forward earnings and ~13.5x forward EBIT. You're buying a 10% forward cash flow yield at these prices as well. Relating back to the value drivers of before, the base-case DCF assumptions are observed in Figure 8. Extending the analysis out over the coming 12 periods, and discounting at 12% (long-term market averages) gets you to ~$71 in corporate value. Compounding ROCK's intrinsic value at the function of its ROIC and the rate it reinvests gets you to $73.30 (after discounting back at 12%). The average of the two is $72.13.
The valuation is most sensitive to sales growth, as seen in Figure 7. This squares off with the economics of the business (capital turnover more valuable vs. post-tax margins).
If ROCK grows sales at 5% into the next 3 years, it could be worth closer to $88/share, versus a lift in operating margin to ~14% ($73 of value) for example. Investing more at the current rates of return doesn't do much for the company's implied value. Consensus has it to do 6% sales growth in FY'24, which is notable. I am aligned with this view, and would be looking to a value at the $80-$88/share mark based on these assumptions.
In short, there are multiple inflection points to consider in the ROCK investment debate. Notable tailwinds include:
(i). Inventory destocking now finished in end-markets (many other sectors/industries in our investment universe as still incurring these headwinds);
(ii). Rate of return on capital deployed in the business ratcheting higher over time, now above the key 12% threshold;
(iii). Reasonable FCF production that can be redeployed at these higher rates of return.
Sales growth seems to be the main driver and this squares off with the economics of the business, as capital turnover is a key driver of profitability. Based on factors uncovered here, it would appear ROCK can continue compounding its intrinsic value at a reasonable clip, provided it can push sales to the 5-6% region by FY'24. Net-net, I rate ROCK a buy at an $80-$88/share valuation.
This article was written by
Analyst’s Disclosure: I/we have a beneficial long position in the shares of ROCK either through stock ownership, options, or other derivatives. I wrote this article myself, and it expresses my own opinions. I am not receiving compensation for it (other than from Seeking Alpha). I have no business relationship with any company whose stock is mentioned in this article.
Seeking Alpha's Disclosure: Past performance is no guarantee of future results. No recommendation or advice is being given as to whether any investment is suitable for a particular investor. Any views or opinions expressed above may not reflect those of Seeking Alpha as a whole. Seeking Alpha is not a licensed securities dealer, broker or US investment adviser or investment bank. Our analysts are third party authors that include both professional investors and individual investors who may not be licensed or certified by any institute or regulatory body.
