VFQY: Valuation And Diversification Look Great, Return Not So Much

Summary
- Vanguard U.S. Quality Factor ETF is an actively-managed fund that invests in U.S. stocks with strong fundamentals.
- VFQY is more diversified than its competitors in terms of holdings, sectors, and size segments.
- The fund is cheaper than its competitors in terms of valuation metrics, but its past performance has been underwhelming.
- Quantitative Risk & Value members get exclusive access to our real-world portfolio. See all our investments here »
sasirin pamai
This article series aims at evaluating ETFs regarding the relative past performance of their strategies and quality of their current portfolios. As holdings and data change over time, updated reviews are posted when necessary.
VFQY strategy and portfolio
Vanguard U.S. Quality Factor ETF (BATS:VFQY) started operations on 02/13/2018 with the objective of investing in stocks with strong fundamentals. It is an actively-managed fund with 448 holdings, a 12-month distribution yield of 1.55% and an expense ratio of 0.13%. Dividends are paid quarterly.
As described by Vanguard, portfolio managers select stocks using...
a rules-based screen designed to promote diversification and to mitigate exposure to certain less liquid stocks. Securities with relatively strong fundamentals may be identified by measures such as strong profitability, sustainable earnings, and healthy balance sheets.
The fund is actively managed: It allows a lot of flexibility in the investing process, but it is impossible to backtest or duplicate like an index-based fund.
VFQY is almost exclusively invested in the U.S., from micro to mega cap companies.
% of asset value by size segment (Chart: author; data: Fidelity)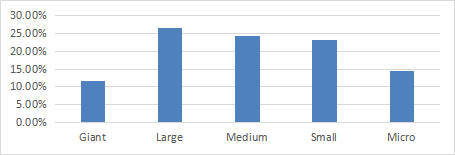
VFQY has three major competitors tracking rules-based indexes:
- iShares MSCI USA Quality Factor ETF (QUAL)
- JPMorgan U.S. Quality Factor ETF (JQUA)
- Invesco S&P 500 Quality ETF (SPHQ)
This list doesn't include funds with hybrid strategies where quality is combined with other investing styles, like momentum or dividend (JOET, QDF, DGRW,…).
These funds have similar expense ratios. VFQY is the most recent, the smaller in assets and the less liquid one. Its portfolio is better diversified regarding component number and weight in the top 10 holdings, as reported in the next table.
VFQY | QUAL | JQUA | SPHQ | |
Inception | 2/13/2018 | 7/16/2013 | 11/8/2017 | 12/6/2005 |
Expense Ratio | 0.13% | 0.15% | 0.12% | 0.15% |
AUM | $239.50M | $32.16B | $2.04B | $5.97B |
Holdings | 453 | 129 | 264 | 102 |
% in Top 10 | 14.44% | 39.31% | 19.66% | 45.32% |
Turnover | 49.00% | 41.00% | 18.00% | 65.00% |
Average Daily Dollar Volume | $688.87K | $175.22M | $14.02M | $31.80M |
Data source: Seeking Alpha
The portfolio is nicely balanced in its top three sectors - consumer discretionary, technology and industrials - each of them weighs between 18.7% and 19.7% of asset value. They are followed by financials, energy and healthcare, in a 9% to 13% range. Other sectors are below 6%. Compared to its competitors, VFQY overweights mostly consumer discretionary and industrials. It underweights technology, healthcare, communication and almost ignores real estate and utilities.
Sector breakdown (chart: author; data: Vanguard)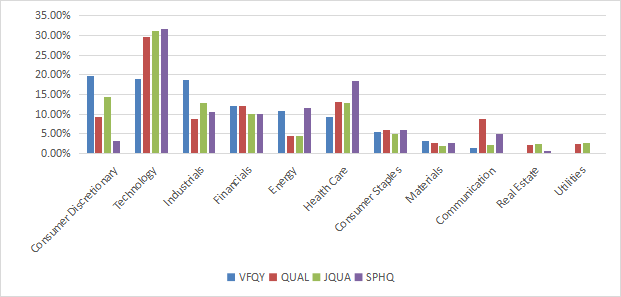
The next table lists the top 10 holdings with fundamental ratios. The heaviest one weighs about 2%, so risks related to individual companies are low.
Ticker | Name | Weight (%) | EPS growth %TTM | P/E TTM | P/E fwd | Yield% |
Walmart, Inc. | 2.11% | 3.67 | 31.54 | 25.38 | 1.39 | |
Kimberly-Clark Corp. | 1.82% | -8.19 | 26.28 | 19.76 | 3.70 | |
Adobe, Inc. | 1.74% | 2.28 | 53.48 | 35.63 | 0 | |
Apple, Inc. | 1.59% | -1.68 | 29.94 | 29.43 | 0.54 | |
The TJX Cos., Inc. | 1.54% | 21.64 | 26.82 | 24.61 | 1.45 | |
Autodesk, Inc. | 1.53% | 59.26 | 54.25 | 29.37 | 0 | |
The Estee Lauder Companies, Inc. | 1.40% | -57.35 | 55.27 | 41.09 | 1.71 | |
PepsiCo, Inc. | 1.35% | -14.16 | 30.90 | 23.53 | 2.87 | |
Lam Research Corp. | 1.33% | 1.21 | 20.18 | 24.42 | 1.20 | |
KLA Corp. | 1.28% | 10.00 | 20.65 | 22.22 | 1.04 |
Data: Portfolio123
Fundamentals
The next table compares fundamental metrics in the four quality ETFs, and adds the S&P 500 as a benchmark (SPY).
VFQY | QUAL | JQUA | SPHQ | SPY | |
Price/Earnings TTM | 12.28 | 24.02 | 22.74 | 21.86 | 22.4 |
Price/Book | 3.06 | 6.55 | 5.32 | 5.75 | 3.99 |
Price/Sales | 1.22 | 3.73 | 3.1 | 2.77 | 2.55 |
Price/Cash Flow | 9.28 | 15.8 | 15.7 | 14.17 | 15.81 |
Earnings growth | 22.10% | 19.13% | 18.61% | 23.76% | 17.79% |
Sales growth | 14.58% | 17.82% | 13.86% | 16.78% | 11.41% |
Cash flow growth | 19.09% | 20.70% | 12.04% | 31.03% | 8.01% |
Source: Fidelity
VFQY is much cheaper than the benchmark and its competitors regarding valuation ratios. It is in the middle of the pack for growth metrics, yet better than SPY.
Performance
The next chart plots total returns since the fund's inception.
VFQY vs. peers since February 2018 (Seeking Alpha)
VFQY has lagged the benchmark and its competitors by 17% to 26% since February 2018, and by 5% to 10% in 2023 to date (next chart). However, price history is short and may not be indicative of future performance.
VFQY vs. Peers, year-to-date (Seeking Alpha)
In previous articles, I have shown how three factors may help cut the risk in a portfolio: Return on Assets, Piotroski F-score, and Altman Z-score. The next table compares VFQY since 3/1/1018 with a subset of the S&P 500: stocks with an above-average ROA, a good Altman Z-score and a good Piotroski F-score. The subset is rebalanced annually to make it comparable with a passive index.
Total Return | Annual Return | Drawdown | Sharpe ratio | Volatility | |
VFQY | 61.43% | 8.95% | -37.41% | 0.45 | 20.58% |
Quality subset | 83.07% | 11.43% | -34.04% | 0.55 | 19.33% |
Past performance is not a guarantee of future returns. Data Source: Portfolio123
VFQY underperforms this quality subset based on very simple rules. However, ETF performance is real, and this subset is hypothetical. My core portfolio holds 14 stocks selected in this subset (more info at the end of this post).
Quality funds are not focused on dividend, but it is interesting to look at the influence of different quality strategies on distributions and their growth.
VFQY | QUAL | JQUA | SPHQ | SPY | |
Yield | 1.55% | 1.28% | 1.30% | 1.60% | 1.46% |
Dist./share 2019 | 1.16 | 1.62 | 0.52 | 0.55 | 5.62 |
Dist./share 2022 | 1.50 | 1.81 | 0.62 | 0.81 | 6.32 |
Dist. Growth | 29.31% | 11.73% | 19.23% | 47.27% | 12.46% |
All yields are close to the benchmark. Regarding dividend growth, VFQY is second to SPHQ. The 3-year growth rate of 29.3% beats the cumulative inflation: about 15% in the same time, based on CPI.
Takeaway
Vanguard U.S. Quality Factor ETF is an actively-managed fund invested in over 400 U.S. companies with quality characteristics. The fund is more diversified than its competitors across holdings, sectors and size segments. It is also cheaper regarding valuation metrics. However, past performance is underwhelming. Nevertheless, the fund has less than 6 years of historical data, which may be too short to assess the strategy. The next table is a summary of positive and negative points, relative to its peers and the benchmark. Negative points outnumber positive ones, but they may not be of equal importance depending on your situation and objectives. Feel free to use this to make your own score.
Strategy transparency | - |
Track record length | - |
AUM and Liquidity | - |
Diversification | + |
Valuation | + |
Return | - |
Dividend Growth | + |
Quantitative Risk & Value (QRV) features data-driven strategies in stocks and closed-end funds outperforming their benchmarks since inception. Get started with a two-week free trial now.

This article was written by

Step up your investing experience: try Quantitative Risk & Value for free now (limited offer).
I am an individual investor and an IT professional, not a finance professional. My writings are data analysis and opinions, not investment advice. They may contain inaccurate information, despite all the effort I put in them. Readers are responsible for all consequences of using information included in my work, and are encouraged to do their own research from various sources.
Analyst’s Disclosure: I/we have a beneficial long position in the shares of ADSK, KMB either through stock ownership, options, or other derivatives. I wrote this article myself, and it expresses my own opinions. I am not receiving compensation for it (other than from Seeking Alpha). I have no business relationship with any company whose stock is mentioned in this article.
Seeking Alpha's Disclosure: Past performance is no guarantee of future results. No recommendation or advice is being given as to whether any investment is suitable for a particular investor. Any views or opinions expressed above may not reflect those of Seeking Alpha as a whole. Seeking Alpha is not a licensed securities dealer, broker or US investment adviser or investment bank. Our analysts are third party authors that include both professional investors and individual investors who may not be licensed or certified by any institute or regulatory body.