Dycom Industries: Economic Leverage Underreflected At Current Multiples, Rate Buy

Summary
- Dycom Industries, Inc. is an investment-grade company that has been overlooked this year.
- The company is well-capitalized and has the ability to reinvest substantial rates of growth capital at respectable rates of return.
- The stock sells at compressed multiples and warrants a higher rating based on these economic characteristics.
- Net-net, rate buy.

naphtalina/iStock via Getty Images
Investment briefing
Intelligent investors chasing productive compounders of capital will look to Dycom Industries, Inc. (NYSE:DY) with pleasure in my opinion. The firm has been overlooked this year despite producing exceptional economic characteristics for its shareholders and selling at a relative discount to peers. This report will unpack all of the moving parts in the DY investment debate and outlay the case as to why we believe it is an investment-grade company and deserves attention in the long account. DY is well capitalized to continue reinvesting substantial rates of growth capital into its growth initiatives at very respectable rates of return. It would appear DY can continue spinning off piles of cash whilst doing this, with $50mm returned to shareholders in the last 12 months alone. Net-net, I rate DY a buy, eyeing a $163 price objective, based on the economic growth levers discussed here today.
Figure 1.
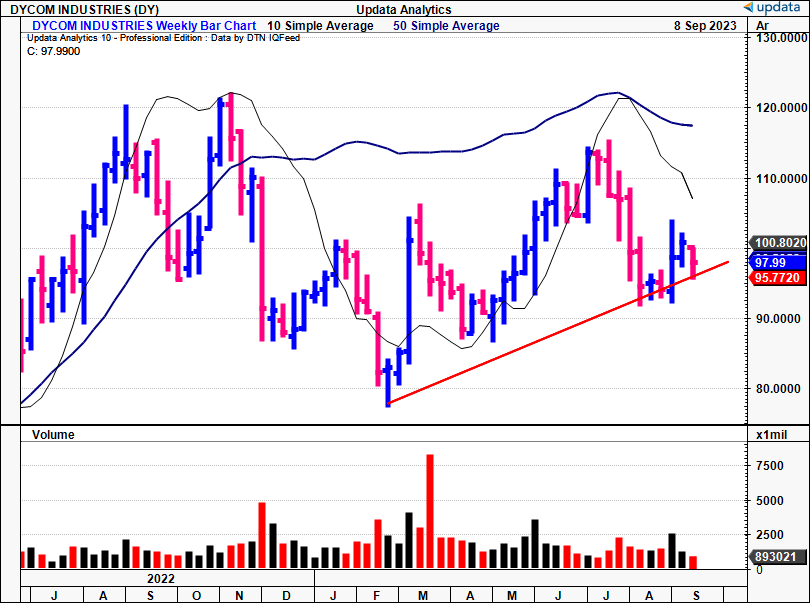
Data: Updata
Risks to investment thesis
Investors must realize the following set of risks that could impact the investment thesis:
- The market has overlooked DY's economic characteristics this YTD and there is no saying it will catch a bid without an identifiable catalyst. This should be considered.
- Macro-level risks shouldn't be discounted either, given the systematic risks posed to broad equities.
- The company's top 5 customers make up the bulk of its income, which could be a concentration risk going forward.
Investors should understand these risks in full before proceeding to any decisions.
Critical facts to investment debate
1. Q2 FY'24 earnings insights—contract growth, accounts booking more sales
There are multiple positives to discuss from DY's Q2 FY'24 numbers [note: DY reported its 2nd quarter revenues for its fiscal '24, corresponding to Q2 CY'23. For consistency and simplicity, I'll be talking in terms of Q2 '24 from hereon in, unless otherwise stated].
DY put up quarterly contract revenues of $1.042Bn, a growth of 7.1% YoY, on gross margins of 20.3%—a decompression of ~230bps YoY. It pulled this down to adj. EBITDA of ~$131mm, equating to a c.13% pre-tax margin on earnings of $2.03/share. I'd also point out the combined DSO for its receivables account and net contract assets increased by 5 days sequentially, tallying 111 days.
Management revised up its Q3 '24 forecasts on contract revenues to $30mm, and consensus is eyeing $4.11Bn in revenues for the full year, calling for 8% growth at the top. This isn't an unreasonable forecast in my view. But most critically, the forecasts are for the 8% revenue growth to pull down to 36% upside in earnings, meaning each $1 in new revenues could produce $4.50 in new earnings. Quite constructive in my view.
Figure 2. DY Q2 '24 contract revenues and customer accounts
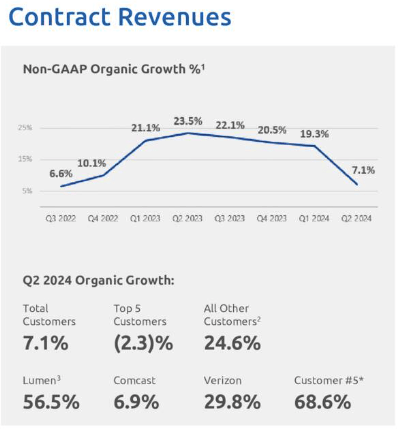
Source: DY Q2 FY'24 Investor Presentation
The company's backlog at the end of Q2 stood at $6.207Bn, having worked through ~$109mm from the previous quarter. Of the backlog in its pipeline, DY expects to work through ~$3.5Bn within the next year or so. The enterprise performed well during this quarter, with the acquisition of new contracts and the renewal of existing ones.
As to the customer breakdown, the following points are relevant:
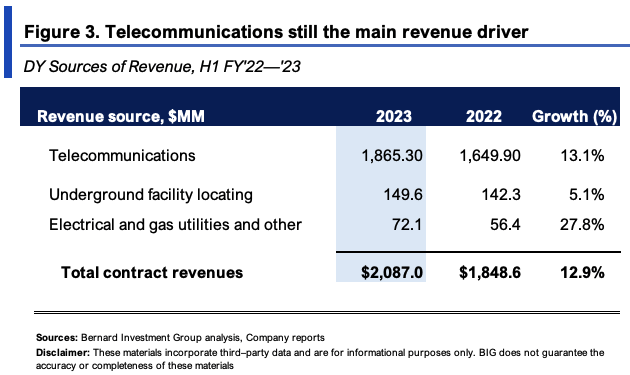
- The top 5 customers contributed ~60% of Q2 turnover. Demand saw an uptick among 4 of the top 5 accounts, with the remainder of accounts up 24.6% on aggregate. Telecommunications remains the company's main revenue driver this YTD and was up 13% in H1. But it brought in 28% higher sales on its electrical utilities business to $72mm, as shown in Figure 3.
- Crucially, turnover from fibre construction and electric utilities was up 350bps YoY and amounted to $82.7mm. Frontier and Brightspeed awarded the company contracts for fiber construction in multiple and select states, respectively.
AT&T (T) emerged as the largest account, booking for 16.7% of the top line, or $174.3mm.
Lumen (LUMN), the 2nd largest customer, accounted for 15.6% and brought in $162.5mm. This was a growth of 56.5% YoY.
Its Comcast (CMCSA) accounts generated $119.5mm in revenue, growing ~7% YoY. Further, sales brought in on its Verizon (VZ) contracts were up ~30% YoY to c.$105mm.
BIG Insights
2. Recycling capital at attractive rates of return
Corporate managers, like portfolio managers and equity investors, are tasked to compound money. For a firm to create value it should be doing so at rates above what investors could generally achieve (these days, by simply riding benchmarks and so forth). Return on investment/capital is the central theme here—you want your capital more valuable in your company's hands than your own. So profits need to be compared to what kind of resources were required to produce them (i.e., as a percentage of assets/capital employed). For DY, three critical factors are relevant in this discussion.
One, the gross DY is rotating back off assets employed into the business is a standout. Figure 4 depicts this on a rolling TTM basis. All core and non-core assets are included. For starters, it pulled in $0.31 of gross for every $1 in assets last period on a total of $2.4Bn, and this is up from $0.22 and $0.25 over the last two periods. This equates to $246mm additional gross profit produced on $133mm in asset growth over the last 2 years—attractive productivity in my view.
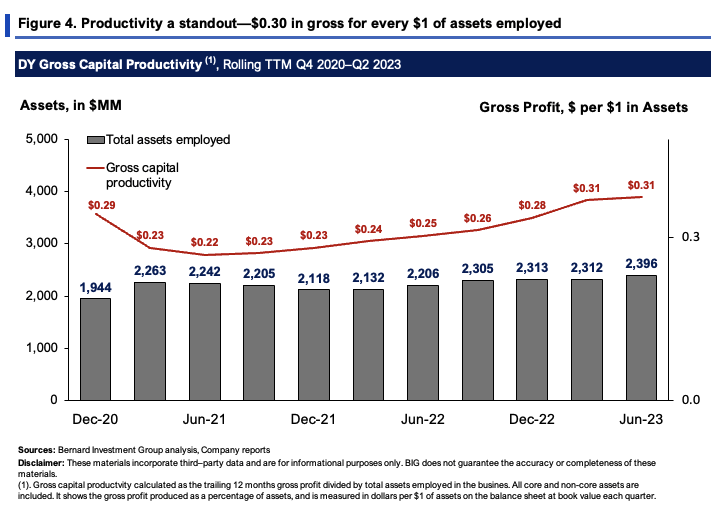
Note: Dates are shown in calendar years, and do not correspond to DY's fiscal years. CY Q1 = FY Q1.
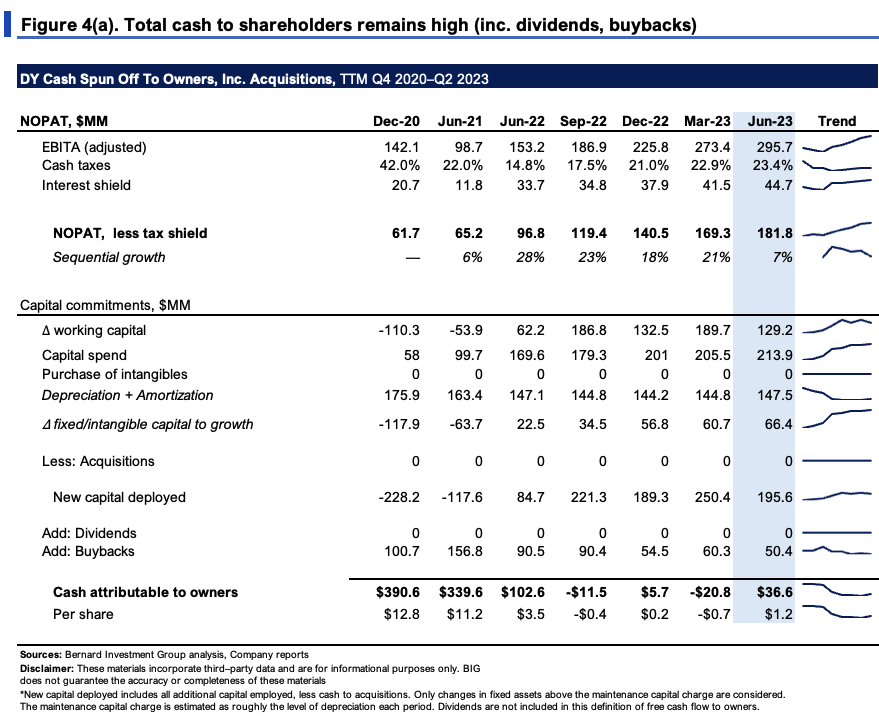
Two, the firm is investing heavily into its growth operations. The net effect has been a solid ramp on pre and post-tax earnings (considered EBITA and net operating profit after tax here). Figure 4(a) outlines this in full on a rolling TTM basis. It shows the new capital DY has deployed into the business. Only changes in fixed capital above the maintenance capital charge are considered to be 'growth investments'. The maintenance capital charge is estimated at roughly the level of depreciation. Buybacks are included in the calculation of free cash flow to owners. Pre and post-tax earnings are up 109% and 195% over the last 2 years respectively, demonstrating what's on offer. It has put up a series of sequential growth rates whilst ploughing in sizeable sums to its growth operations. It has reinvested ~$195mm above the maintenance investment in the last 12 months, and still recycled back a net $37mm to owners in the same period—$50mm of buybacks included ($181mm NOPAT less $196mm investment + $50mm buyback).
BIG Insights
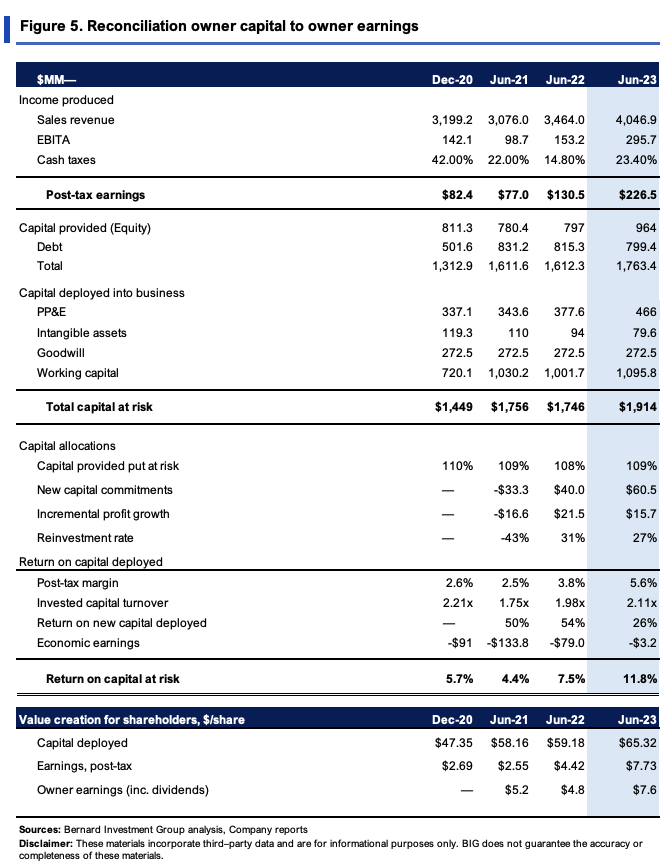
Three—and most critical to this analysis—are the rates of return produced on these growth investments. Figure 5 reconciles DY's owners' capital to the economic and owner earnings produced each rolling TTM period. These are shown against asset values at book value each period. The calculations are a little different from Figure 4(a) in that all sources of invested capital are included. Around $1.8–$1.9Bn is required to run the business at its current level of operations. The $1.9Bn in capital produced $226.5mm in trailing NOPAT last period, otherwise $65/share returning $7.73/share in earnings after-tax—11.8% return on investment. This is below long-term market returns on capital of ~12%, a figure we require of all our equity holdings.
But this shows the return on DY's existing capital—not the incremental growth in profitability on its growth investments. A more intelligent view is required. As such, its new commitments have brought in incremental returns on investment of 50% in Q2 FY'22; 54% in Q2 FY'23; and 26% in Q2 FY'24. Said differently, DY invested an additional $7.16/share in new capital in the last 2 years to Q2 FY'24, producing new post-tax earnings of $5.18/share—72.3% incremental return on investment. The gains are efficiency-driven as well. Post-tax margins are thin (common in industrials) but the capital turnover is high, 2.11x last period. Hence, every $1 DY puts to work rotates back ~$2 in sales.
These are tremendous economic characteristics. It shows that:
- The rate of return on DY's new investments is currently higher than its 'legacy' capital;
- The more capital DY puts at risk to grow the business, the more incremental profitability and cash flows it is throwing off.
These features cannot be beaten for investors chasing capital compounders in my view.
BIG Insights
3. Valuation
The stock sells at 15x forward earnings and ~12.5x forward EBIT as I write. Both are discounts to the sector, 12% and 18%, respectively. The market has valued its net assets with $2.80 in market value for every $1 in NAV, and you're getting 7.5% forward cash flow yield buying DY today.
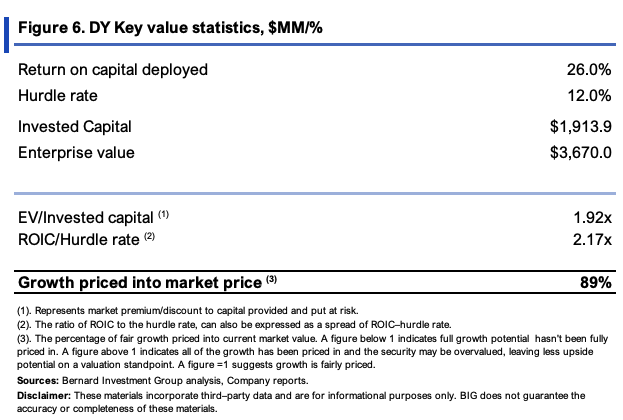
The question immediately turns to whether the market has accurately reflected DY's earnings power at these compressed multiples. You'll note in Figure 6 that investors have priced DY at just 1.92x its invested capital on an EV of $3.67Bn as I write. But this is the expectation on its 'legacy capital'; not the incremental commitments discussed earlier.
Comparing the EV/IC to the ratio of its returns on capital and the 12% hurdle rate outlined, it would appear investors have only priced in ~90% of the growth upside DY can produce going forward. Both ratios show returns on DY's capital—one shows business returns, the other, market returns. Market values are a set of discounted expectations, so comparing the two is a reasonable proxy to check what's priced in and not.
BIG Insights
Also, consider that DY currently sells at 16.2x NOPAT, seeing it priced at $3.67Bn in the market (3,670/226.5 = 16.2). The growth on new capital was 26% last period, and carrying this forward gets you to $285.4mm in NOPAT. Assuming the same 16.2x multiple, this suggests it should trade at ~$4.62Bn (285.4x16.2 = 4,623).
Finally, a firm can compound its intrinsic value at the function of its returns on capital and what amount it reinvests at these rates.
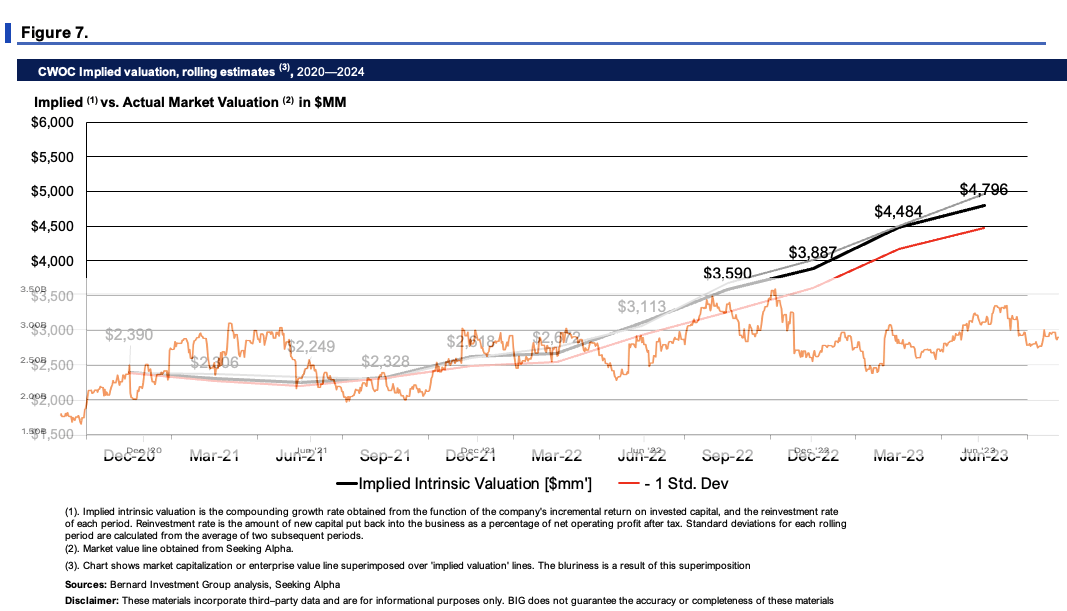
That in mind, the divergence in price to implied value is clearly observed in Figure 7. Up until late 2022, the market was an 'accurate' judge of fair value. But in my view, investors have under-reflected the company's economic leverage on capital deployed in the last 9 months or so. The model spits out an implied value of $4.76Bn or $163/share, a value gap of 67% at the current market price. This isn't far off the $4.6Bn outlined above.
Critically, these are based on actual results, and not forecasts made out ahead. Hence, it shows the gap in market expectations (the equity line) to implied intrinsic value from DY's value creation to date. This supports a buy rating in my view.
BIG Insights
Conclusion
In short, there are multiple inflection points that have me constructive on DY as an addition to the long account. Contract revenue growth, margin decompression, both falling to the bottom line. More importantly, it's the economic leverage on new capital deployed that is most accretive to shareholder value in my opinion. The company is reinvesting plenty of cash back into the business at very attractive rates of return, compounding its intrinsic valuation in doing so. This gap between price and perceived value opens up the investment case with an asymmetrical risk/reward profile. Net-net, rate buy at $163/share valuation.
This article was written by

Analyst’s Disclosure: I/we have a beneficial long position in the shares of DY either through stock ownership, options, or other derivatives. I wrote this article myself, and it expresses my own opinions. I am not receiving compensation for it (other than from Seeking Alpha). I have no business relationship with any company whose stock is mentioned in this article.
Seeking Alpha's Disclosure: Past performance is no guarantee of future results. No recommendation or advice is being given as to whether any investment is suitable for a particular investor. Any views or opinions expressed above may not reflect those of Seeking Alpha as a whole. Seeking Alpha is not a licensed securities dealer, broker or US investment adviser or investment bank. Our analysts are third party authors that include both professional investors and individual investors who may not be licensed or certified by any institute or regulatory body.