SPY And S&P 500: Big Short 2? Path To 3,000 Easier Than It Seems

Summary
- 5 months ago, when the S&P 500 was about 4,100, I wrote that I could see a path to both 4,500 and 3,000 during 2023. The first has occurred.
- A combination of economic and fundamental market developments, as well as my proprietary market reward/risk assessment tools, indicate that 3,000 is not off the table.
- Consistently assessing reward and risk from multiple angles is crucial. Here's how I do it and how it leads me to prioritize risk-management over seeking big rewards right now.
ultramarinfoto/E+ via Getty Images
SPDR S&P 500 ETF Trust (NYSEARCA:SPY) is the oldest US-based ETF, which started trading back in 1993. It is also the largest, at over $400 billion in assets. It simply seeks to track the S&P 500 Index, which has become the most popular benchmark to track the US stock market. While the index certainly has some flaws in its construction, allowing a small number of giant companies to dominate, which leaves owners holding yesterday's winners, it's hard to fight city hall here. SPY is "the stock market" to many investors.
The existence of SPY has been a blessing to market strategists like me, who can essentially monitor the S&P 500 Index, run data analysis, etc. using SPY, which is more readily-available in ETF databases, as opposed to the "old days" when one had to pay dearly to buy data on stock indexes.
I've been investing professionally in ETFs since around the time SPY was issued 30 years ago, and so I track it as closely, and use it in my own portfolio in a variety of ways. At any point in time, I may own it outright, I may own the ETF that essentially shorts it, and I will own SPY call options, put options or both, at various expiration dates and strike prices. I also track a database of 100 ETFs that all "descend" from SPY, in that they represent a sub-segment of that index: a sector (e.g. technology or healthcare) and industry (e.g. software or medical devices), tilts on the SPY/S&P 500 such as low volatility, high beta, revenue-tilted and many others. I call it the "Stock Market MRI" because like that medical test, it allows me to slice and dice the S&P 500 picture into 100 different components, to spot where reward and risk is at any point in time.
Suffice it to say, I track the S&P 500 like a hawk. And I currently see it in a potentially vulnerable position, as the threats surrounding the stock market inch closer to translating into price action...in other words, a falling market.
4,500 and 3,000 in the same year? An update
Back on April 5 of this year, with the S&P 500 just under 4,100, I wrote an article that stated that I would not be surprised to see it reach 4,500 and 3,000 during 2023. I'm not predicting 3,000 because I don't predict. I evaluate different scenarios, assign probabilities to them, and make my own investment decisions based on the "weight of the evidence." I'm about 30 years into doing that, so yeah, it's pretty hard-coded by now. But it also means that nothing is certain, and it pains me when I read or hear someone in my industry, or even a self-directed investor, speak with absolute certainty. So with that clear, let's move forward.
We can check the box on the first part of my April 5 article, as the index crossed 4,500 on July 13. And, as markets tend to do, the index powered higher to 4,600. Then stopped abruptly, and made what will either be just another stop on the train to bull-ville, or more likely, the highest point we'll see in that index for a while.
Keep in mind my overriding belief about investing: ANY security or index can go up at any time. The key difference between any one security or market and another is the risk of major loss attached.
S&P 500: 4,600 to 3,000? The odds just got better
And as much of a long shot and daunting proposition that 3,000 level seems, just a few weeks from the final quarter of four months shy of year-end 2023, there is a path to get there. In fact, there are several paths.
And so, while 3,000 is a long way from here, the path to get there, even amid the very recent S&P 500 rally, is still on the table in 2023. Because everything is always on the table. If an investor hasn't learned that over the past few years, they have some catching up to do. As the first chart below shows, we've had three 12-month periods this century where the S&P 500 fell by at least 30%, roughly the distance between early September levels and 3,000. Last year's decline stopped at a 25% max drawdown.

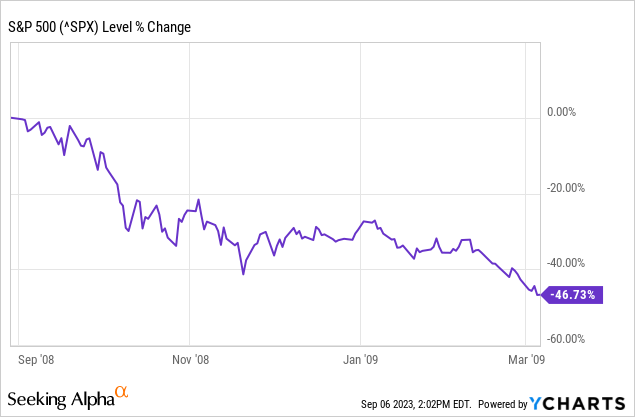
The chart immediately above gets a bit more granular. It shows the path of the S&P 500 from September 1, 2007, through March 6, 2009. Full disclosure: over the Labor Day weekend, I watched the movie "The Big Short" with my wife. We had seen it in the theater when it came out, but given all of the similarities to this time and that, or at least I thought, I wanted to remind myself of what led to that disaster of a market. I sense that while all of today's market participants were alive back in 2007, they were 16 years younger. So, many were at a very different phase of their investing life. If you were 50 then, you were working more than thinking about and participating in stock and bond markets. Today, at age 66, it's a different story.
As I noted above, I was a bit foggy about the specific details and chronology that led to that market condition, which included a 55% decline in the S&P 500, 37% of that in the calendar year 2008. Yes, the S&P 500 fell 37% in one full calendar year. I lived it, because I started managing my first mutual fund on September 14 of that year, essentially the market top. My fund was down a fraction of the market, but I still swore I'd never go through that again. And I haven't, thanks to a risk-management discipline I write about here frequently.
Now that I have seen the movie a second time, then doubled back to re-read a lot of what was going on back then, including my own communications to my investors at the time, I have even greater belief that 3,000 is indeed on the table. Not "guaranteed," but something that should prompt investors to put risk management first.
Why so concerned? It's a long list
What follows is an update on some of the proprietary market reward/risk assessment tools I have developed and have come to trust over three decades of professional investing. Since I've made every mistake and misjudgment in the book, multiple times, my aim is that investors can learn what I did that has been so valuable to me.
The tough but necessary part of investing is to assess reward and risk from many, many angles, and arrive at a conclusion at any point in time that says: "this is how much risk I'm willing to take." Then, I express it as a percentage of the full risk of the S&P 500 Index. I call it the ROAR Score (Reward Opportunity and Risk). And for a while now, it has been much closer to zero than to 100, meaning that I'm not willing to take more than a small fraction of the risk of the S&P 500 in my retirement portfolio.
Now, the details behind that introduction, including a brief re-visiting of that aforementioned April 5 article.
I track and rank (monthly) my top 10 factors that I think are influencing markets. I'm about to update it for my subscribers, but here is what it looked like back in April (top table) and what it looks like as of the most recent report (bottom table). While the items have not changed dramatically during the past five months, I see strong evidence that we are gradually moving toward decision points for a lot of these risk factors.
Rob Isbitts, Sungarden Investment Publishing Rob Isbitts, Sungarden Investment Publishing

In particular (using lower table, the more recent one), #6 is becoming a concern in the form of a banking system that is suffering from a rapid decline in consumer lending, the type that in the past has led to large stock market declines. In other words, the crisis from earlier this year saw one shoe drop, but there's another shoe. It just hasn't dropped yet.
Another one I'll point out is #3. I see way too many data points that make the "soft landing" so many pundits believe in a real possibility. The rest of the globe is already landing hard. China chief among them.
How the market sets up - And puts 3,000 on the radar for a potential S&P 500 drop
For the past 32 months, we've steered through the first year in our lifetime when stocks and bonds fell at the same time, the fastest transition ever from zero yields to solid yields on bonds, essentially making bonds relevant again, and a stock market that been historically narrow.
Bottom line: this has been a good time to be very cautious about where and when to take risk, especially now that 5%-ish can be had for no risk. Many of the indicators I track give me the sense that we are finally getting to the point in the cycle where a lot of the "logjams" will break.
Lots of debt buildup ($1 Trillion in credit card debt now paying 22% interest rates, student loan repayments re-starting, foreign governments and rating agencies concerned about US Congressional spending and impasses (yes, the government could shut down in September), corporate bankruptcies spiking and 2024 a year when many weak corporations have to roll over low rate debt at much higher rates. All the issues are out there. Question is when will the market care?
So the plan continues to be...
1. Lots of cash-equivalents: ETFs that own T-bills, such as BIL, SHV.
2. Using the Treasury yield curve to try to generate some tactical gains. TLT is the ETF that tracks the longest-term US Treasuries, and TBF is its opposite. So investors can consider the former to pursue gains when long-term rates fall, and the latter to pursue gains when long-term rates rise. Learn more about them on their Seeking Alpha profile pages.
3. Identifying & "renting" tactical positions that target segments of stock market. Sectors, industries, themes. Some commodity-related ETFs that look interesting include oil (OILK) and uranium (URA).
4. Being ready to pivot at any moment, to preserve capital and exploit whatever market emotions create opportunity for us.
This article was written by

Analyst’s Disclosure: I/we have a beneficial short position in the shares of SPY either through stock ownership, options, or other derivatives. I wrote this article myself, and it expresses my own opinions. I am not receiving compensation for it (other than from Seeking Alpha). I have no business relationship with any company whose stock is mentioned in this article.
As noted in previous articles, my trading and investing accounts often have put and call options on SPY, as well as tactical positions in related vehicles.
Seeking Alpha's Disclosure: Past performance is no guarantee of future results. No recommendation or advice is being given as to whether any investment is suitable for a particular investor. Any views or opinions expressed above may not reflect those of Seeking Alpha as a whole. Seeking Alpha is not a licensed securities dealer, broker or US investment adviser or investment bank. Our analysts are third party authors that include both professional investors and individual investors who may not be licensed or certified by any institute or regulatory body.