Power Integrations: GaN Market Still Too Small

Summary
- Power Integrations has experienced volatile revenue growth, with an average growth rate of 3.4% over the past 6 years.
- The company's dominant position in the Industrial & Automotive segment has supported its growth, but its other segments have experienced declines.
- The GaN power semiconductor market is projected to grow significantly, but Power Integrations faces competition from larger players such as Navitas and Infineon.
da-kuk
In our assessment of Power Integrations, Inc. (NASDAQ:POWI), we aimed to assess whether the company's dominant presence in the GaN market could enhance its prospects for growth. Our analysis began by examining the company's segment distribution across various end markets to gauge its growth trend. We also highlighted management's growth opportunities and outlook based on its SAM breakdown. Additionally, we conducted a thorough examination of the GaN power semiconductor market, considering its projected growth trajectory and contrasting it with the broader power semiconductor market landscape. Lastly, we delved into an assessment of the competitive landscape to ascertain if Power Integrations could sustain its leading position in the GaN sector and projected its overall revenue growth accordingly.
Volatile Growth But Confident Management Outlook
Revenue Breakdown by Segments ($ mln) | 2017 | 2018 | 2019 | 2020 | 2021 | 2022 | 2023F | Average |
Communications | 103.63 | 83.20 | 109.38 | 146.49 | 210.99 | 136.73 | 128.52 | |
Growth | -19.7% | 31.5% | 33.9% | 44.0% | -35.2% | -6.0% | 8.1% | |
% of revenue | 24% | 20% | 26% | 30% | 30% | 21% | 28% | |
Computer | 21.59 | 20.8 | 21.04 | 34.18 | 70.33 | 65.11 | 64.26 | |
Growth | -3.7% | 1.1% | 62.5% | 105.8% | -7.4% | -1.3% | 26.2% | |
% of revenue | 5% | 5% | 5% | 7% | 10% | 10% | 14% | |
Consumer | 164.08 | 158.08 | 147.25 | 161.14 | 225.06 | 214.86 | 133.11 | |
Growth | -3.7% | -6.9% | 9.4% | 39.7% | -4.5% | -38.0% | -0.7% | |
% of revenue | 38% | 38% | 35% | 33% | 32% | 33% | 29% | |
Industrial & Automotive | 142.49 | 153.92 | 143.04 | 146.49 | 196.92 | 234.40 | 133.11 | |
Growth | 8.0% | -7.1% | 2.4% | 34.4% | 19.0% | -43.2% | 2.3% | |
% of revenue | 33% | 37% | 34% | 30% | 28% | 36% | 29% | |
Total Revenue | 431.8 | 416 | 420.7 | 488.3 | 703.3 | 651.1 | 459 | |
Growth | -3.7% | 1.1% | 16.1% | 44.0% | -7.4% | -29.5% | 3.4% |
Source: Company Data, Khaveen Investments
Based on the table above, we compiled the company's revenue breakdown based on its end market segments from its annual reports in the past 6 years and projected its revenues in 2023 by prorating its H1 2023 results. As seen, the company's revenue growth had been highly volatile with a 6-year average revenue growth of only 3.4%. Its growth rate improved from 2018 each year and accelerated until 2021 which was its strongest performance of 44% growth.
Based on its annual report, the strong performance in 2021 was attributed to the strong overall semicon market, which grew by 26%, and growth across a variety of product applications particularly its Computer segment which saw its revenues more than double.
However, in 2022, its growth slowed down and turned negative as it was weighed down by its Communications and Computer segments which declined by 35.2% and 7.4% respectively. This is as the end markets weakened such as the smartphone market which declined by 11.3% according to the IDC and the PC market declined by 16.5% in 2022.
On the other hand, the company's Industrial & Automotive segment became the largest segment (36% of revenue) and sustained a double-digit growth as management previously highlighted the strong growth of its "high power business". The company also stated from that briefing that it expected its automotive design and design in productions to continue to rise in 2023 following the tripling of its "opportunity pipeline last year in the EV market". However, we prorated its H1 2023 segment growth to decline to -43.2% this year, the largest among its segments. Based on its latest briefing, management stated it has also entered a "cyclical correction" and there are excess inventories among its segment's customers. That said, it highlighted a more positive outlook as it stated that it had secured new automotive customers.
A recent Tier-1 design win for emergency power supplies is now ramping with a major European car brand and we have significant follow-on design activity at the same Tier-1 customer. Two Chinese customers are beginning production with us in Q3 and we expect to be in production with a total of four Chinese car models by the end of this year. - Balu Balakrishnan, Chairman & Chief Executive Officer
Power Integrations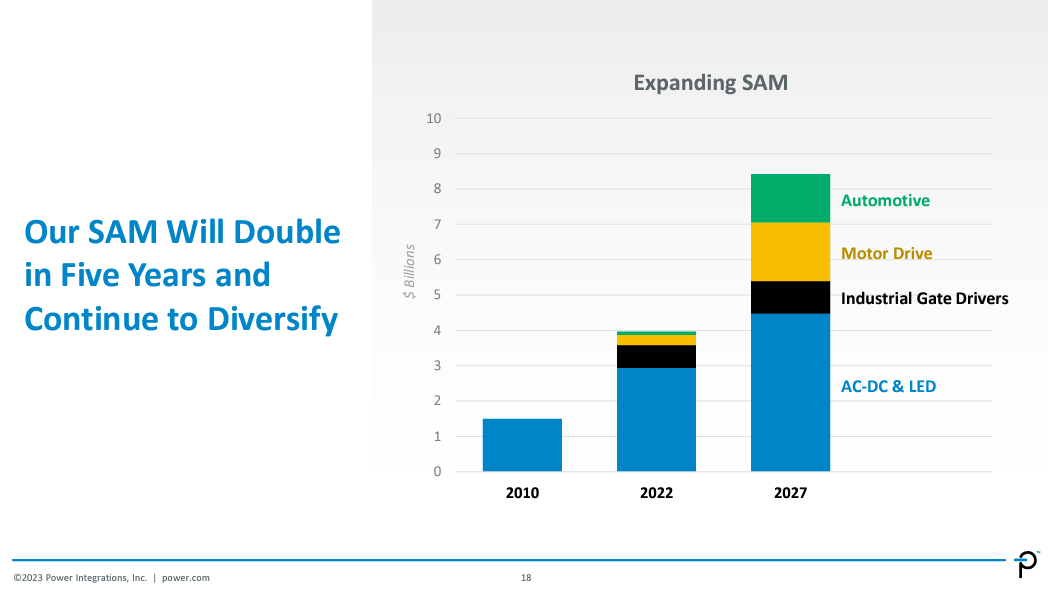
Furthermore, the company's presentation slide above shows that its SAM had expanded significantly in 2022 by 2.7x to $4 bln from 2010. The company expects its SAM to continue rising rapidly to over $8 bln, more than double its 2022 SAM with the AC-DC & LED products as its largest breakdown. Based on its annual report, the company's AC-DC power conversion products belong to all of its 4 segments with...
...an extremely broad range of applications including mobile-device charges, consumer appliances, utility, LCD monitors, main and standby power supplies for desktop computers and TVs, and numerous other consumer and industrial applications.
Additionally, its AC-DC products include its GAN-based InnoSwitch product family.
Therefore, we believe that this highlights the company's strong outlook supported by its AC-DC segment, which is the largest portion of its SAM. According to Mordor Intelligence, some of the growth drivers of the AC-DC market include:
- The rising adoption of the home and building automation solution. The market is projected to grow by a CAGR of 7.1% according to Future Market Insights.
- The expanding capabilities of portable consumer electronics and computing gadgets and the market is projected to grow a CAGR of 9% by Market Research Future.
- The growth in smartphone adoption over the past years is anticipated to support the market outlook, given the widespread use of AC-DC power adapters in smartphones.
GaN Market Still Insignificant Despite High Growth Outlook
Revenue Breakdown ($ mln) | Company Revenue ($ mln) | Revenue Breakdown % | GaN Market ($ mln) | Forecast CAGR | Market Breakdown |
Communications & Computer | 201.8 | 31.0% | 45.1 | 69% | 23.0% |
Consumer | 214.9 | 33.0% | 121.0 | 52% | 61.7% |
Industrial | 231.4 | 35.5% | 13.5 | 45% | 6.9% |
Automotive | 3.0 | 0.5% | 10.4 | 97% | 5.3% |
Others | 0.0 | 0.0% | 6.1 | 23% | 3.1% |
Total | 651.1 | 100.0% | 196.1 | 55% | 100.0% |
Source: Yole Development, Company Data, Khaveen Investments
According to Yole Development, the market size for power GaN devices is projected to grow at a CAGR of 59% from $126 mln in 2021 to $2 bln in 2027. Furthermore, we compared the projected GaN market breakdown and compiled it with the company's revenues by its end market segments in 2022. We estimated its automotive revenue as $3 mln as management previously stated that its automotive revenues were in the "low single-digit millions".
Based on the table, the company's largest segment was Industrial and is over 5 times larger than the market breakdown. On the other hand, we estimated its Automotive revenue only represented 0.5% of its total which pales in comparison with the market breakdown of 5.3% As the Industrial segment has a lower forecast CAGR than the overall market and the company has a relatively higher exposure to compared to the market breakdown, while the Automotive market has the highest CAGR but it has a lower exposure, we believe this is negative to the growth outlook of the company as it has higher exposure to the lower growth market.
GaN-based products offer advantages over silicon-based ones, including higher breakdown voltage for higher voltage operation, faster switching with higher electron mobility, lower on-resistance for handling higher currents, and they are more cost-effective and easier to manufacture compared to SiC-based devices.
GaN Market Forecasts | 2021 | 2022 | 2023F | 2024F | 2025F | 2026F | 2027F |
GaN Market Size ($ mln) | 126 | 200.34 | 318.54 | 506.47 | 805.30 | 1,280.43 | 2,035.88 |
Growth % | 174% | 59% | 59% | 59% | 59% | 59% | 59% |
Total Power Semicon Market ($ bln) | 58.2 | 61.25 | 63.94 | 66.758 | 69.69 | 72.76 | 75.96 |
Growth % | 29% | 5% | 4.40% | 4.40% | 4.40% | 4.40% | 4.40% |
GaN Market as % of Total Power Semicon | 0.2% | 0.3% | 0.5% | 0.8% | 1.2% | 1.8% | 2.7% |
Source: Omdia, Yole Development, Company Data, Straits Research, Markets and Markets, Khaveen Investments
In the table above, we compiled the forecasted power GaN device market by Yole Development through 2027 reaching $2.04 bln at a CAGR of 59%. Furthermore, we calculated the total power semicon market consisting of Power ICs and Power Discrete and Modules markets and forecasted its growth based on the market CAGR of 4.4% by Yole Development, reaching $75.96 bln by 2027. Therefore, we calculated the power GaN devices market as a % of the total power semicon at only 0.3% in 2022. However, despite the high CAGR of the GaN devices market, we believe that the market would still be insignificant compared to the overall power semicon market where we forecasted GaN devices to reach 2.7% of the total market. Moreover, 1% of the projected GaN market size of $2.04 bln by 2027 is $20.4 mln and only 3% of Power Integrations' 2022 revenue.
Competitive Threats From Large Competitors
Furthermore, we then examined Power Integrations' market positioning by analyzing its market share and determining whether it could maintain its competitiveness against key competitors.
Gan Power Devices Market Share | 2020 | 2021 |
Power Integrations | 27% | 24% |
Navitas (NVTS) | 26% | 29% |
Innoscience | 6% | 20% |
EPC | 21% | 14% |
Transphorm | 8% | 6% |
Infineon (OTCQX:IFNNY) | 5% | 3% |
GaN Systems | 6% | 3% |
Other | 1% | 1% |
Total | 100% | 100% |
Source: TrendForce, Khaveen Investments
According to TrendForce, Power Integrations had the highest market share in 2020 at 29% but was estimated to have decreased to 24% in 202 due to strong competition from Navitas and Innoscience. Moreover, Navitas was estimated to overtake the market leader position from Power Integrations at around 29% in 2021. In 2019, Navitas won the Global Technology Innovation Award for its proprietary GaNFast products and launched its third-gen GaN products featuring its GaNSense technology in 2021. For Innoscience with the largest share increase, the company expanded its large GaN fab in 2021 and claimed to have "an estimated output value of 15 billion RMB per year" ($2 bln) by the end of 2022. Overall, the GaN power devices market is highly concentrated with the top 4 companies having a combined share of 87% in 2021.
Navitas was the first mover as it announced the world's first SiC power ICs in 2016 but Power Integrations followed with the launch of its InnoSwitch GaN products in 2017. However, according to Yole Development, Power Integrations...
...entered the power GaN IP landscape in 2010 with the acquisition of Velox Semiconductor and its patents on Schottky diodes, D-mode transistors and packaging for GaN semiconductor devices.
Since then, Power Integrations has expanded its power GaN IP with...
more than 35 patent families or inventions related to GaN power electronics, including more than 60 issued patents and 50 pending patent applications worldwide.
Additionally, the company has been increasing its GaN market presence by expanding its IP portfolio internationally
...to the other key GaN power market areas, Japan, China and Europe.
Though, based on its annual report, China was its largest geographic segment (55% of revenues) and grew by 16% from 2020 to 2022 whereas both its Japan and Germany revenue had doubled in the past 3 years in 2022 but was only 6% and 8% of total revenue respectively.
Additionally, Power Integrations offers GaN-related products with proprietary EcoSmart technology, allowing for the creation of high-efficiency power supplies with minimal standby power consumption. Recently, Power Integrations developed its internal GaN technology named PowiGaN technology which claims to "replace the traditional silicon transistors on the primary side of PI's highly integrated offline flyback switcher ICs, reducing switching losses and enabling chargers, adapters and open frame power supplies that are more efficient, smaller and lighter than silicon alternatives".
Companies | GaN Products Maximum Voltage ('V') |
Power Integrations | 900V |
Navitas | 650V |
Innoscience | 650V |
Infineon | 600V |
Texas Instruments (TXN) | 900V |
Transphorm | 900V |
EPC | 350V |
Source: Company Data, Khaveen Investments
To compare whether the company could have a performance advantage over competitors in GaN, we compiled the maximum voltage rating of their GaN chips. As seen in the table, Power Integrations, Navitas and Texas Instruments are both tied with the voltage of 900V. This is followed by Navitas and Innoscience with 650V solutions as well as Infineon with 600V while EPC is last with 350V. According to the company, its 900V GaN offers "higher power and increased design margin", making it ideal for electric vehicles using a 400-volt bus system. However, we believe Power Integrations does not have a significant performance advantage for its GaN portfolio based on its product maximum volt capability as other competitors like Transphorm and Texas Instruments also have 900V solutions.
Furthermore, in 2022, Infineon announced a EUR 2 bln fab expansion in Kulim's Frontend Fab Capacity and anticipates an additional annual revenue of EUR 2 bln from SiC and GaN products when the facility is fully operational. In comparison, Power Integrations capex in 2022 was only $39.2 mln which is 56 times smaller than Infineon's investments, which highlights the strong competitive threat to Power Integrations.
Overall, we believe that despite the company's strong market positioning in the power GaN device market, the company faces stiff competition from two major players in the market such as Navitas and Infineon that could potentially disrupt Power Integrations' GaN market share going forward.
Power Integrations Revenue Forecast ($ mln) | 2021 | 2022 | 2023F | 2024F | 2025F | 2026F | 2027F |
Estimated GaN Related Revenue | 30.2 | 48.1 | 71.4 | 110.7 | 171.6 | 265.9 | 412.1 |
Growth % | 143.5% | 59.0% | 55.0% | 55.0% | 55.0% | 55.0% | 55.0% |
Non-GaN Related Revenue | 673.1 | 603.0 | 387.6 | 404.6 | 422.4 | 441.0 | 460.4 |
Growth % | 41.4% | -10.4% | -35.9% | 4.40% | 4.40% | 4.40% | 4.40% |
Total Revenue | 703.3 | 651.1 | 459.0 | 515.3 | 594.0 | 707 | 873 |
Growth % | 44.0% | -7.4% | -29.5% | 12.3% | 15.3% | 19.0% | 23.4% |
Source: Company Data, Yole Development, Khaveen Investments
We projected the company's revenues by estimating its GaN revenues in 2022 based on the projected market size of GaN power devices by Yole Development multiplied by our estimated market share of the company in 2022. To project its GaN revenue growth, we calculated a weighted average growth rate based on the company's segment revenue breakdown and the GaN market forecast CAGR by end markets at 55% which is lower compared to the market forecast CAGR of 59%. We believe this is appropriate given the intensifying competitive outlook. Moreover, we calculated its non-GaN revenue in 2023 from its prorated H1 2023 revenues and applied the power semicon market CAGR of 4.4%. Overall, we forecasted the company's forward average growth at 8.1% and 17.5% excluding 2023 which is still much lower compared to the GaN market forecast CAGR of 59% as we believe its GaN revenue represents only a minor portion of revenues in 2023 (16%) before rising to 47% of revenue by 2027.
Risk: Tiny Player Compared To Wider Power Semicon Market
We believe one of the risks for the company is potentially fierce competition from larger players in the power semiconductor market, with the top five companies holding 90% of the market share based on our compilation of data from Infineon and Omdia. Infineon is a notable competitor, aggressively expanding in GaN technology, and other companies like Transphorm are also catching up by producing similar 900V GaN FETs to Power Integrations' flagship products.
Omdia, Khaveen Investments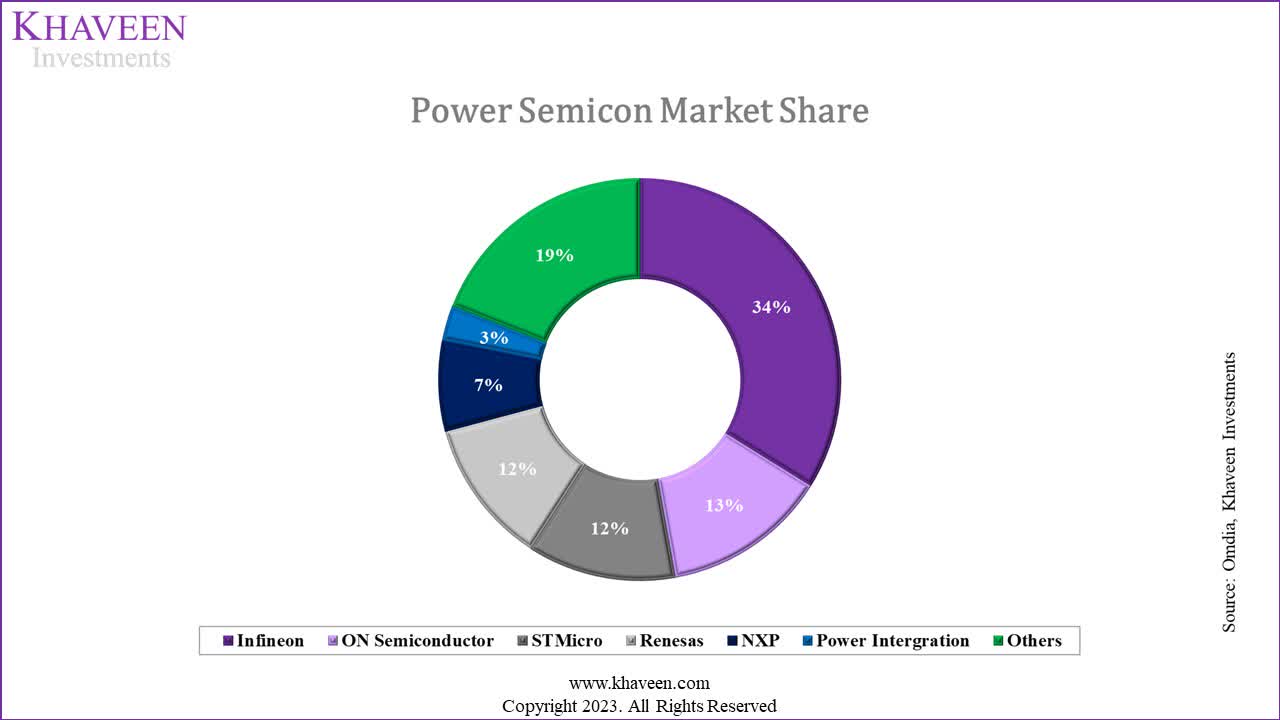
Verdict
All in all, we analyzed the company's past historical growth which had been volatile. Notwithstanding, management highlighted a positive growth outlook as it guided its SAM to double to over $8 bln by 2027, particularly driven by its AC-DC products featuring GaN power devices. However, we should note that while the GaN devices market is projected to experience a high CAGR, we expect it to remain relatively small compared to the overall power semiconductor market, comprising only 2.7% by our estimates.
In terms of competition, we recognize that the company faces significant challenges from major players such as Navitas and Infineon, which could potentially disrupt its share of the GaN market. We anticipate the company's GaN revenue growth by considering a weighted average growth rate based on segment revenue breakdown and a 55% CAGR forecast for the GaN market by end markets. Furthermore, we have calculated the company's non-GaN revenue in 2023 based on prorated H1 2023 revenues and applied a 4.4% CAGR for the power semiconductor market. In total, we projected the company's average forward growth rate to be 8.1%, which is slightly lower by 1.9% than its past 5-year average growth rate of 10%. Based on analyst consensus, the company has an average price target of $90.33, which is an upside of only 8.11%. Furthermore, the company has a P/E ratio of 43.29x which is 2.2x higher than the sector median of 19.87x, thus we rate it as a Hold.
This article was written by

Analyst’s Disclosure: I/we have a beneficial long position in the shares of POWI either through stock ownership, options, or other derivatives. I wrote this article myself, and it expresses my own opinions. I am not receiving compensation for it (other than from Seeking Alpha). I have no business relationship with any company whose stock is mentioned in this article.
No information in this publication is intended as investment, tax, accounting, or legal advice, or as an offer/solicitation to sell or buy. Material provided in this publication is for educational purposes only, and was prepared from sources and data believed to be reliable, but we do not guarantee its accuracy or completeness.
Seeking Alpha's Disclosure: Past performance is no guarantee of future results. No recommendation or advice is being given as to whether any investment is suitable for a particular investor. Any views or opinions expressed above may not reflect those of Seeking Alpha as a whole. Seeking Alpha is not a licensed securities dealer, broker or US investment adviser or investment bank. Our analysts are third party authors that include both professional investors and individual investors who may not be licensed or certified by any institute or regulatory body.