Riding The Rails Of Profit: CSX Between Strong Tailwinds And Unsustainable Buybacks

Summary
- Using Warren Buffett's criteria, we take a deep dive into CSX financials to assess its performance in the past decade.
- Railroads are, in fact, slow moving businesses and need to be understood over a long period of time.
- We will see why CSX shows a mixed picture, though being one of the most promising bets in the market.
traveler1116
Introduction
CSX Corporation (NASDAQ:CSX) was still lacking an in-depth coverage as part of the "Riding The Rails Of Profit" series I am writing on Seeking Alpha. The goal is to understand how Warren Buffett chose to invest in BNSF and use the same criteria to assess the other 5 publicly traded Class 1 railroads. In case you haven't read the foundational article of the series, I recommend doing so to understand what we are doing ("Learning From Buffett And Berkshire About Investing In Railroads: The BNSF Case Study").
In this article, we will review together the main financials of the past decade to zoom out from the quarterly reports and understand the main trends undergoing with CSX.
Railroads' operations, in fact, need time to show how they are handled and where they are headed towards.
Summary of previous coverage
When I first started covering CSX, I rated it as the better play among the East Coast duopoly it shares with Norfolk Southern (NSC). In fact, it had a better operating ratio (55.4% vs. 60.1%), with much better fuel efficiency than its main competitor. Secondly, it had an earning power (pre-tax earnings over interest expense) of 6.2, in line with Norfolk Southern. In addition, it seemed to be paying down its debt more than raising it to fund new buybacks.
In terms of ROIC, it was performing better than Norfolk (15.4% vs. 14%). In terms of free cash flow generation, the stock seemed a bit undervalued. Since then, CSX stock has grown by 9.31%, underperforming the S&P500 just like every other railroad this year.
However, after the company reported its Q3 2022 earnings report, I was a bit surprised. The company reported what seemed to be a very good quarter. But when I scrutinized the new financials under the lens of what I have tried to learn from Mr. Buffett, I saw a true divergence between traditional metrics and "Buffett metrics". The only improving metric was earning power, while efficiency and ROIC decreased significantly.
It took just another quarter to see how the company was spending billions on buybacks not supported by FCF. This led to very good EPS growth, but, at the same time, it forced the company to issue $2 billion of LT debt. In addition, the company spent this money while the stock was trading near ATHs, not creating true value for its shareholders aside from using its good credit rating to borrow money at a lower interest rate compared to the one its shareholders would have to pay in case they borrowed that money individually. I said this was the elephant in the room no one talked about during the earnings call. This is why I downgraded the company from a buy to a hold.
But now, let's zoom out and look at the larger picture, to understand better how the company works.
Operating History
Freight Revenues
We know railroads are always assessed through the lens of operating efficiency. Usually, an operating ratio below 60% is good, while above this threshold investors get worried. The reason is simple. Nowadays, a railroad can't grow that fast through network expansion. Therefore, it needs to become better and better at maximizing the profits it can have through its existing network either through its enhancement or through improving operations management. Top-line growth, though important, is thus not necessarily the most important metric. In fact, even in situations where freight revenue stays flat or decreases due to a cooling economy, a well-operated railroad can still see bottom-line growth.
Let's see how CSX freight revenues have been since 2013.
Author, with data from CSX sec filings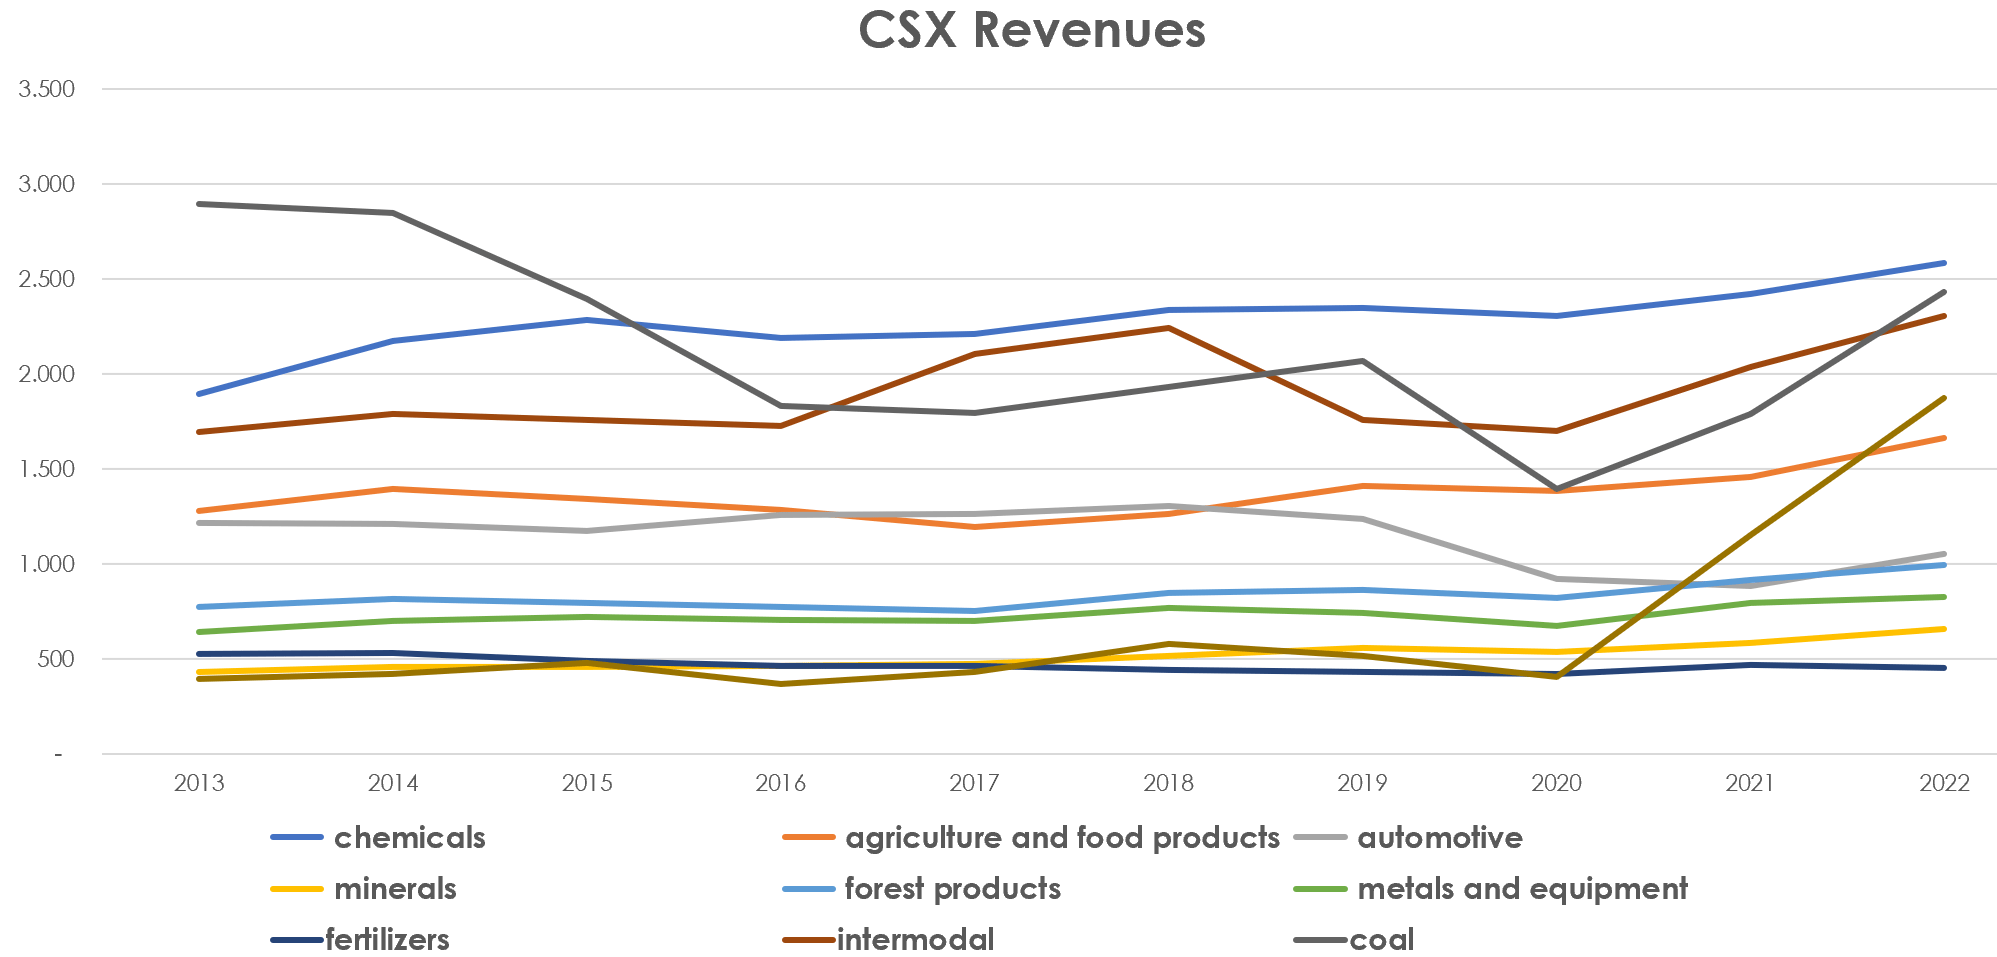
I see here these main facts:
- CSX is exposed to coal. This is a commodity whose freight volumes were decreasing until the energy crisis linked to the war in Ukraine. I doubt that over the long period, coal will keep on going up. In fact, at the end of 2022, coal freight revenues were down 16% compared to 2013.
- Intermodal is highly important. As the manufacturing reshoring takes place, this is set to increase. In the past decade we have seen a 36% growth. Not exceptional, but it bodes well for the next decade where major investments will be deployed.
- The segment that grew the most was minerals (52% in a decade). The need for minerals and rare earths will keep on increasing as we transition to sustainable energy sources.
- Chemicals are a fortress. They just cruise up at a regular pace. It is hard to imagine a world where we need less chemicals, given their importance in every aspect of our life.
- Other sources of revenue spikes up in 2020 (the brown line) because CSX completed the acquisition of Quality Carriers, the leading North American provider of bulk liquid chemicals truck transportation. This extends CSX's reach.
Let's look at CSX freight revenues with the aid of another chart to better understand how the revenue mix evolved.
Author, with data from CSX sec filings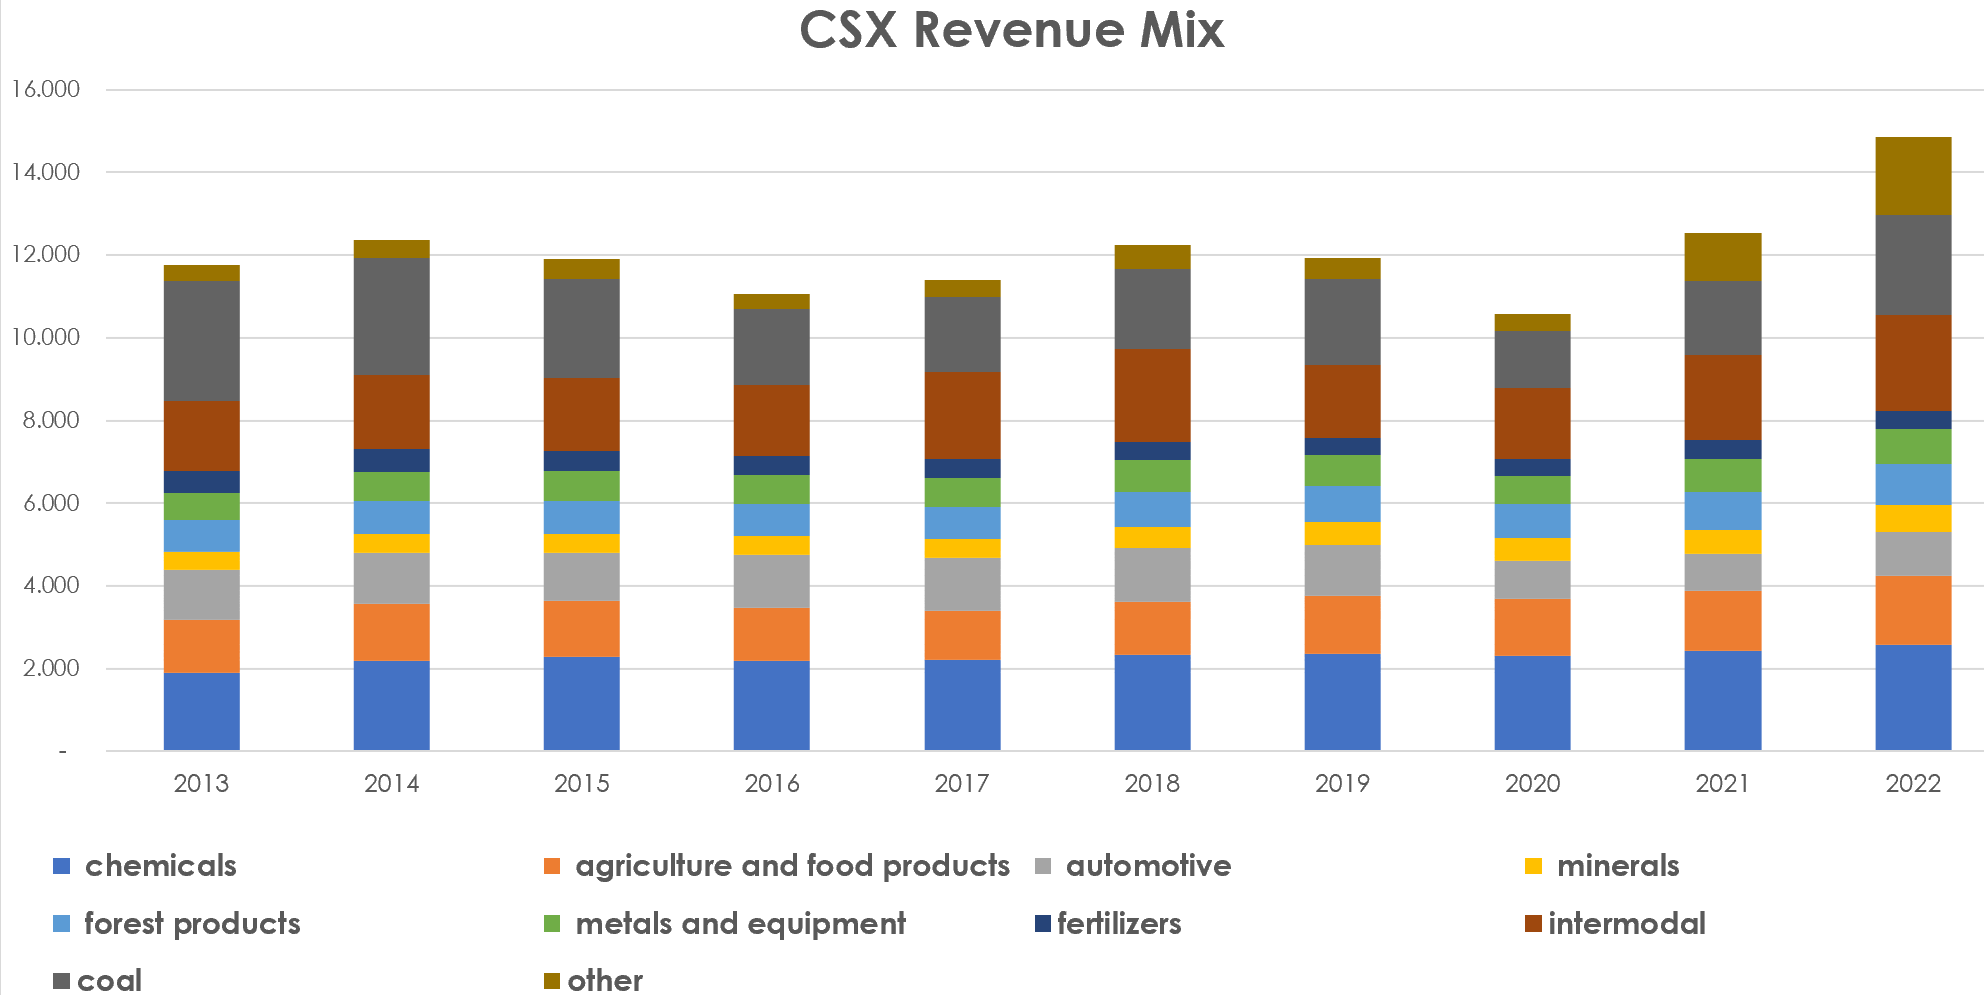
Once again, it is visually clear how coal is decreasing. We can also see how agriculture has been growing up to the point it is the second largest source of revenue within the merchandise category, with an 11% weight on the overall 2022 revenue. Even though this can be impacted by good or bad harvesting seasons, CSX transports goods - such as ethanol, sweeteners and vegetable oils, and grain - whose demand is set to grow.
We can also see from this chart how CSX has not been able to consistently grow its top line, which has remained pretty much flat aside from last year, when the economy was booming. Other railroads such as Canadian National (CNI), perform better under this point of view.
When assessing efficiency, we have to consider the number of carloads and the revenue per carload. This helps us spot if the company is transporting higher-value freight or not. In fact, it takes only a quick look at any quarterly report to see how there is a big difference between different sources of freight. For example, in 2022 chemicals revenue per carload was $4,031 while intermodal's was only $778. Agricultural and food products, forest products and coal all have a revenue per unit around $3,500 while minerals are just below $2,000.
Author, with data from CSX sec filings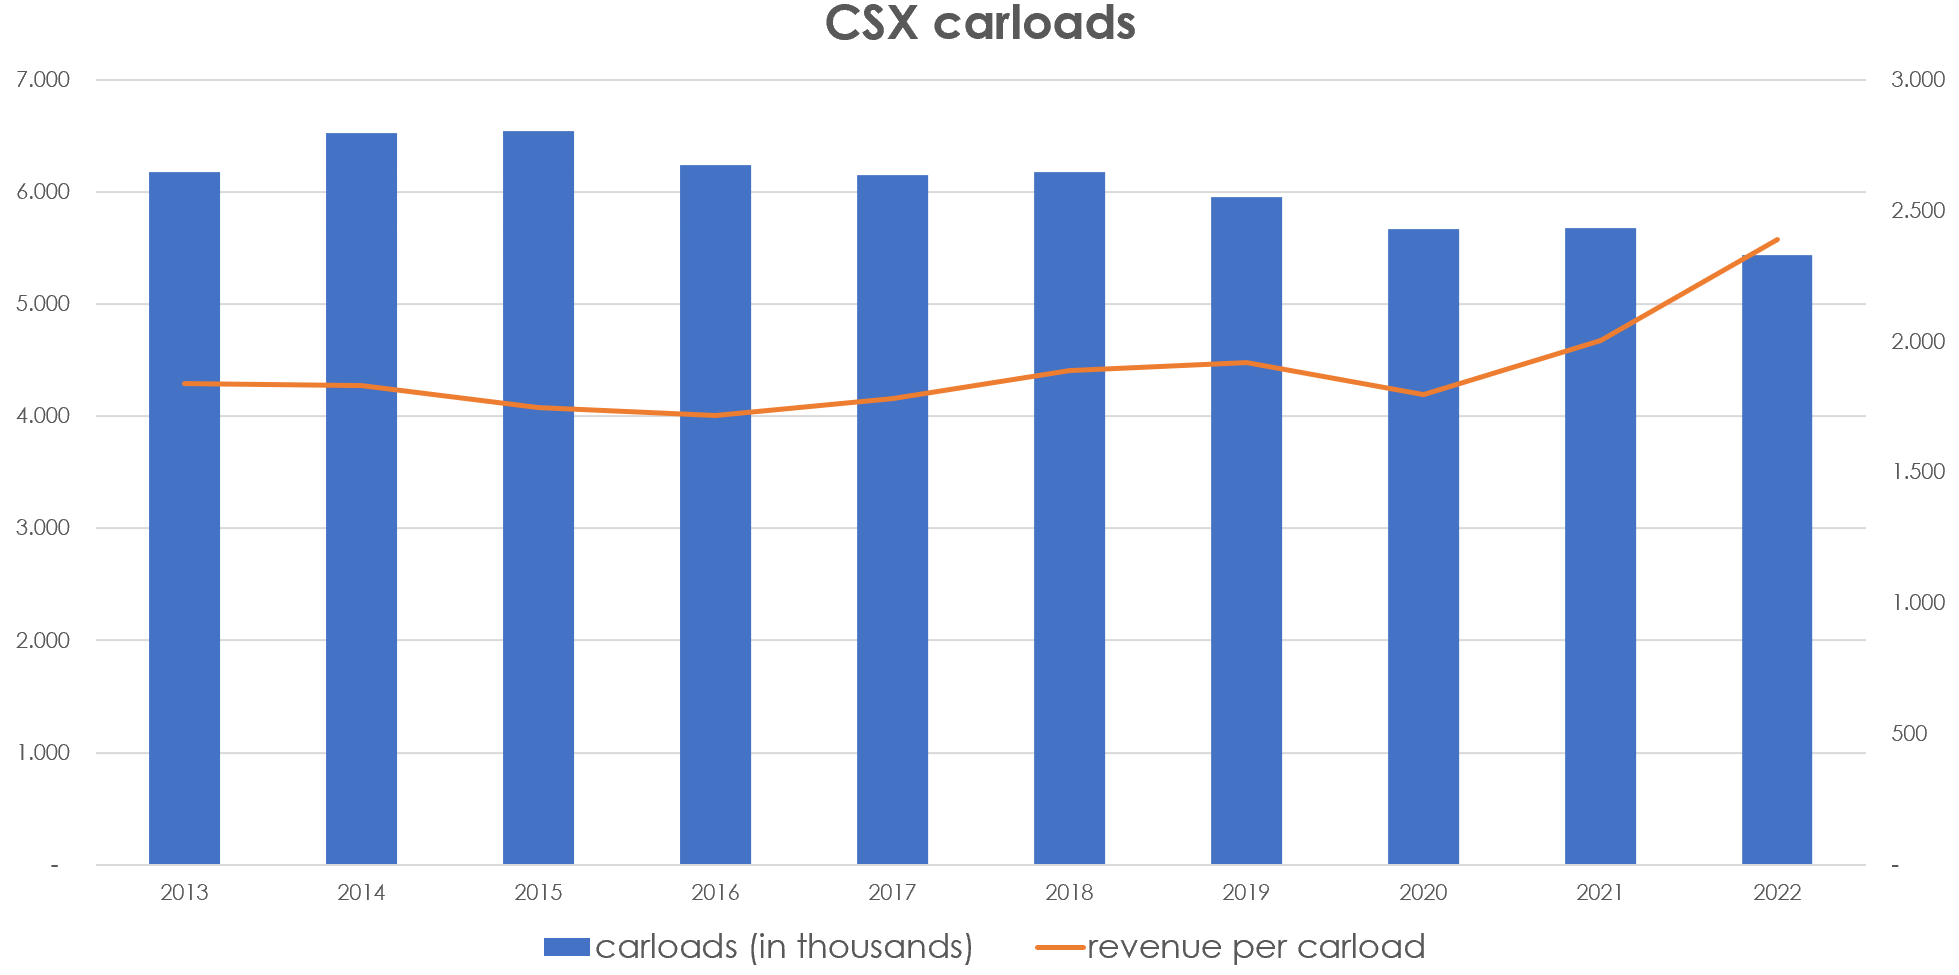
If we look at the graph, we actually see how CSX, though it has had almost no top-line growth and has actually transported less carloads (from more than 6 million to about 5.5 million), has indeed been able to grow its revenue per carload from $1,839 in 2013 to $ 2,389 at the end of 2022. This is a nice 30% growth in a decade.
Operating Expenses
So far, we looked at how CSX builds its top line. To assess its efficiency we have to know how much of its revenue is used to finance its opex.
As many probably know, when considering opex, railroads have 4 major expenses: labor, purchased services, fuel, and D&A. There is also a fifth item - equipment and other rents - that is usually a little bit less meaningful.
CSX 2022 Annual Report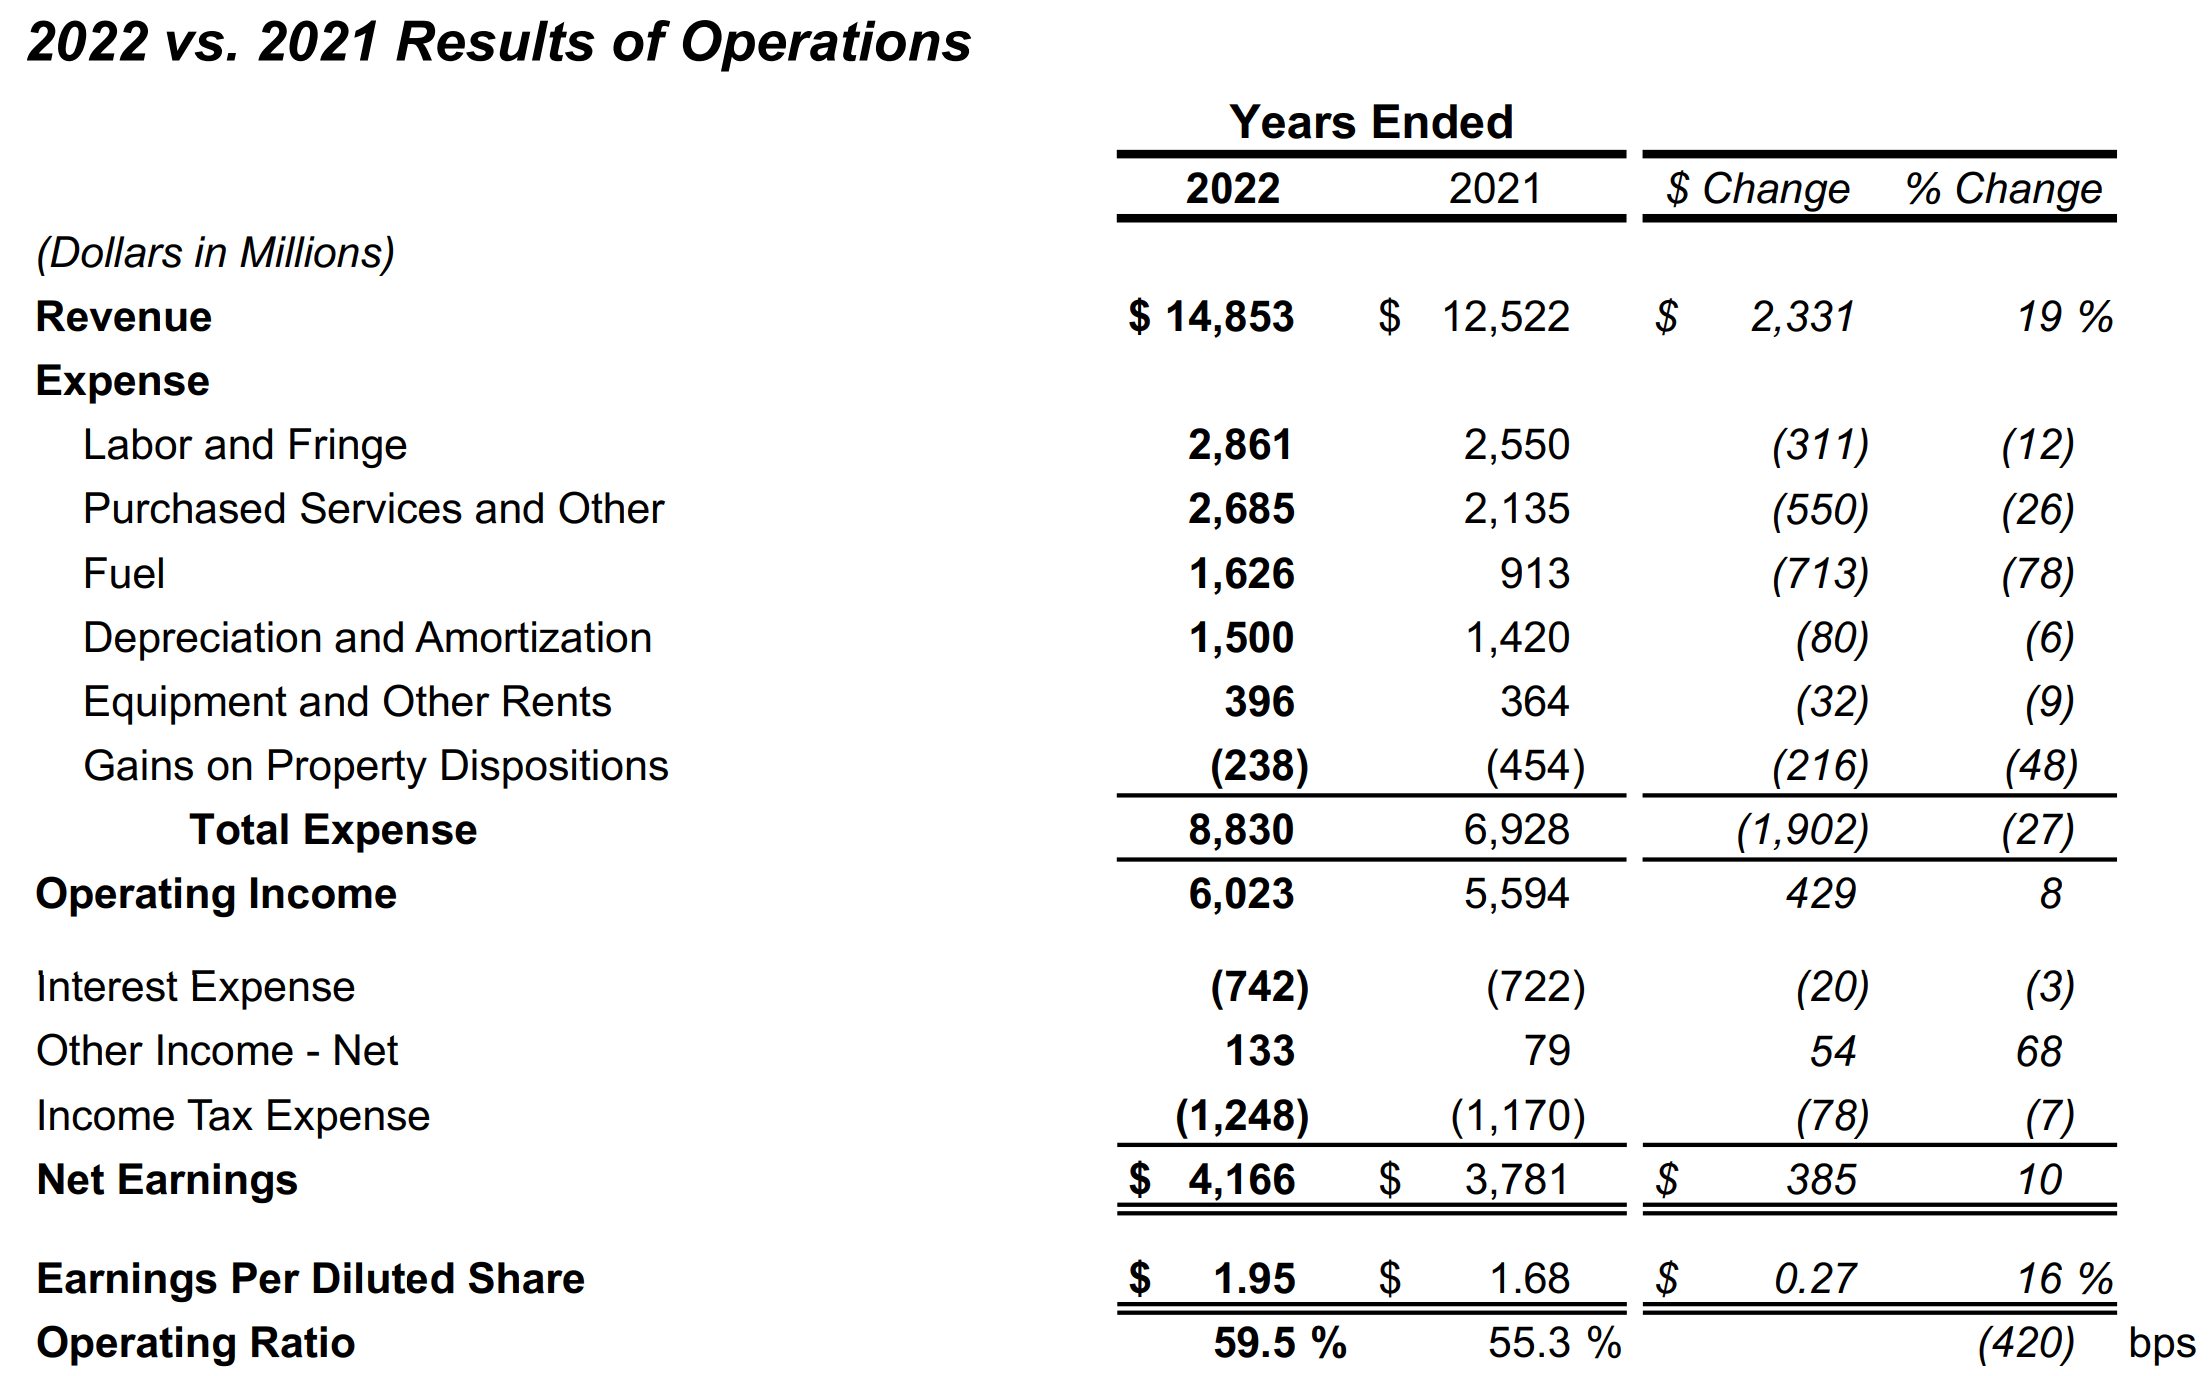
When we look at opex, we have to be aware of a major shift in the industry. Since the adoption of PSR, most railroads have seen a significant drop in headcount. Only after the pandemic, most railroads have found themselves with not enough workers and have started to take action to hire and train new employees. In 2013, CSX had 31,254 employees; at the end of 2020, the workforce was at 19,300. Now, it is being increased once more and at the end of 2022, the company had 22,500 employees. Another 200 have been added in the first six months of this year. These numbers are important because we have to see if, at least, the expense for labor has been reduced accordingly.
In 2013, the company paid for labor and fringe benefits a total of $3.14 billion. At the end of 2022, this was down to $2.86 billion. Employees have been reduced by 28%. At the same time, labor expense has been reduced by 9%. This makes sense: on one side, pay per employee has increased both because of wage inflation and increased productivity. Overall, labor and fringe benefits make up 19.2% of total revenues. It is not the best metric across the industry, but as long as it says below 20% we can consider it acceptable. At the end of Q2 2023, the labor/revenue ratio increased a bit and it stands now at 19.8% ($1.46 billion / $7.4 billion). We will have to see how CSX ends its fiscal year to give a full assessment of this ratio.
Going to fuel, clearly, 2022 was an exceptional year (though with these kinds of commodities price swings must be factored in) and CSX had to pay 78% more YoY. However, railroads have fuel surcharge programs that usually are triggered with a 60-day lag. This means that as fuel prices skyrocket, at first the company's margins take a hit, but within two months the railroad has a program able to offset this. When prices decrease, the company has at least 2 extra months with very high margins. When fuel surcharges are triggered, a railroad sees significant top-line growth, but not necessarily margin expansion. When fuel prices come down, a railroad may see top-line stagnation or even reduction, while seeing margin expansion.
At the end of the first six months of 2023, fuel expense is down 30% YoY for Q2 and down 13% for 1H. Fuel surcharges are moderating and this will have an impact on revenue growth. In fact, while the six months comparison sees a surcharge revenue of $656 million for 1H 2023 vs. $635 million of the prior year; Q2 2023 reported a $295 million of surcharge revenue compared to the $395 million of the same quarter in the previous year.
At the moment, CSX is actually in a tough spot, as it reported both a 3% revenue decrease, a 5% opex increase, a 13% reduction of operating income and, thus, a deteriorated operating ratio at 59.9% for the quarter and 60.2% for the 1H 2023 (versus 55.4% for Q2 2022 and 58.7% for 1H 2022).
Overall, since 2013, CSX has been able to generate $43.2 billion of operating income, which is 70% of the current market cap.
Balance Sheet History
Let's now move to the balance sheet and look at the company's capital structure. We will look at it through some charts that can help us visualize what we are talking about.
If we look at the chart below, it is no surprise to see how property and equipment has the lion's share of a railroad's assets.
Author, with data from CSX Annual Reports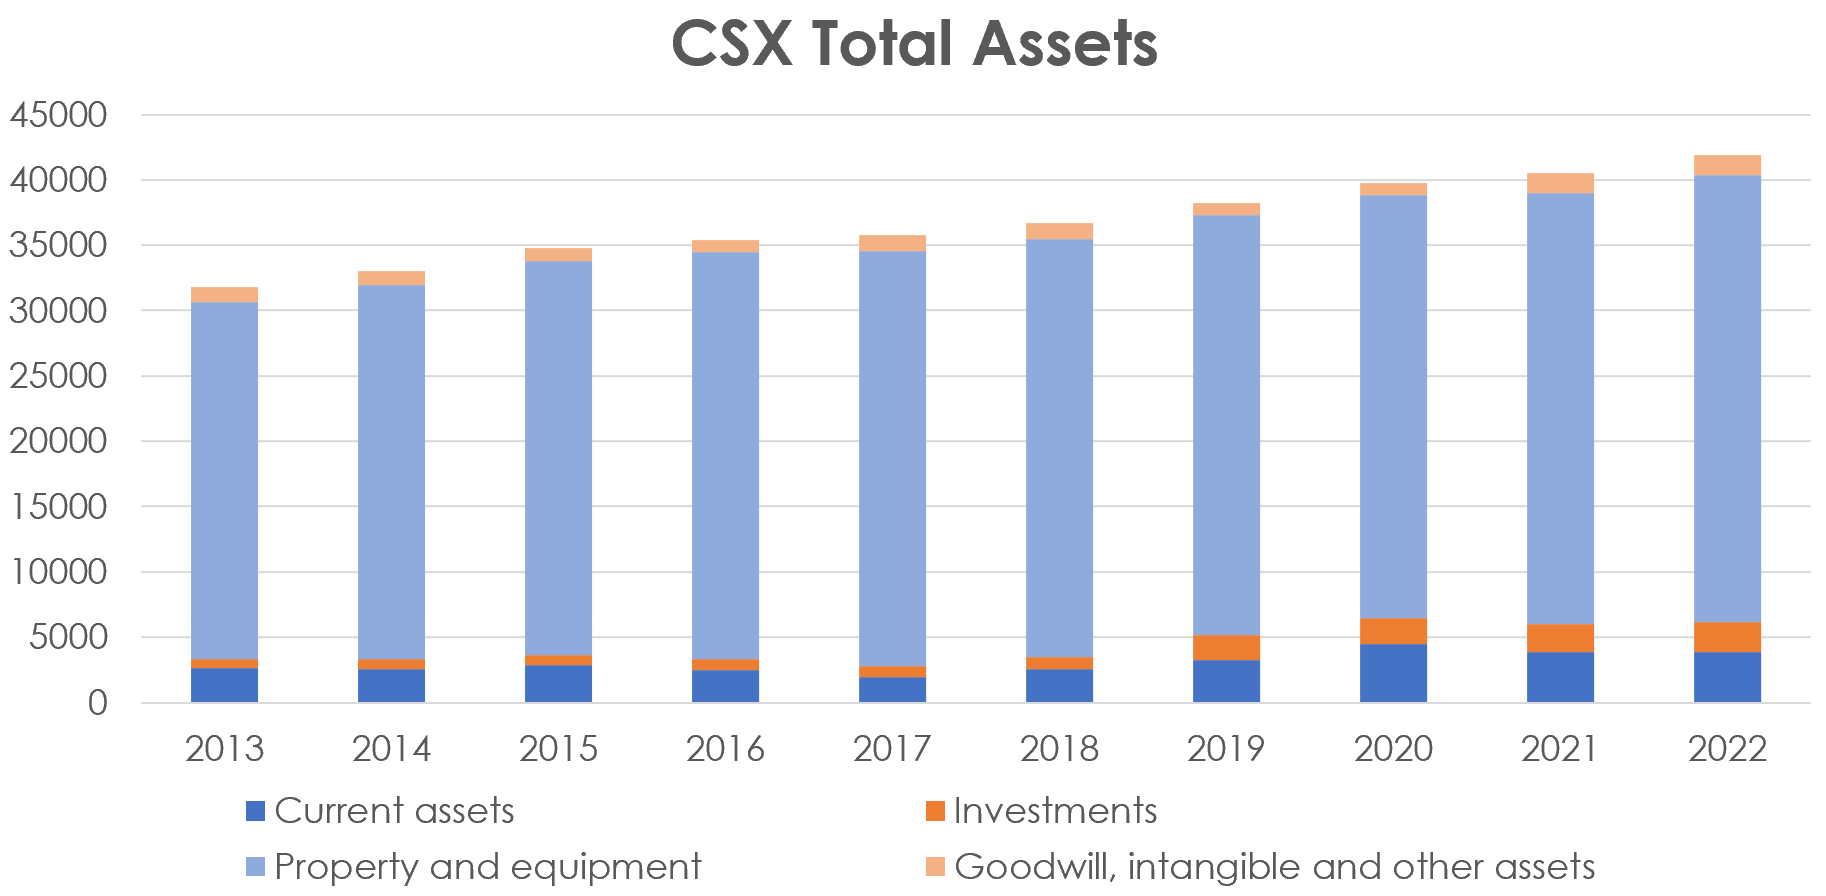
After all, railroads capital intensive and need costly infrastructure alongside locomotive and freight cars. Since 2013, CSX has seen its assets grow, with property and equipment moving up from $27.3 billion to $34.2 billion, a 25% increase. This is not as meaningful as other railroads, such as Canadian National. It can mean that CSX didn't spend as much as other in renewing its equipment.
Let's look at the other side of the balance sheet: liabilities and equity. It helps us understand how the company financed its increase in assets.
If we look below, we see how the company's LT debt increased from $9 billion in 2013 to $17.9 billion at the end of last year. Clearly, this growth is much faster than what we have seen in property and equipment. This shows under another perspective what I said at the beginning: the company's taking more debt than the one it needs to fund its capex.
Author, with data from CSX Annual Reports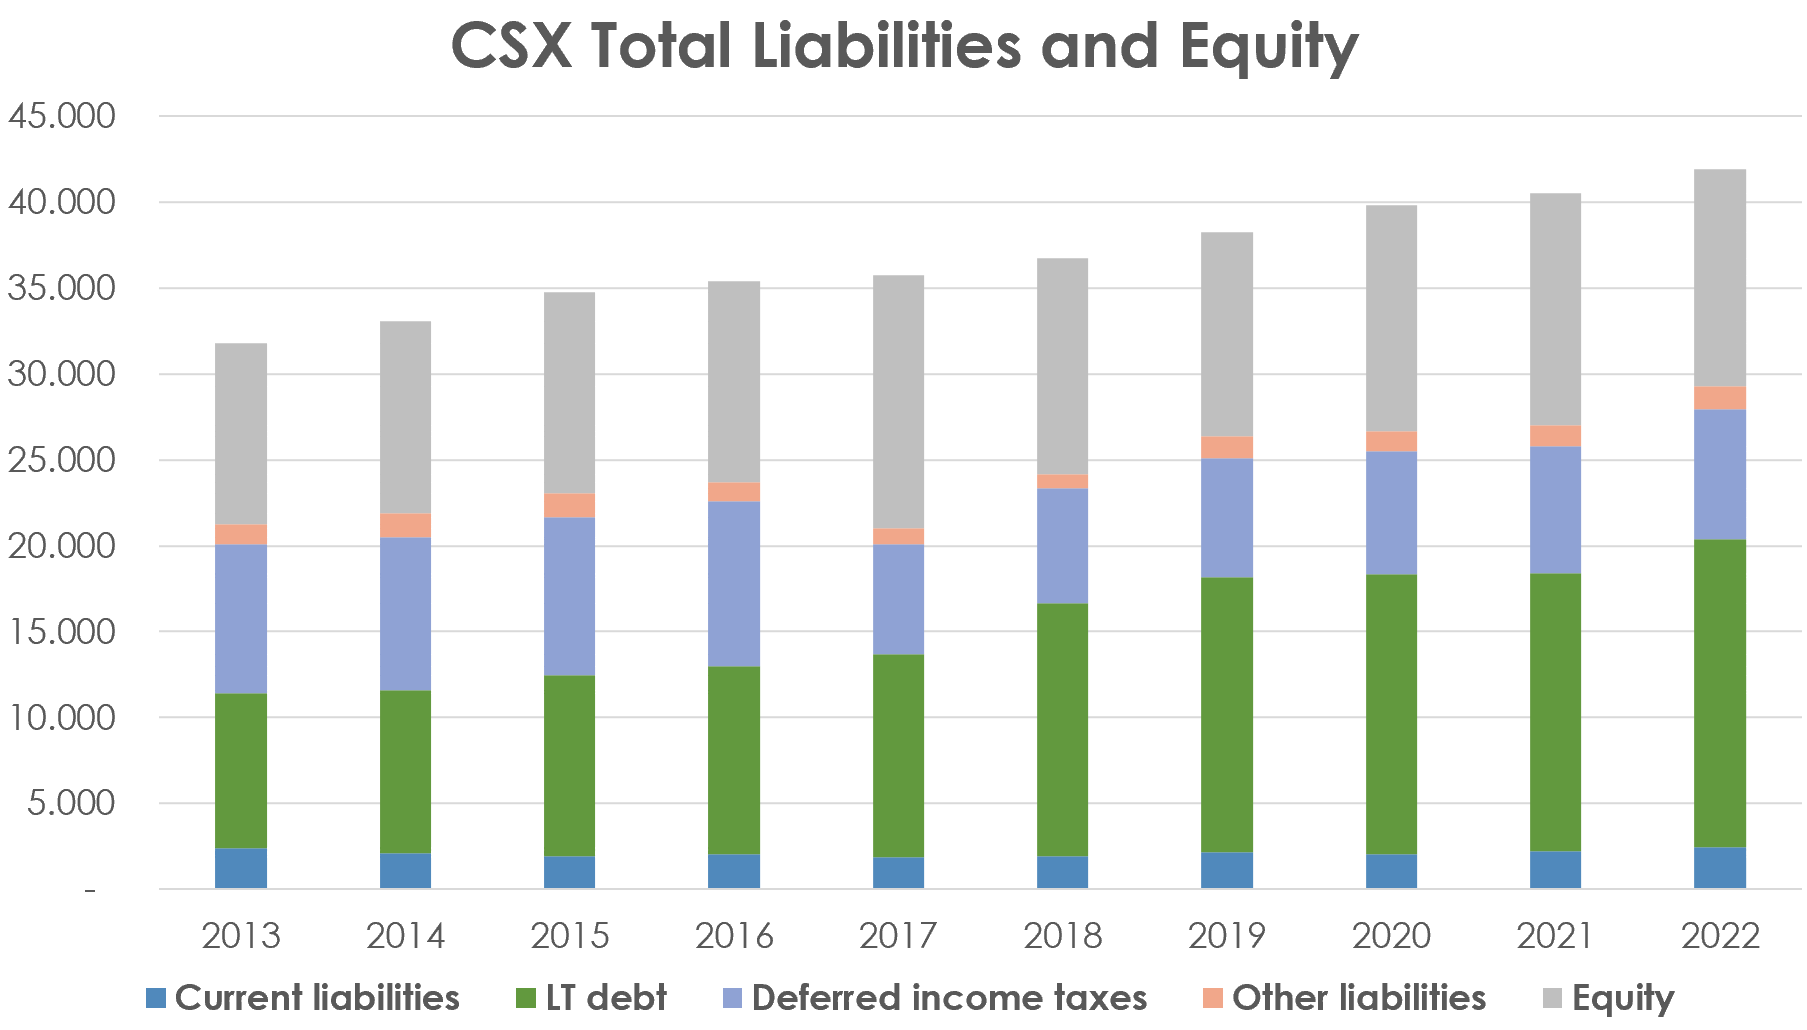
Currently, CSX has an LT debt/operating income ratio at 3.2. In 2013 it was at 2.8. So, the company hasn't excessively increased this ratio, but usually, the threshold not to be crossed is 3.
Cash Flow History
Let's now look at the company's cash flow statement history. We already found that CSX generated in the past decade $43.2 billion of operating cash. It spent on capex only $20.7 billion. This means there are $22.5 billion of FCF. Through the graph below we see the yellow line showing the company's yearly FCF, always positive and usually growing. Railroads are cash cows, we must admit it.
Author, with data from CSX Annual Reports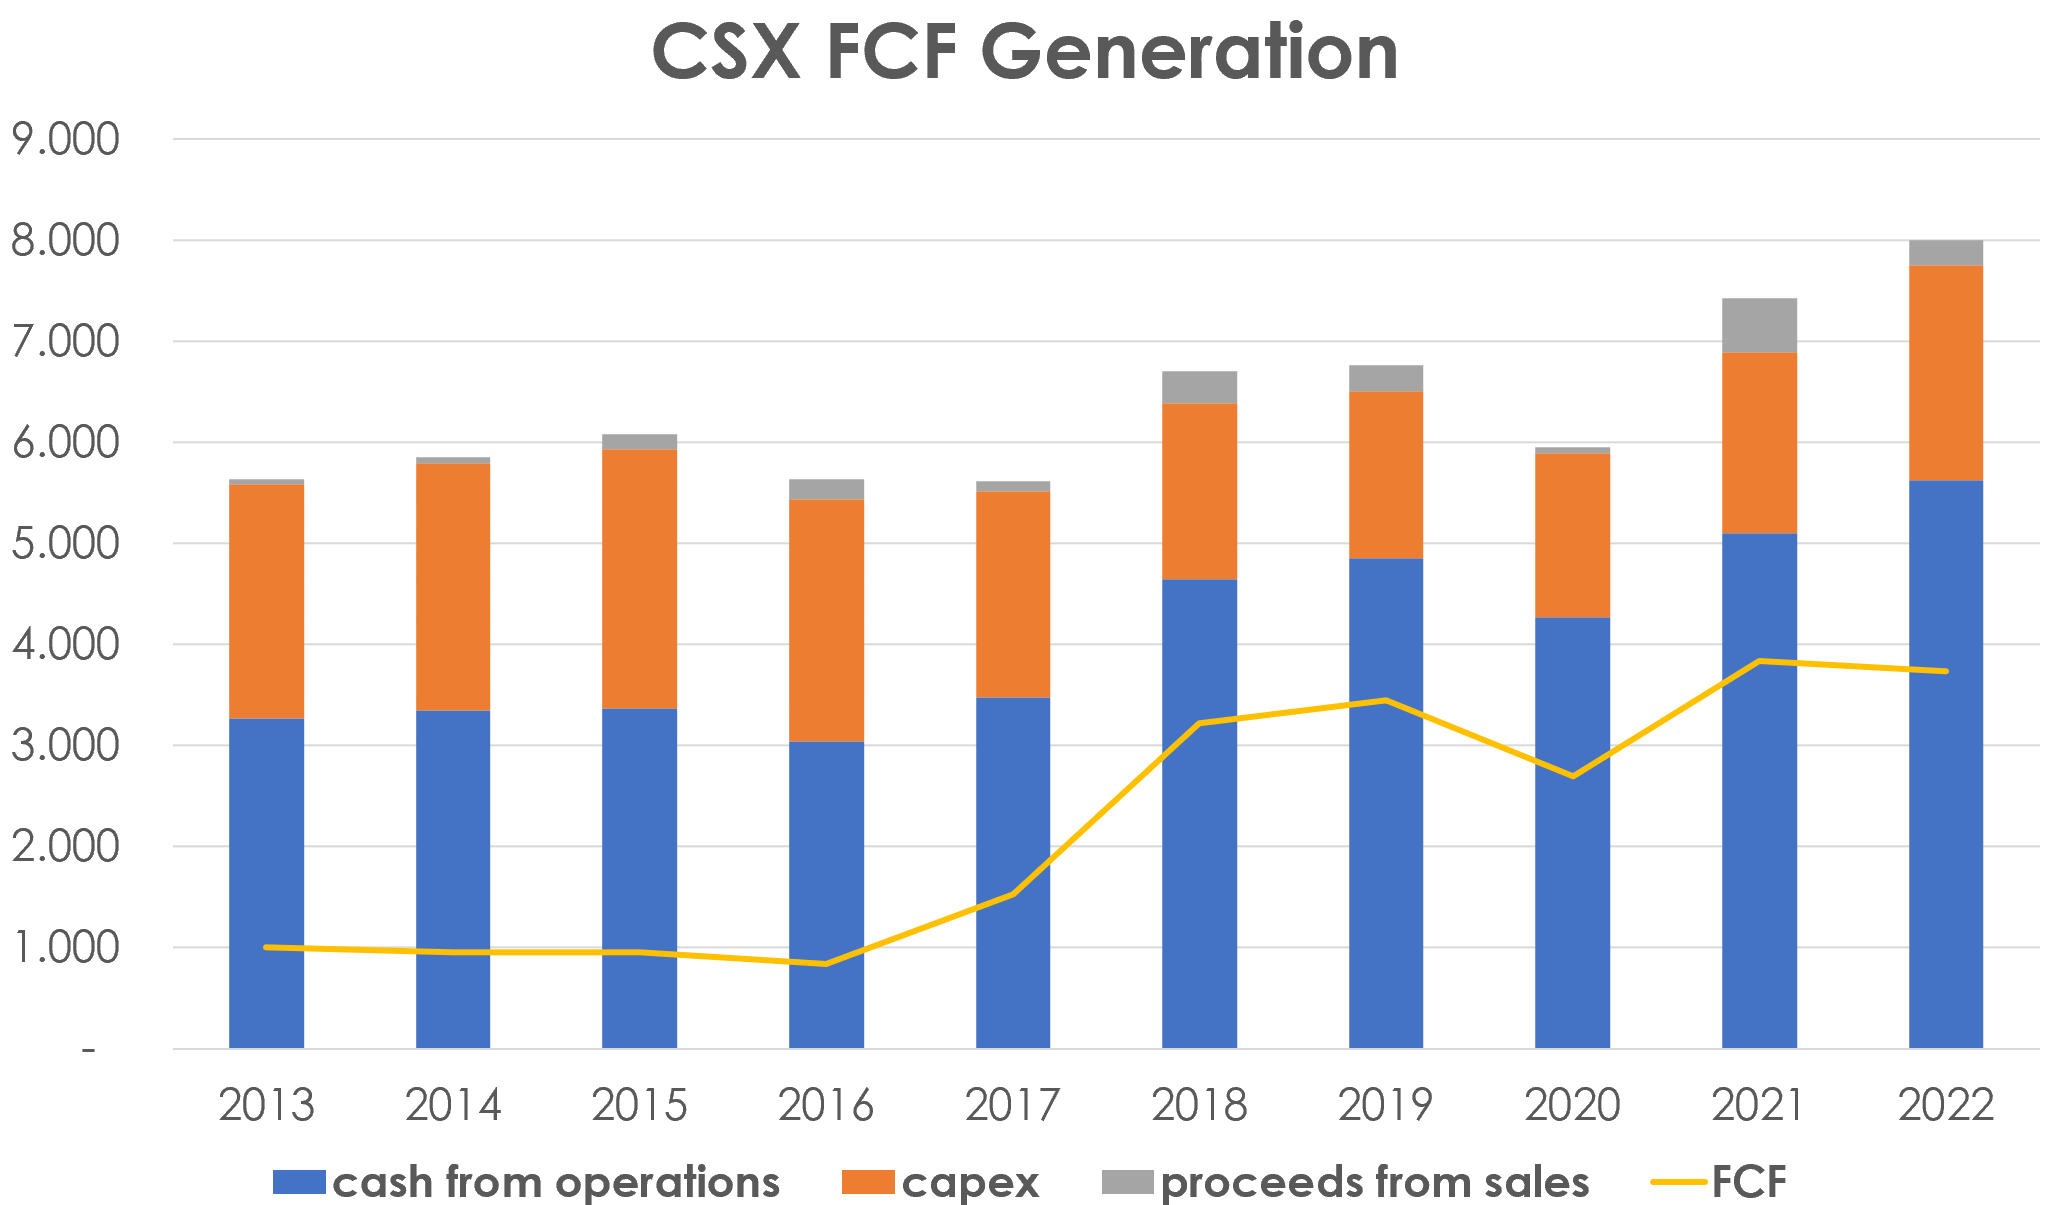
What has CSX done with its FCF? The answer is easily found in the graph below. The company has returned it all to its shareholders.
Author, with data from CSX Annual Reports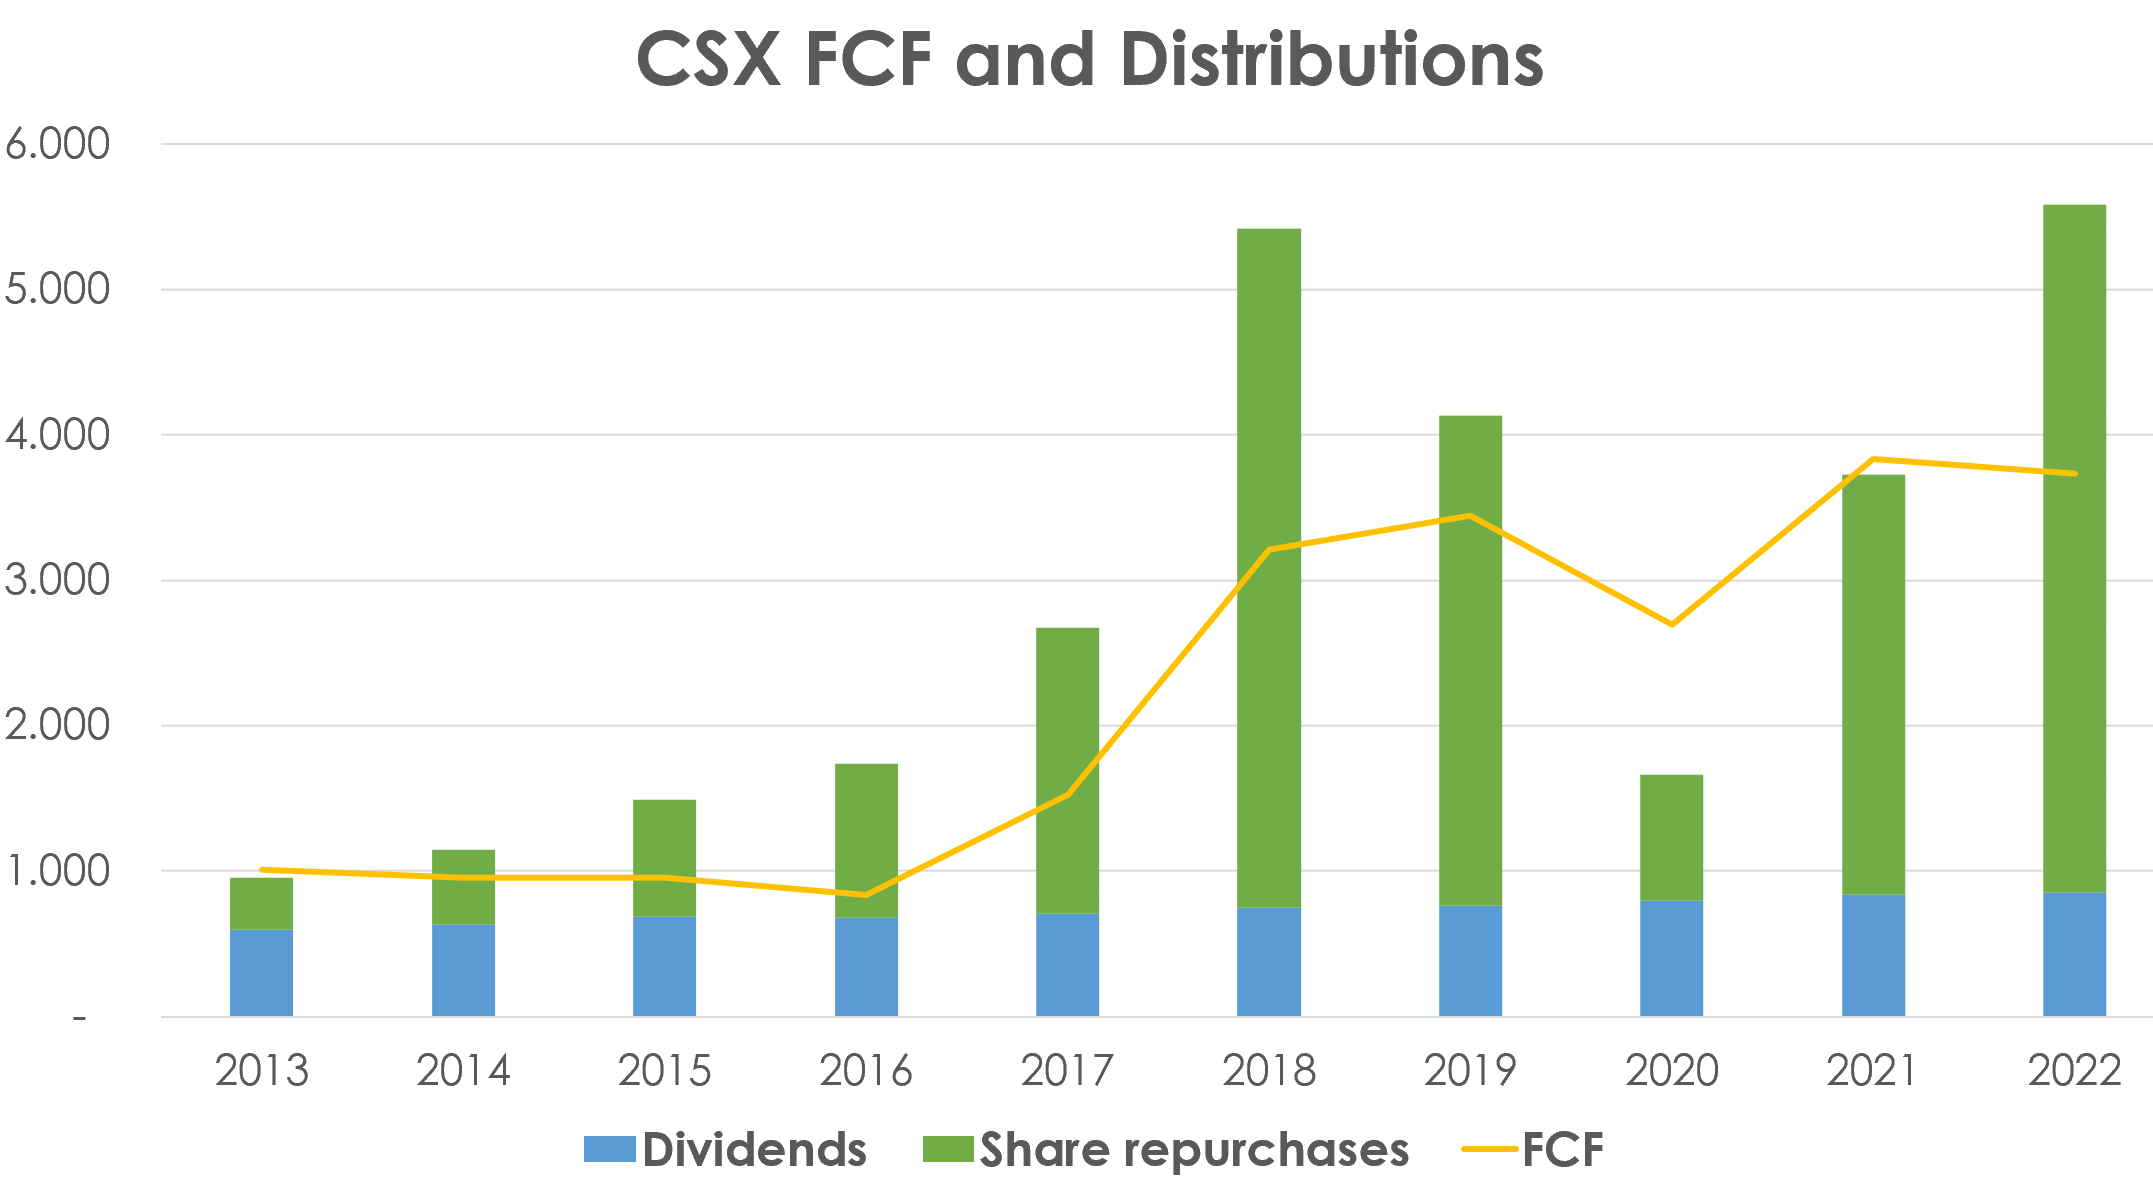
But this graph also shows what I have been saying is unsustainable. In the past decade, excluding 2020, CSX has always returned to its shareholders more than its FCF. In fact, while dividends have been completely paid through FCF, the same isn't true for buybacks. While a buyback program can be a way to return extra cash sitting on the balance sheet to the shareholders, this can't be the reason that explains a whole decade of shareholder distributions well above the yearly FCF. If we couple this with below-average equipment spending.
Valuation And Conclusion
Overall, CSX shows me a mixed picture. It is unquestionable how it owns and operates one of the most important networks in the States. It is indisputable it will benefit from the manufacturing reshoring. It won't face any new competitors. It will be a necessary artery or the economic activity in the East.
Yet, with all these tailwinds creating a strong moat, investors may expect the company's balance sheet deleveraged a bit. For sure, many shareholders have welcomed the way the company bumped up its EPS and its total returns. However, when this is done in an unsustainable way, sooner or later the company will have to face the harsh reality. Not by chance, with the economy slowing, the company had to decrease its quarterly buyback to $863 million vs. $1.5 billion in Q2 2022.
At the time of writing, the company trades at $30 per share. Its yield is 1.44% vs. Norfolk's 2.62%. Its forward PE, however, is 16 while Norfolk trades at a 21. Currently, CSX is the cheapest railroad. Its price/FCF ratio is 11, again making it the cheapest. As we have seen, CSX has been able to generate $22 billion of FCF in the past decade, which is around 33% of the current market cap. At the end of 2013, the company's market cap was $28.6 billion. So those who bought at that time have almost fully been repaid through FCF generation. I am still rating it as a hold because of some concerns on how it is managed. But it is clear that below $30, the more it drops the more CSX becomes a very alluring bet for the next decade.
This article was written by

Analyst’s Disclosure: I/we have no stock, option or similar derivative position in any of the companies mentioned, and no plans to initiate any such positions within the next 72 hours. I wrote this article myself, and it expresses my own opinions. I am not receiving compensation for it (other than from Seeking Alpha). I have no business relationship with any company whose stock is mentioned in this article.
Seeking Alpha's Disclosure: Past performance is no guarantee of future results. No recommendation or advice is being given as to whether any investment is suitable for a particular investor. Any views or opinions expressed above may not reflect those of Seeking Alpha as a whole. Seeking Alpha is not a licensed securities dealer, broker or US investment adviser or investment bank. Our analysts are third party authors that include both professional investors and individual investors who may not be licensed or certified by any institute or regulatory body.