I Wouldn't Be Too Excited - This Correction Could Get Worse

Summary
- The S&P 500 is facing challenges due to mixed economic data, high interest rates, and uncertainty about the Fed's path and inflation.
- The SPX is developing a head and shoulders pattern, suggesting a potential loss of momentum in the near term.
- The market may experience consolidation and volatility, with a possible correction of 8-10% in the SPX, creating buying opportunities for a significant rally into year-end.
- This idea was discussed in more depth with members of my private investing community, The Financial Prophet. Learn More »
primeimages
The "Market" S&P 500/SPX (SP500) faces another challenging, transitory hurdle. Recent economic data has been mixed, and interest rates remain high. There are questions about the Fed's path and inflation, and there is plenty of uncertainty regarding the overall health of the U.S. economy and its path forward. Meanwhile, stocks have had a sensational rebound, with some bellwether companies surging into overbought and overvalued territory. Therefore, we're confronted with a problematic near-term technical image and should remain cautious in the short term.
SPX 1-Hour Chart
SPX (Thinkorswim)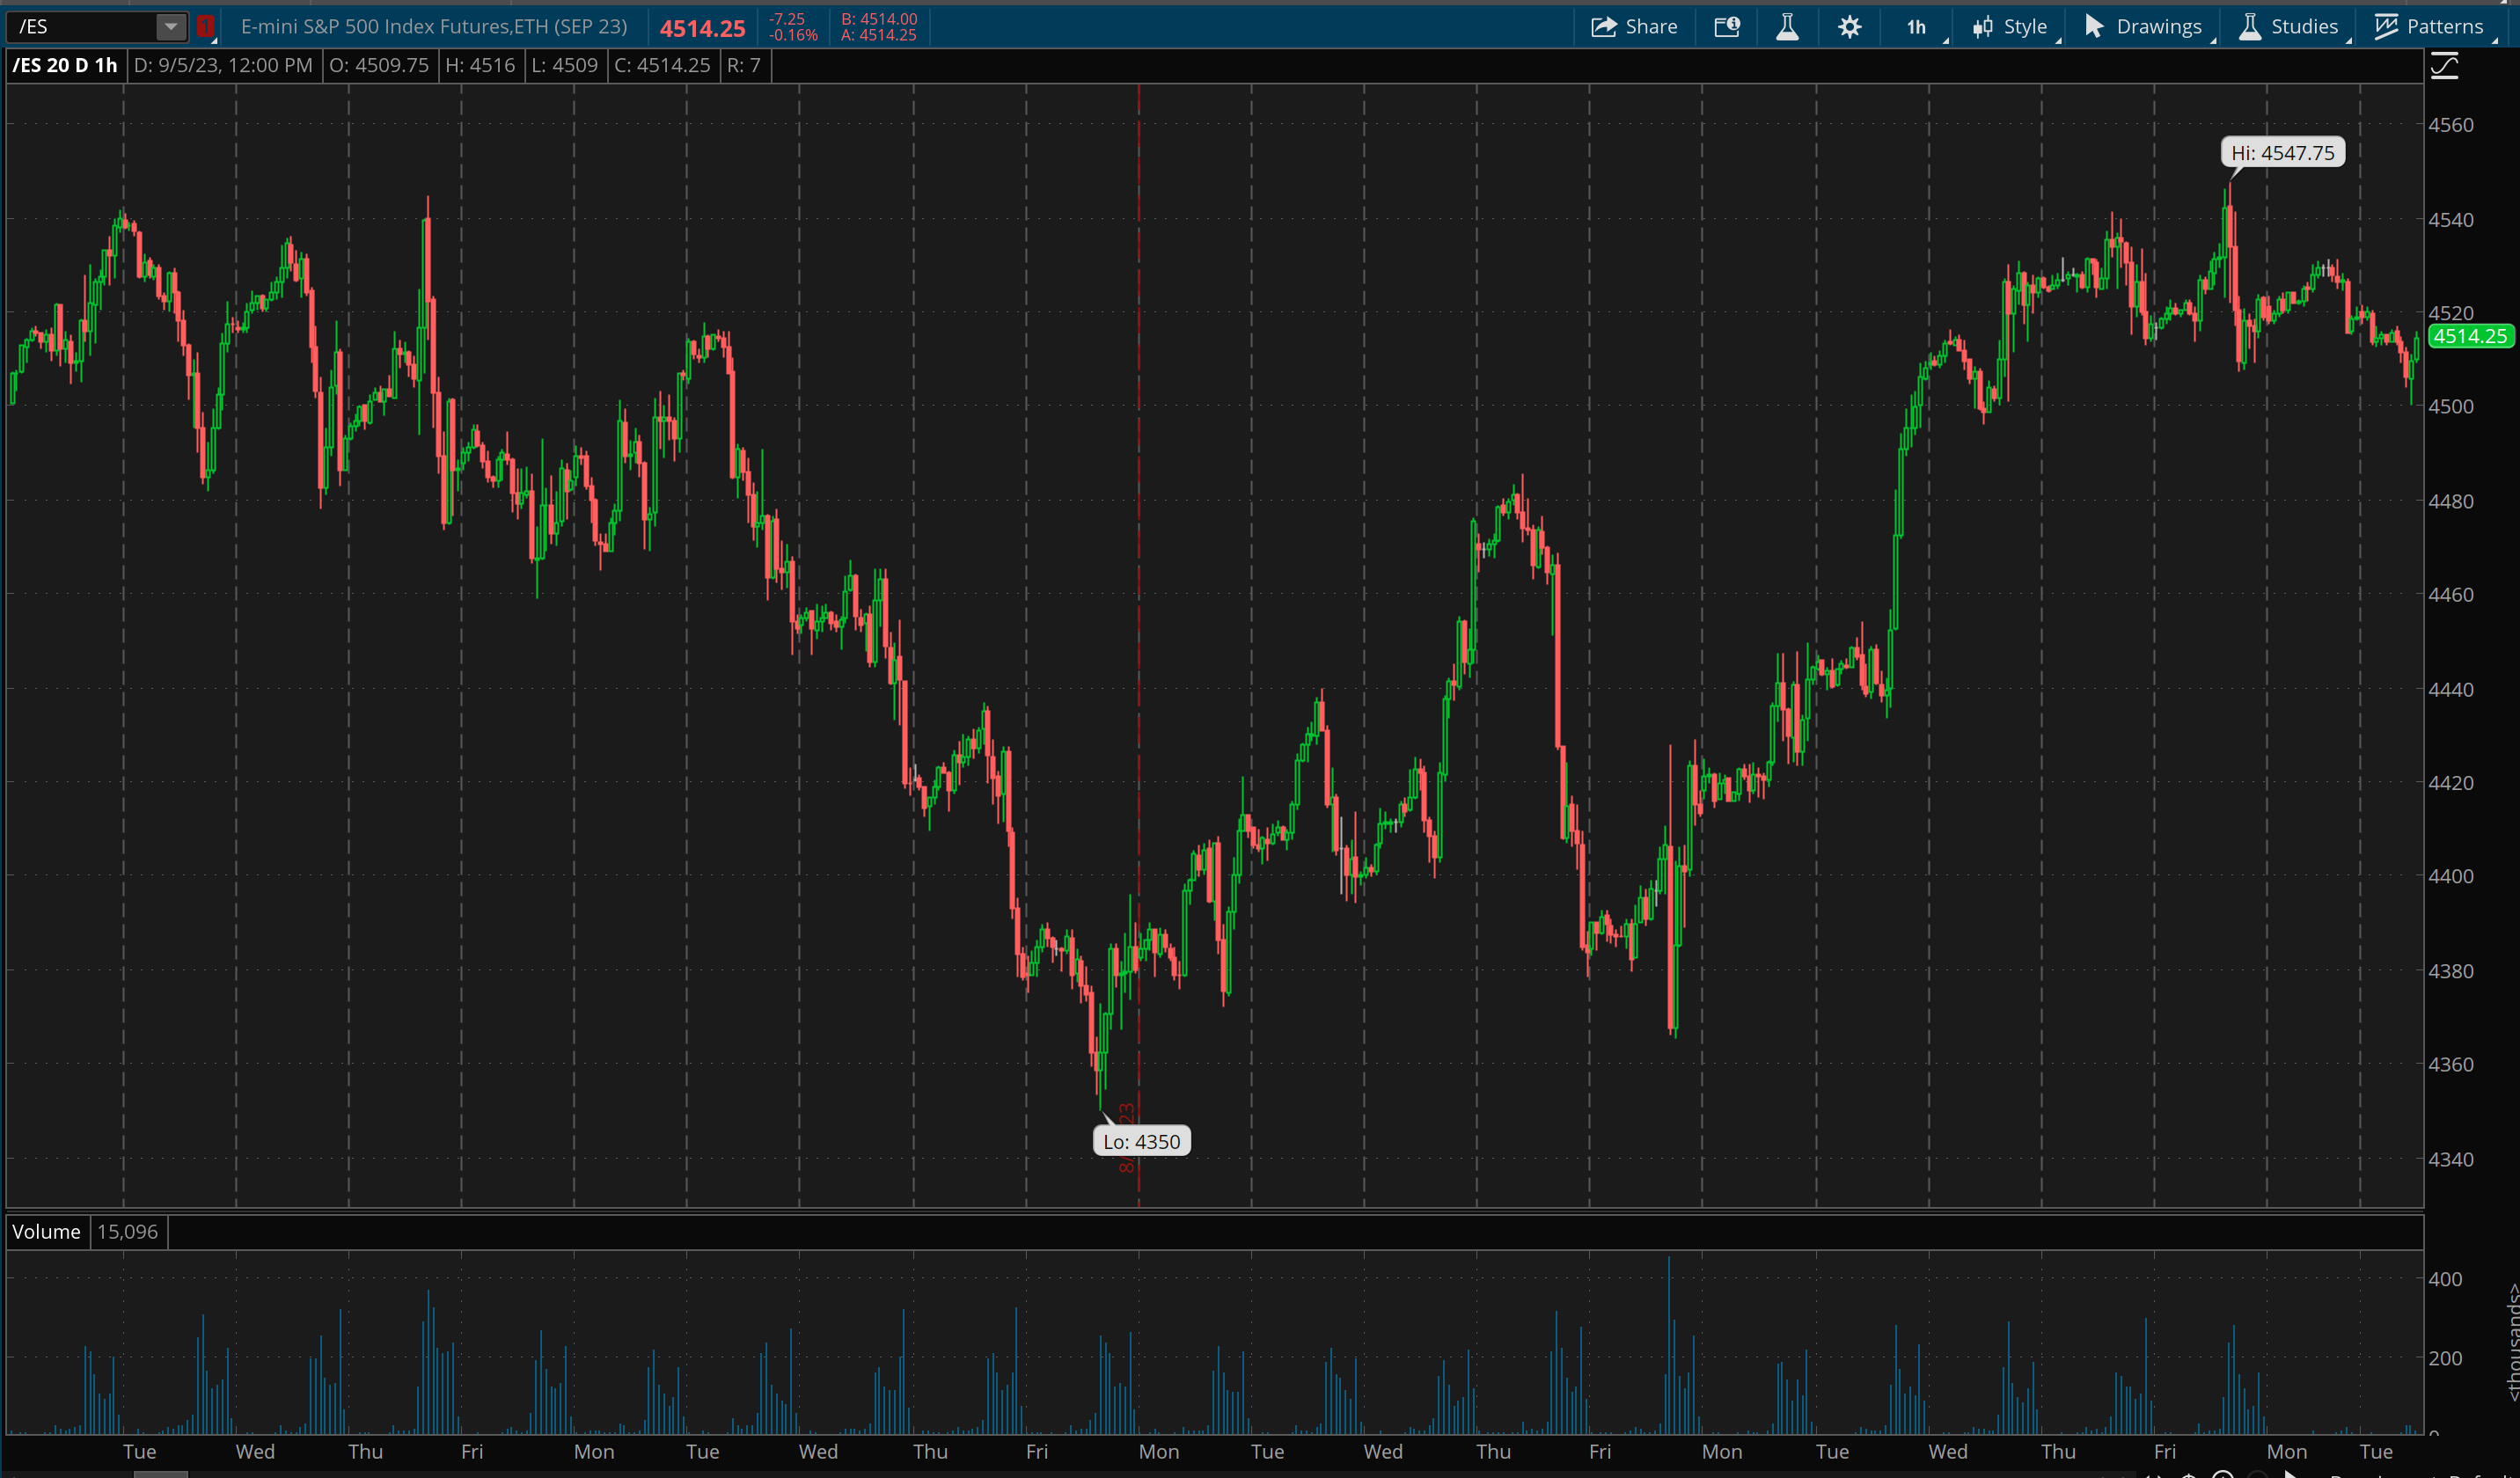
The SPX is developing a head and shoulders pattern, implying the market could continue losing momentum in the near term. 4,500 is the initial crucial support level, with the 4,450 - 4,350 zone representing critical short-term support. If SPX breaks below its recent low of 4,350, it should move down to the 4,300-4,200 (8-10%) correction zone next.
Longer-Term - Not Out of The Woods Yet
SPX (StockCharts.com)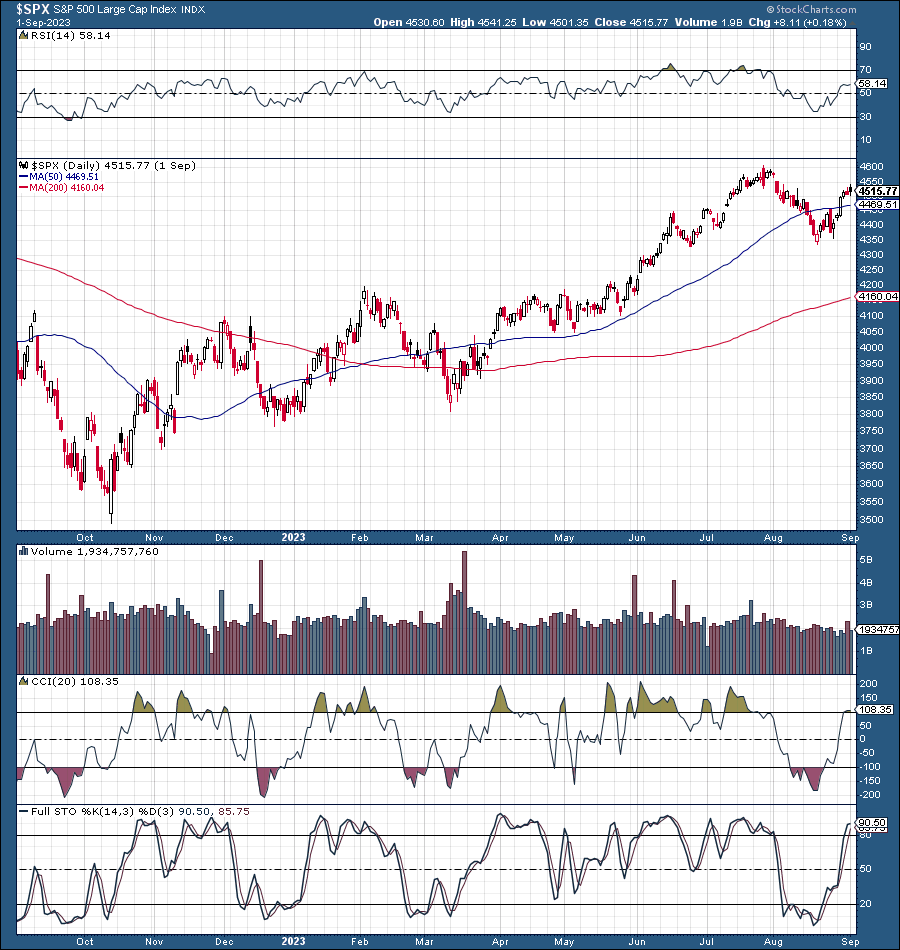
We saw a remarkable rally of around 30% from the bear market lows achieved last October. However, many stocks and the market in general became highly overbought. While we received the badly needed pullback, the correction has only been about 6% in the SPX and approximately 9% in the Nasdaq.
Therefore, a logical question appears - Is the correction over, or will the market go for another dip? There are several plausible scenarios as we move forward. The first and most probable is that we will continue seeing rotation, consolidation, and some more volatility in the near term.
The range for the consolidation process remains in the 4,500-4,350 zone. However, the market can also test slightly lower around the 4,300-4,200 support point, close to the 200-day MA. Moving lower into this range would result in a correction of about 8-10% in the SPX. If the pullback persists, it should create numerous compelling long-term buying opportunities, setting the market up for a significant rally into year-end (4,800-5,000 target range).
Critical Data - This Week
Economic data (Investing.com)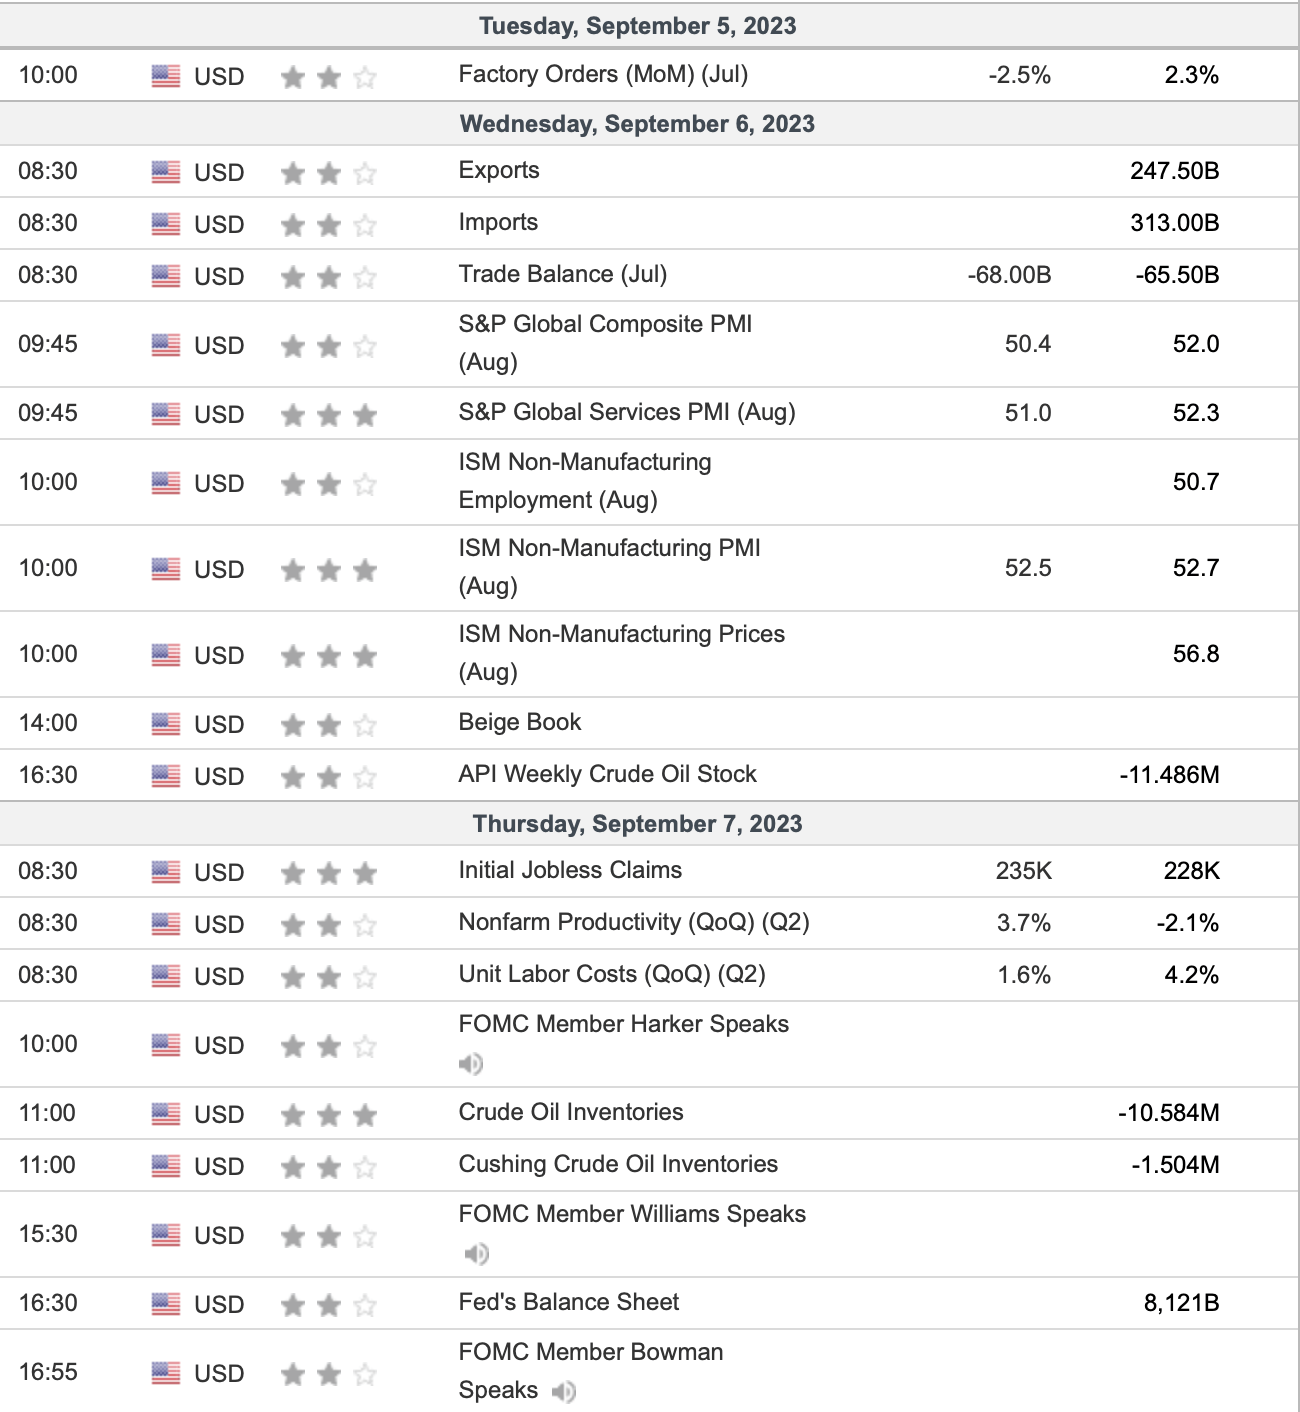
This week is light data-wise - We have manufacturing/non-manufacturing ISM figures, employment statistics, crude oil readings, Fed speak, and the beige book. However, we don't have significant market-moving events concerning economic data. However, we may see exciting developments from the beige book. Therefore, I am looking forward to Wednesday for that.
Last week - GDP came in below estimates (2.1% vs. 2.4%). As expected, PCE inflation came in at 3.3% (4.2% core). Nonfarm payrolls were slightly better than anticipated (187K vs. 170K). Yet, the unemployment rate ticked up to 3.8%. ISM manufacturing readings came in better than expected.
The Earnings Front
Last week - We witnessed positive earnings announcements from several significant companies, including PDD (PDD), Salesforce (CRM), Broadcom (AVGO), and others. PDD's report was exceptionally robust, as the company knocked revenues and EPS out of the park, crushing sales estimates by a staggering 20%. The stock has surged by about 30% since the excellent earnings announcement.
This Week - I don't see any significant earnings announcements this week. Therefore, having a light data/earnings week, we could rely more on the technicals to drive price action in the near term.
Checking in on the FOMC
Fed Watch (CMEGroup.com)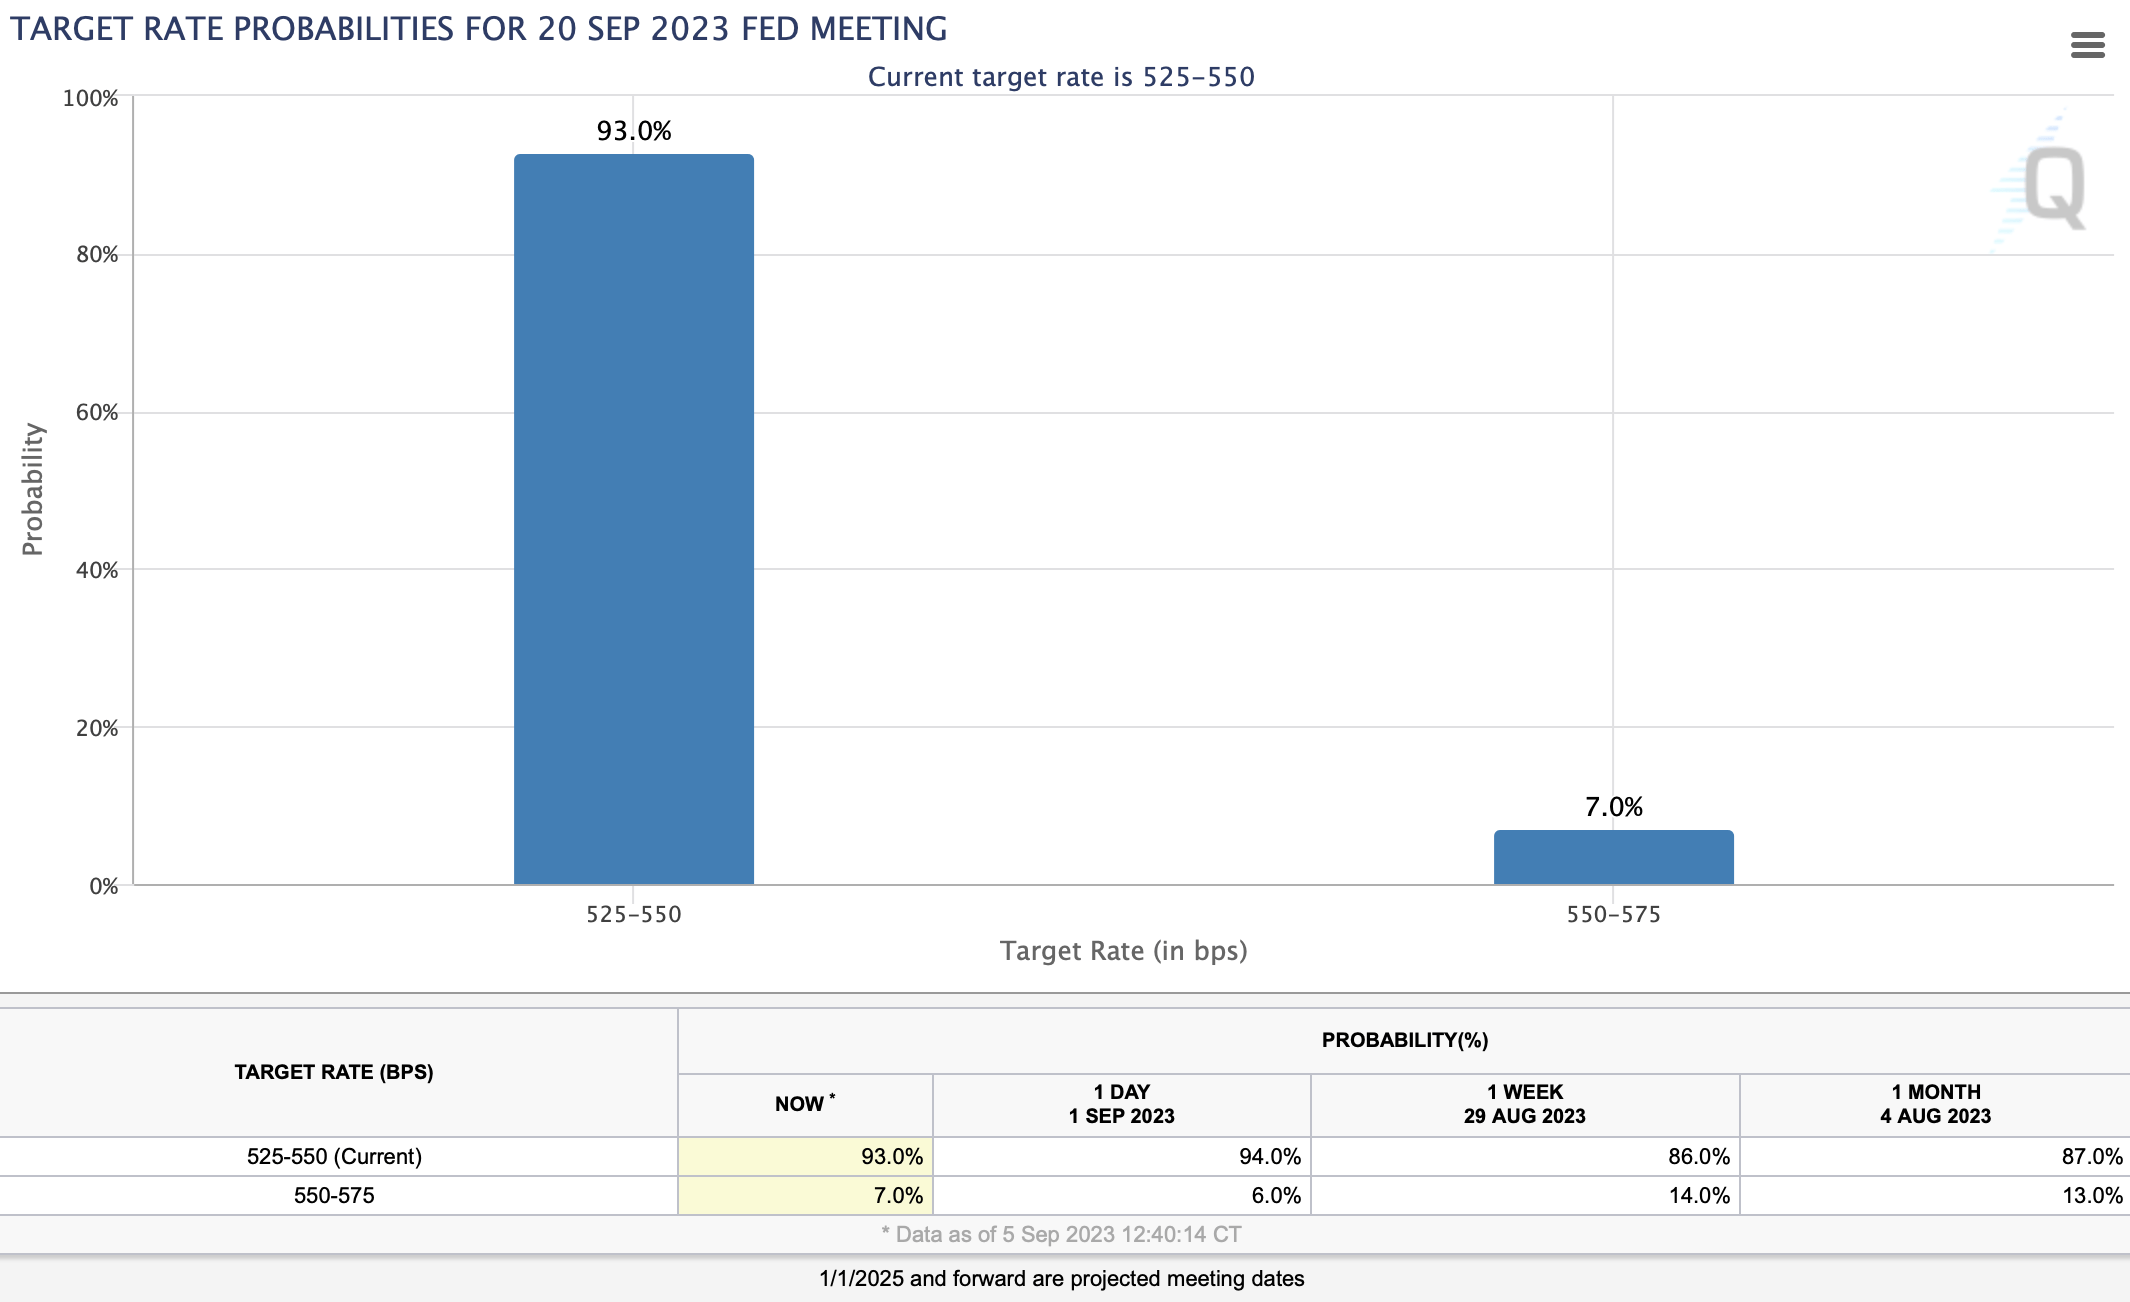
The FOMC meeting is in two weeks - There is an overwhelming probability (93%) that the benchmark rate will remain at its current 5.25-5.5% range. Moreover, if we look at the rate probabilities for early next year, we see more than a 70% probability that the funds rate will be at its current rate or lower in early 2024. This dynamic implies that the Fed may be nearing a pivot, and we could see the FOMC begin lowering interest rates early next year.
Some Bellwethers - Valuations Look Expensive Now
- Microsoft (MSFT) - 10 times sales, 30 times EPS estimates
- Apple (AAPL) - 8 times sales, 31 times EPS estimates
- NVIDIA (NVDA) - 22 times sales, 45 times EPS estimates
- Tesla (TSLA) - 8 times sales, 71 times EPS estimates
- Netflix (NFLX) - 6 times sales, 37 times EPS estimates
These are just several examples, but the stock universe is full of stocks that may be temporarily overbought and overvalued here. Moreover, the overvaluation issue is widespread and may become more significant if higher rates persist longer than anticipated.
The S&P 500 - Not That Cheap Anymore
SP 500 P/E (multpl.com)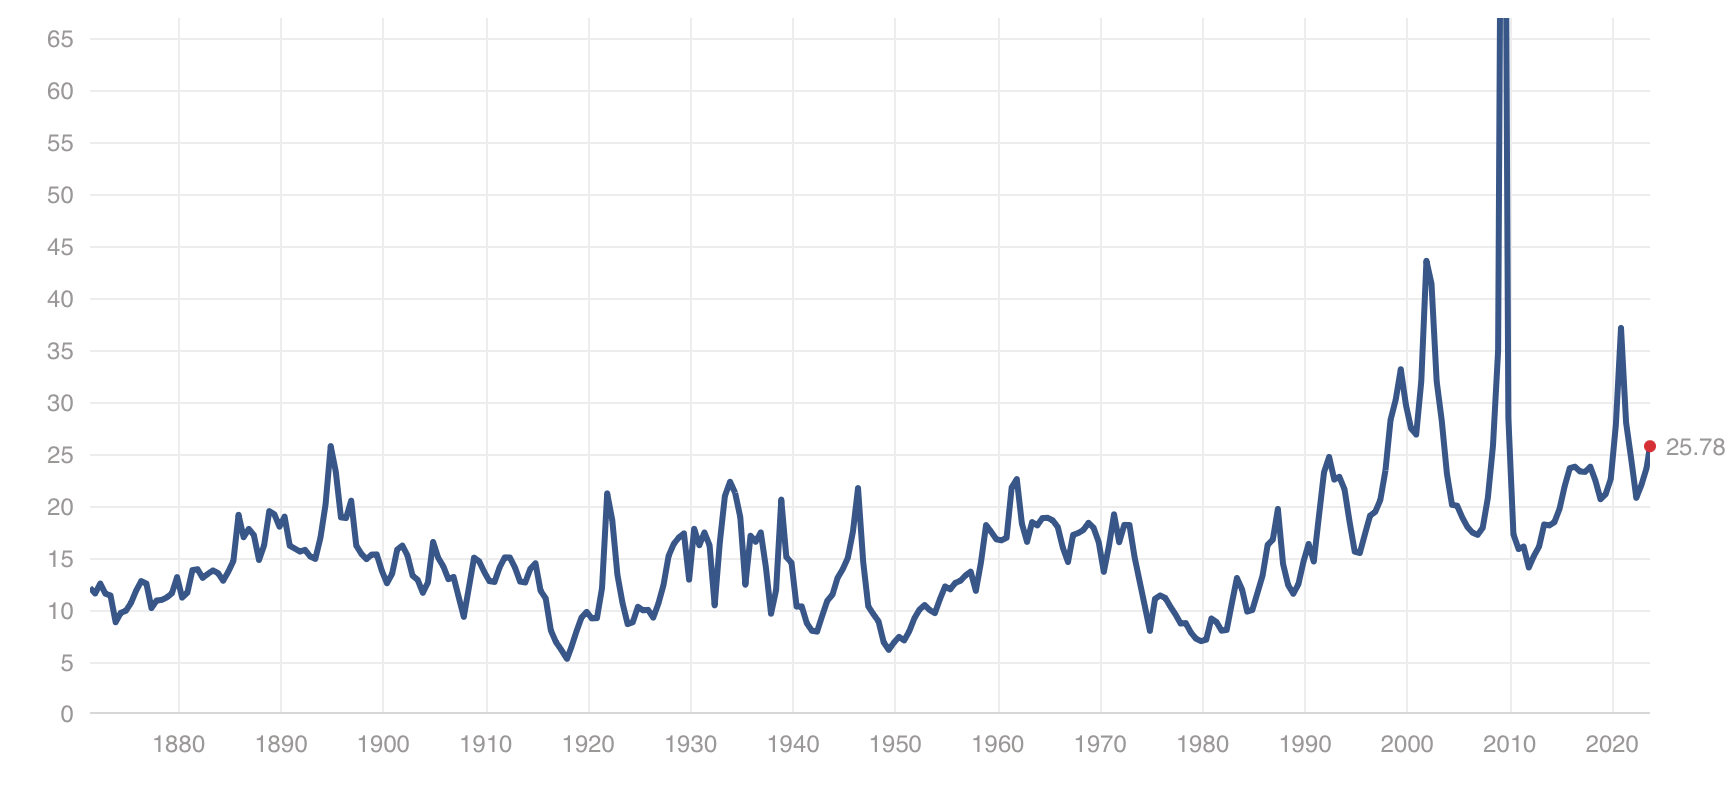
While the SPX dipped to about 20 P/E, it's bounced back to around 25 now, illustrating that the general market is not that cheap anymore. It may be considered relatively expensive in a relatively high-interest rate environment. Suppose we see another period of multiple contractions. In that case, the SPX's P/E may contract to about the 22-20 zone again, implying a downside of around 10-20% is still plausible for the S&P 500 and other major averages.
The Bottom Line
While I remain bullish in the intermediate and long term, the market may still grind through this consolidation and pullback phase in the coming weeks. Moreover, we may retest the previous low of about 4,350 SPX and move lower into the 4,300-4,200 (8-10%) correction range in a worse-case scenario. The fundamental factors surrounding the market appear solid, but we're seeing more indications of a significant slowdown beneath the surface as we advance.
The Fed should support markets and may move to an easier monetary stance as we move into the new year. Nevertheless, the economic image may need to worsen before the Fed shows more apparent signs that the pivot is near. Provided these catalysts and other developing elements, increased caution is warranted as we enter the Fall months. My correction bottom is the 4,150-4,350 level, and my year-end target range remains at the 4,800-5,000 point in the SPX.
Are You Getting The Returns You Want?
- Invest alongside the Financial Prophet's All-Weather Portfolio (2022 17% return), and achieve optimal results in any market.
- Our Daily Prophet Report provides crucial information before the opening bell rings each morning.
- Implement our Covered Call Dividend Plan and earn an extra 40-60% on some of your investments.
All-Weather Portfolio vs. The S&P 500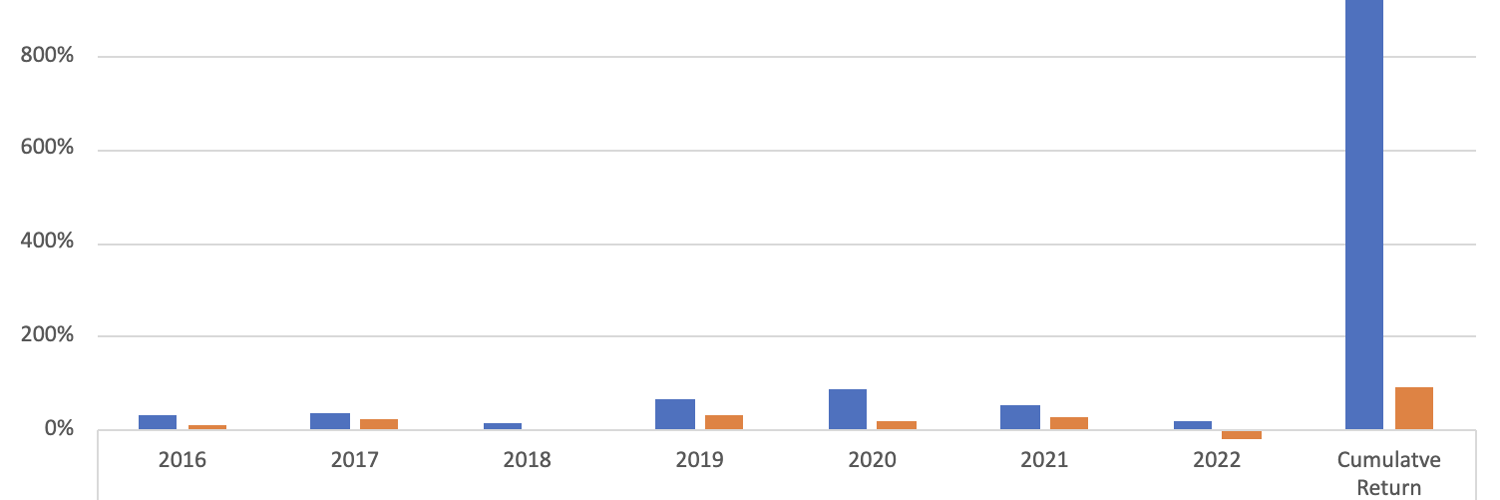
Don't Wait! Unlock Your Own Financial Prophet!
Take advantage of the 2-week free trial and receive this limited-time 20% discount with your subscription. Sign up now, and start beating the market for less than $1 a day!
This article was written by

Hi, I'm Victor! It all goes back to looking at stock quotes in the old Wall St. Journal when I was a kid. What do these numbers mean, I thought? Fortunately, my uncle was a successful commodities trader on the NYMEX, and I got him to teach me how to invest. I bought my first actual stock in a company when I was 20, and the rest, as they say, is history. Over the years, some of my top investments include Apple, Tesla, Amazon, Netflix, Facebook, Google, Microsoft, Nike, JPMorgan, Bitcoin, and others.
Analyst’s Disclosure: I/we have a beneficial long position in the shares of ASSETS MENTIONED either through stock ownership, options, or other derivatives. I wrote this article myself, and it expresses my own opinions. I am not receiving compensation for it (other than from Seeking Alpha). I have no business relationship with any company whose stock is mentioned in this article.
I am long a diversified portfolio with hedges.
Seeking Alpha's Disclosure: Past performance is no guarantee of future results. No recommendation or advice is being given as to whether any investment is suitable for a particular investor. Any views or opinions expressed above may not reflect those of Seeking Alpha as a whole. Seeking Alpha is not a licensed securities dealer, broker or US investment adviser or investment bank. Our analysts are third party authors that include both professional investors and individual investors who may not be licensed or certified by any institute or regulatory body.
Recommended For You
Comments (2)
