Williams-Sonoma: Potential Undervaluation Based On Long-Term Growth

Summary
- Long-term growth in revenue, net income, and free cash flow but short-term declines.
- Strong balance sheet, with a good Debt/EBITDA ratio.
- Share repurchases and stock-based compensation are reasonable.
- Undervalued through a corporate DCF analysis. Unlevered free cash flows are discounted by WACC using CAPM.
- High ROIC compared to WACC.
Justin Sullivan
Preview
Williams-Sonoma, Inc., (NYSE:WSM), is an omni-channel specialty retailer of high-quality products for the home. The company was founded in 1956 by Chuck Williams, who opened a store in Sonoma, California to sell French cookware. Williams-Sonoma has since expanded beyond the kitchen to offer a wide range of home goods, including furniture, bedding, lighting, and décor. The company operates e-commerce websites, direct-mail catalogs, and retail stores in the United States, Canada, Australia, and the United Kingdom. Williams-Sonoma has a number of well-known brands, including Williams Sonoma, Pottery Barn, Pottery Barn Kids, West Elm, and Rejuvenation.
The stock has shown almost a 100% increase over last 5 years, but hasn't touched its peak of around $220 since November 2021. The price movement has trended up in the last 6-months almost 17% despite a large amount of retailers struggling with issues such as shrinkage (theft), labor shortages, macroeconomic headwinds like rising interest rates, and shifts to broad ecommerce sites. This seems like an interesting time to dig deeper in WSM and see if a value proposition is available.
In this article, I will evaluate WSM based on five categories:
- Growth
- Balance Sheet
- Share Repurchases/Stock-Based-Compensation
- A Fairly-Priced Stock
- Management's Decisions through the Return on Invested Capital ("ROIC") Metric.
I will then assign my rating for the stock based on the performance of these categories and personal interpretation of the information. Let's dig in!
Growth
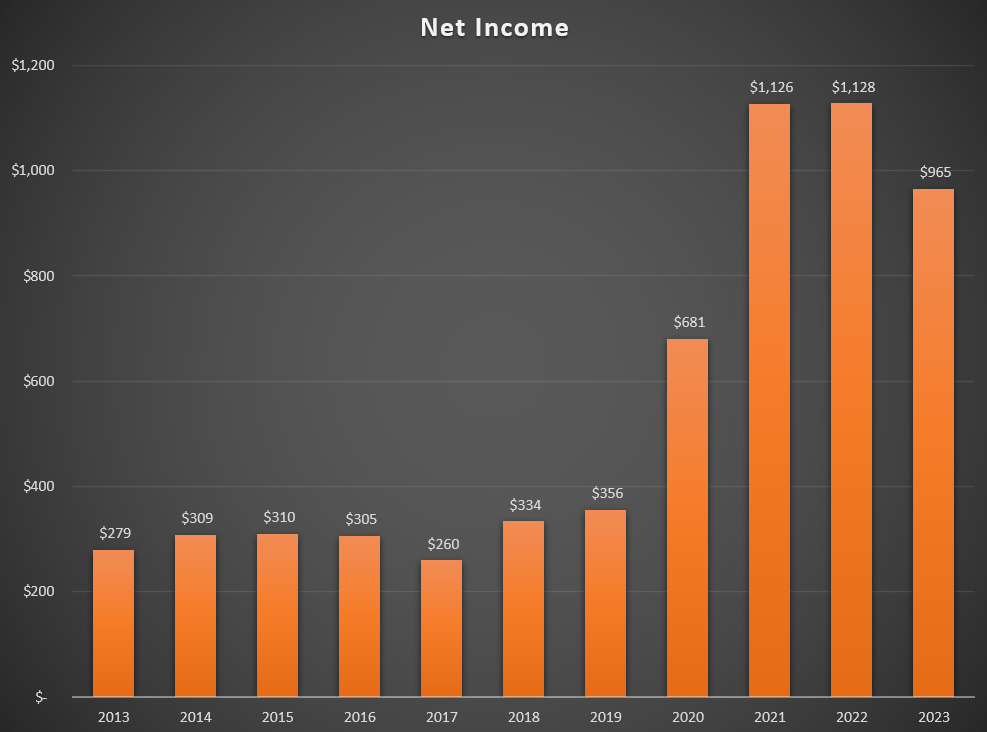
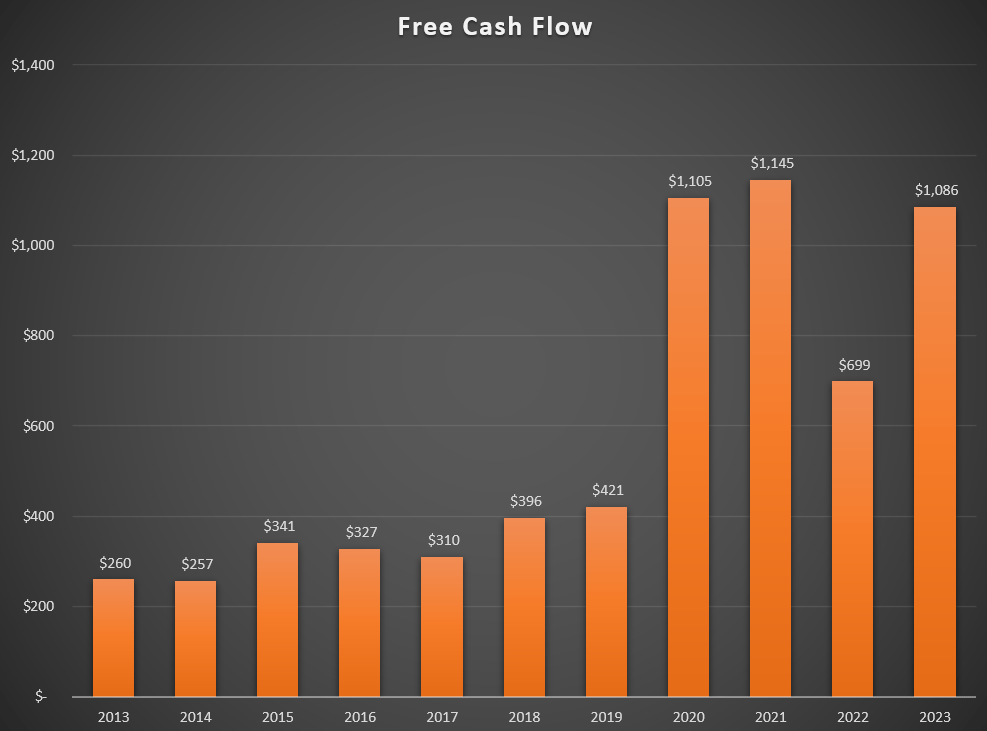
For Growth, I want to see a long-term increase in Revenue, Net Income, and Free Cash Flow. WSM was knocking it out of the park though 2022, then it took a dip in 2023. Analysts even expect this growth decline to continue in the upcoming coming years. The nature of retail industry is cyclical and I expect WSM to have some down years. I make sure to include this assumption in my Discounted Cash Flow ("DCF") analysis. However, I like the shape of these charts over the long run, and for that reason, I will give the Growth category a "Pass".
WSM Revenue (Author) WSM Net Income (Author) WSM Free Cash Flow (Author)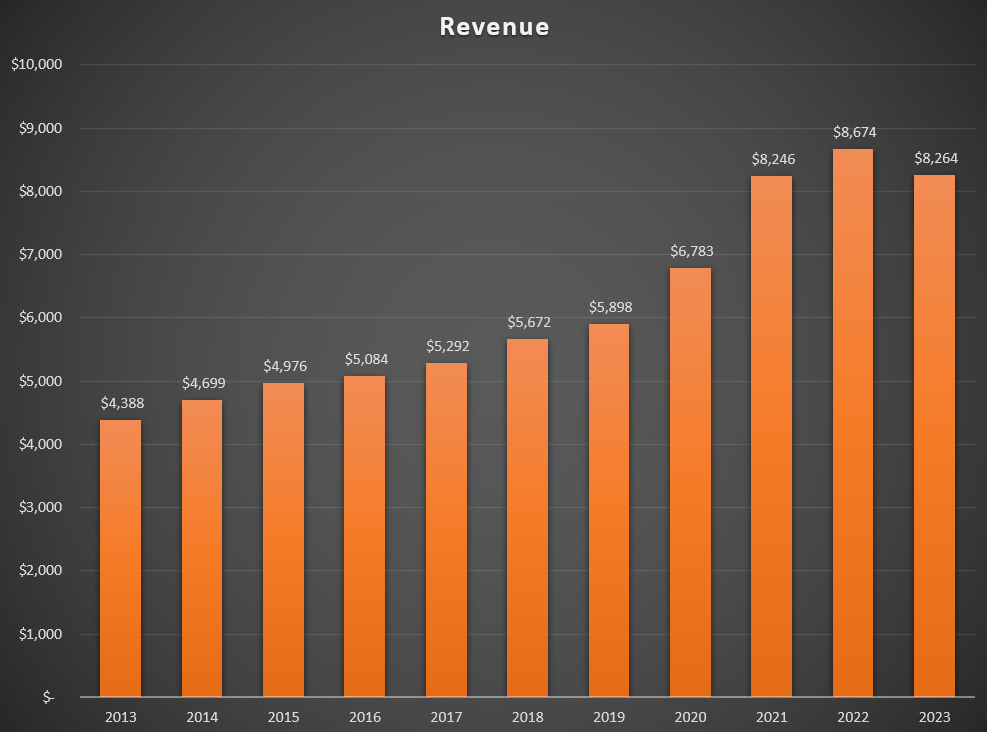
Balance Sheet
There are a million ways to evaluate the balance sheet. For a retailer like WSM, one could even disregard any capital lease obligations but I want to keep it simple here. I'll take the TTM Net Debt of $875.9M and TTM EBITDA of $1524.8M and divide the two for a Debt-to-EBITDA ratio of 0.57. This means WSM could pay off its entire net debt in half a year's profit. I would say that deserves a "Pass" for the balance sheet.
Stock-Based Compensation and Share Repurchases
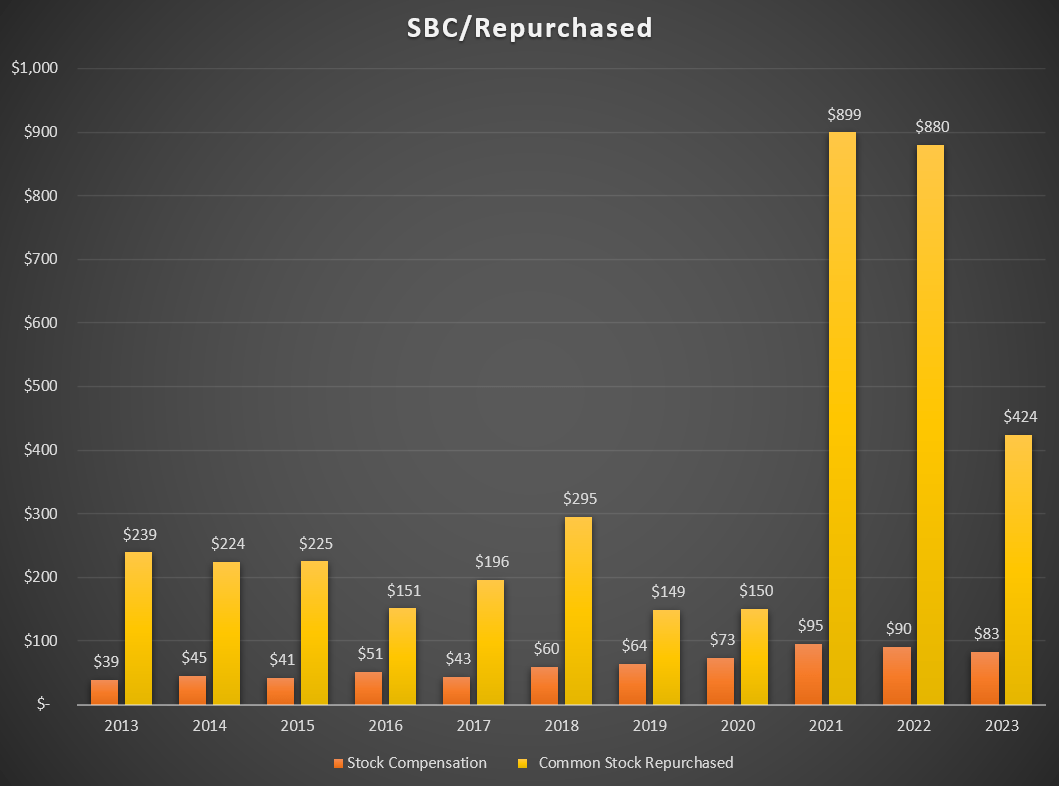
WSM boasts great balance sheet, but I want to make sure they aren't devaluing my share in the company through other means like Stock-Based Compensation ("SBC") or dilution through issuing shares in general. As far as share dilution goes, WSM has done a great job buying back stock over the years. Furthermore, the money spent on share repurchases far outweighs the money they've returned to insiders through SBC. Overall, I'm happy with managements decisions here. The only thing that concerns me is the large majority of money was spent on share repurchases in 2021 and 2022. One could say that if the company was overvalued during this time frame, it was not a very good investment. But overall, I will give this category a "Pass".
Diluted Shares Outstanding WSM (Author) SBC WSM (Author)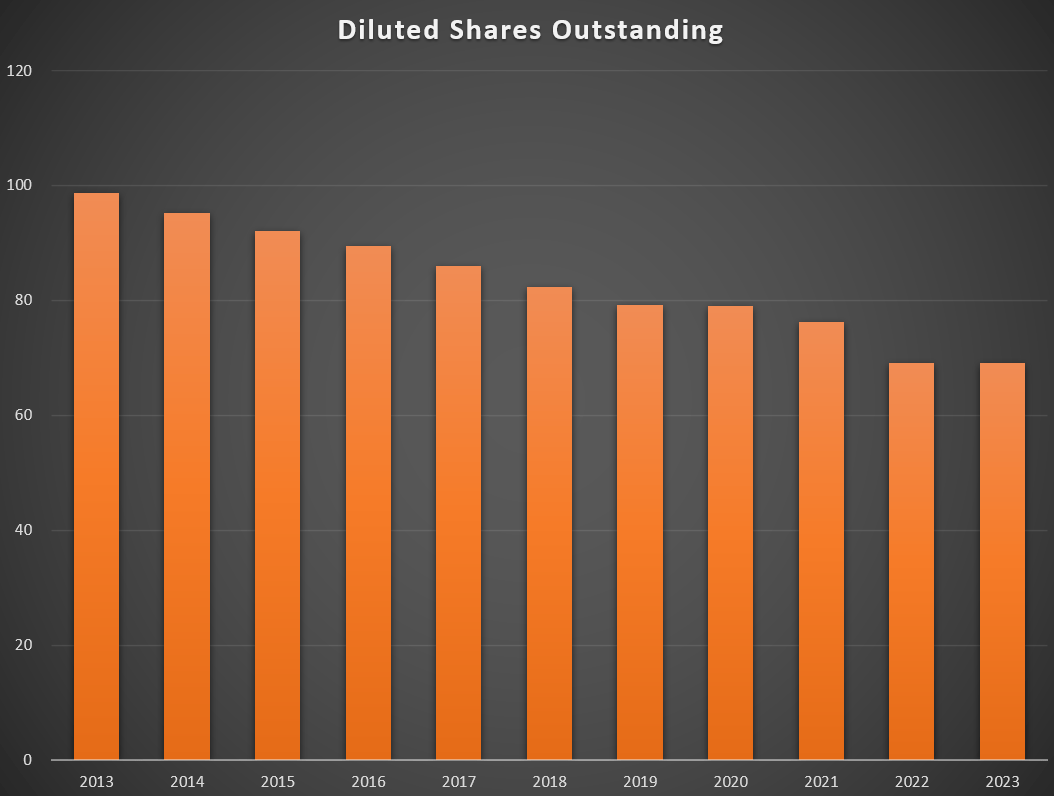
Risk and Discount Factor
For my Discounted Cash Flow Analysis ("DCF"), I am using Free Cash Flows to The Firm ("FCFF"), also known as Unlevered Free Cash Flow. If Unlevered Free Cash Flows are being used, the firm's Weighted Average Cost of Capital ("WACC") should be used as the discount rate. This is because one must take into account the entire capital structure of the company to include the share of all investors. A portion of the WACC will be found by using the Capital Asset Pricing Model ("CAPM"). The assumptions are shown here:
WACC WSM (Author)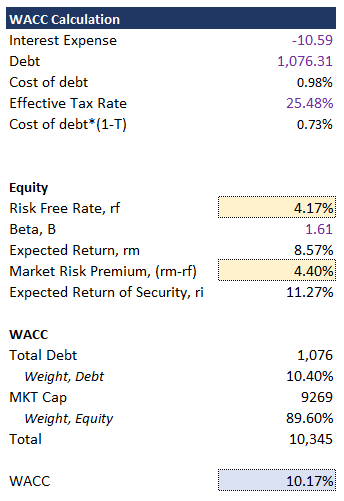
This riskiness of WSM is measured by a Beta of 1.61. Beta does not necessarily measure volatility, but it measures sensitivity to the rest of the market. Beta of greater than 1 means the stock is more sensitive to the market, and eludes a higher risk, which means investors require a higher return. Beta of less than 1 means the stock is less sensitive to the market, and eludes a lower risk, which means investors require a lower return.
The Risk-Free-Rate used was the current 10-year Treasury Bond Rate of 4.17%. This would be a guaranteed return an investor could gain risk free, so it only makes sense an investor should gain a higher return for more risk.
The Market Risk Premium is simply the Expected Return of a broad index minus the Risk-Free-Rate. This would be the premium an investor would need to invest in an WSM versus a simple broad index or ETF. This value was found on Damodaran Online.
Using the Capital Asset Pricing Model ("CAPM"), we arrive at an Expected Return of the Security of 8.57%. After factoring in debt obligations, we arrive at a WACC of 10.17%. This will be used as the base case discount factor moving forward.
Discounted Cash Flow
The DCF models a Base Case Scenario, a Bull Case, and a Bear Case. Assumptions are shown in the tan boxes.
DCF WSM (Author)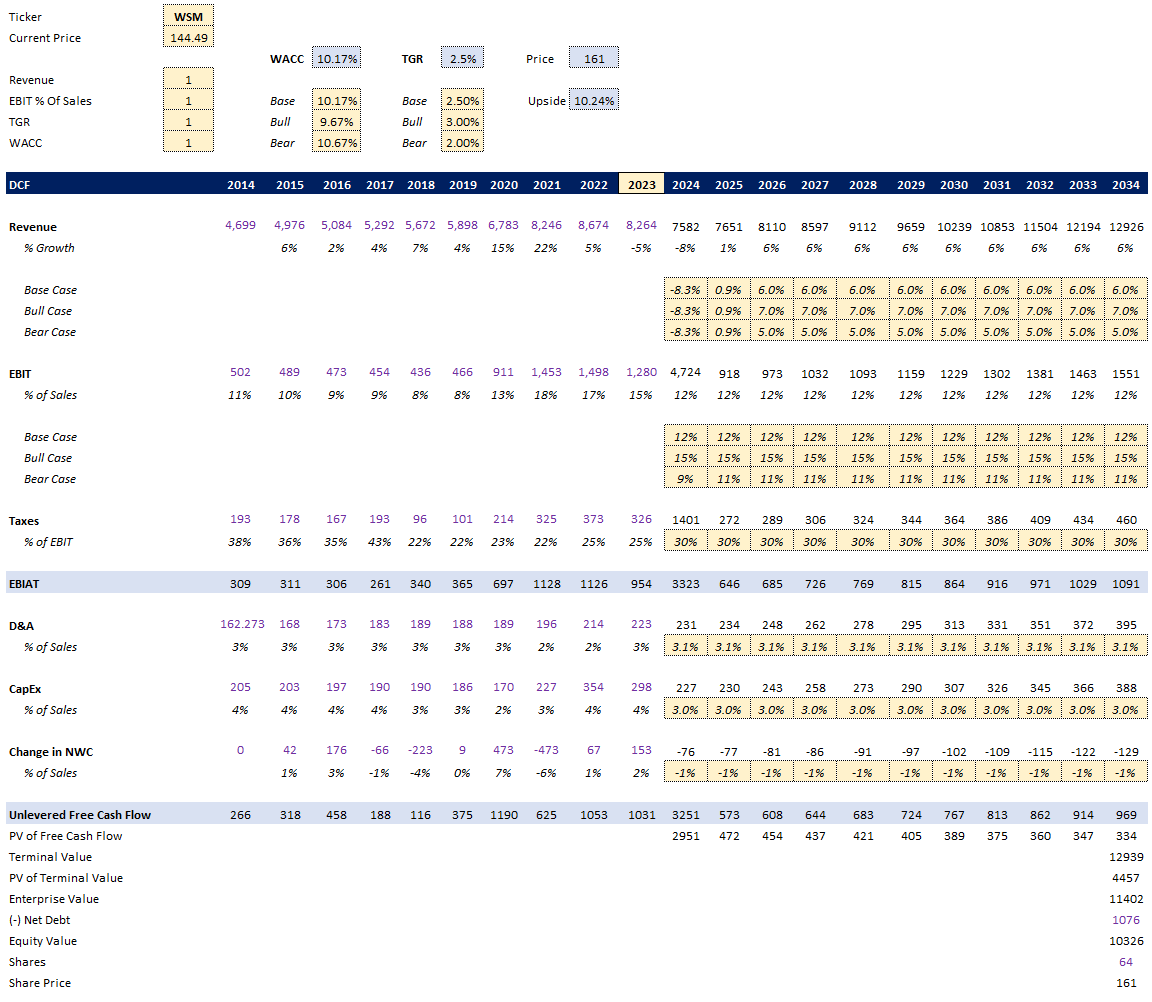
From top down, assumptions for each category are explained:
- WACC - Base Case was previously calculated. Bull and Bear are deviations of the Base Case. This should account for any noise in the WACC calculations.
- Terminal Growth Rate ("TGR") - This is the rate we believe the security will grow indefinitely. Generally, a solid Base Case assumption is 2.5% to represent long term market inflation. I have deviations from this for the Bull and Bear Case respectively.
- Revenue Growth - Note that for all cases, I input the deteriorating growth rates analysis are expected for years 2023 and 2025. Following those years, I input reasonable growth rates for the remaining years.
- Earnings Before Taxes ("EBIT") - Each case follows a different range of average historical margins.
- Taxes - Average of historical rates.
- Depreciation and Amortization - Average of historical rates.
- Capital Expenditures - Average of historical rates.
- Change in Net working Capital - Average of historical rates.
Discussion
The model allows for switches to be made depending on the case scenario. Switches all set to (1) would indicate a Base Model. Switches set to (2) would indicate maximum Bull Case and Switches set to (3) would indicate maximum Bear Case. A Fair value of less than the current share price means the investor is better off investing in a broad market index or ETF from a risk-reward standpoint. A fair value of greater than the current share price means the security is worth investing in. The output of each scenario is as follows:
Base Case - Fair Value of $161, for (10.24%) upside.
Bull Case - Fair Value of $233 for (37.87%%) upside.
Bear Case - Fair Value of $130 for (-10.97%) upside.
Average of all cases - Fair Value of $174.7 for (17%) upside.
Overall, I would say WSM is undervalued through a corporate DCF analysis. There is evidence that investing in WSM may be better than investing in a broad index or ETF from a risk-reward standpoint given the current price, fundamentals, and environment. For this reason, I will give a "Pass" in this category.
Return on Capital
I like to evaluate management's investment decisions. One good way to do this is by looking at Return on Invested Capital ("ROIC"). WSM boasts an incredibly high average ROIC of 26%, with the last two years nearing 40%. The reason I look at this metric last is because one crucial step is comparing this number to the WACC. If WACC is the internal cost of capital, then the ROIC better be higher, to ensure the company is generating value and not destroying it. Since we have already calculated WACC to be around 10%, it's very clear that an average ROIC of 26% blows this thing out of the water. Because of this, a healthy "pass" will be given in this category.
ROIC WSM (Author)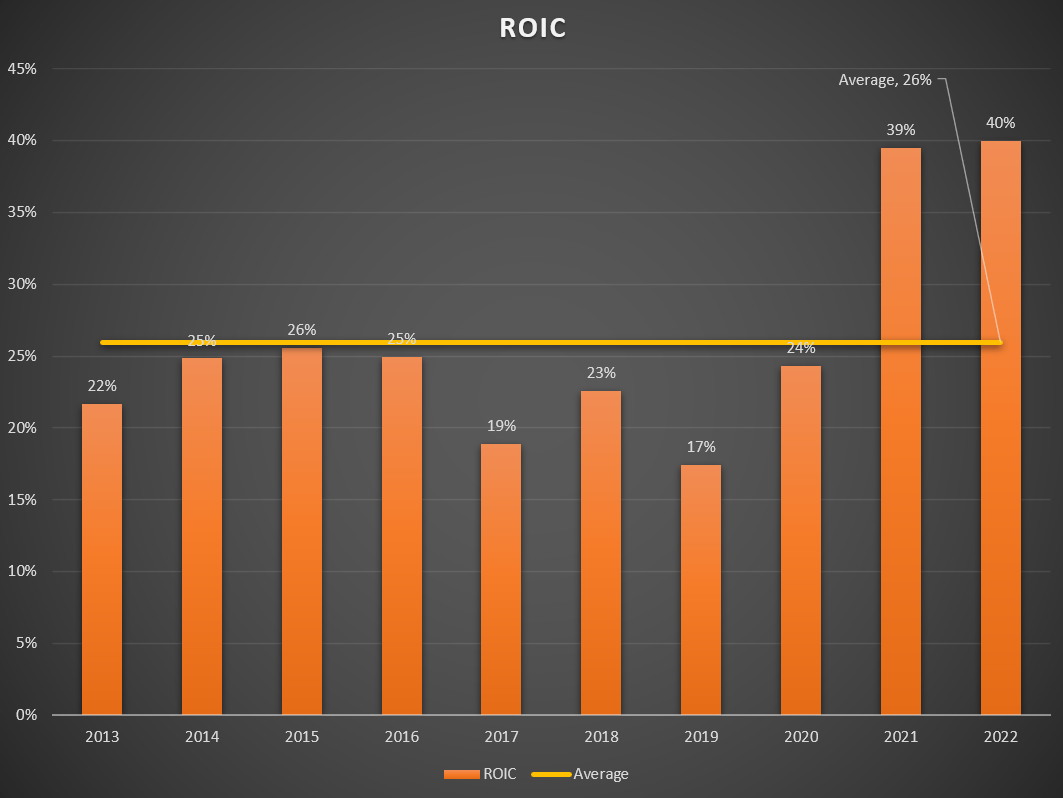
Review
WSM Score (Author)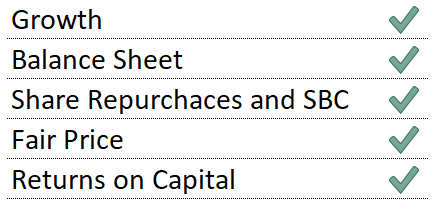
WSM performs very well in these important categories. It has a healthy balance sheet on a Debt/EBITDA basis. Management has done a fine job repurchasing shares and ensuring SBC is not overbearing. The price of the stock is favorable through a corporate DCF analysis. The average ROIC is very high and much larger than the company's WACC, indicating value creation. The only concerning portion is the Growth category. Although positive over the long run, WSM has had a dip in the recent year. But since we factored this deteriorating growth in our DCF, and still see an undervalued stock, it seems like the risk is baked in the stock already. Overall, I assign a "Buy" Rating for WSM.
This article was written by

Analyst’s Disclosure: I/we have a beneficial long position in the shares of WSM either through stock ownership, options, or other derivatives. I wrote this article myself, and it expresses my own opinions. I am not receiving compensation for it (other than from Seeking Alpha). I have no business relationship with any company whose stock is mentioned in this article.
Seeking Alpha's Disclosure: Past performance is no guarantee of future results. No recommendation or advice is being given as to whether any investment is suitable for a particular investor. Any views or opinions expressed above may not reflect those of Seeking Alpha as a whole. Seeking Alpha is not a licensed securities dealer, broker or US investment adviser or investment bank. Our analysts are third party authors that include both professional investors and individual investors who may not be licensed or certified by any institute or regulatory body.
Recommended For You
Comments (1)
