VIG: The $69 Billion Dividend Growth ETF Is Up 8.5% YTD - A Buy?

Summary
- VIG is Vanguard's $69 billion dividend growth fund with a 0.06% expense ratio, 1.90% trailing dividend yield, and 9.89% five-year dividend growth rate.
- In addition to its excellent dividend growth prospects, VIG offers some downside protection in market corrections. I consider it appropriate for moderately defensive investors with modest immediate income needs.
- VIG has gained a solid 11.10% since its Index reconstituted in March. Apple was added that month after the company completed ten consecutive years of dividend growth.
- This article compares VIG's performance and fundamentals alongside SPY and DGRW, WisdomTree's close alternative to VIG that has surpassed my expectations in 2023.
- Looking for a helping hand in the market? Members of Hoya Capital Income Builder get exclusive ideas and guidance to navigate any climate. Learn More »
Sakorn Sukkasemsakorn/iStock via Getty Images
Investment Thesis
Since its Index reconstituted in March, the Vanguard Dividend Appreciation ETF (NYSEARCA:VIG) has been one of the best-performing large-cap dividend ETFs. The well-diversified fund offers investors a nice balance between growth potential and downside protection, and its 8.47% YTD return ranks #12/62 dividend ETFs I track. I recommended VIG in March and again in June, highlighting how VIG traded at a solid discount to the SPDR S&P 500 ETF (SPY) while featuring a similar earnings growth rate. However, the purpose of this article is to update readers on VIG's deteriorating fundamentals. It's not too significant yet, but VIG's holdings had only a moderately successful last earnings season, and its lower allocations to Technology and Communication stocks continue to limit gains. It's still worth buying, but I'd like readers to consider the WisdomTree U.S. Quality Dividend Growth ETF (DGRW) as an alternative. This article compares the fundamentals and returns for all three of these ETFs and hopefully makes your decision on how to prepare for the next market downturn easier. I hope you enjoy the read.
VIG Overview
Key Objective: Capital Appreciation, Not Income
VIG tracks the S&P U.S. Dividend Growers Index, selecting stocks with at least ten consecutive years of dividend increases. Currently, 311 companies qualify, though the Index follows a modified market-cap-weighting scheme that makes VIG primarily a large-cap dividend fund. Additional screening criteria are described on the right in the graphic below.
Morningstar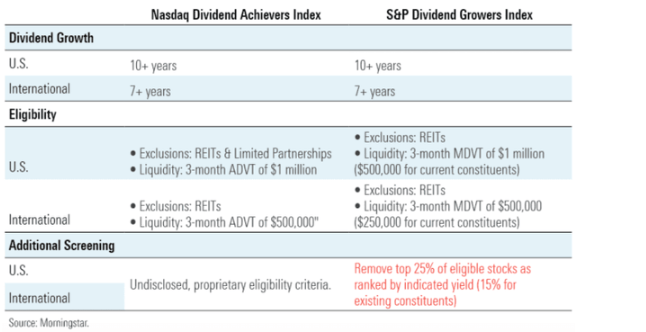
As noted in my June review, the screen that excludes the top 25% of eligible stocks by indicated dividend yield is responsible for most of the Index's annual changes. For example, Exxon Mobil (XOM) qualified this year because its yield was lower than before after its strong price performance. As for the "modified" part of its weighting scheme, constituent allocations are limited to 4%. Otherwise, low-yielding stocks like Apple (AAPL) and Microsoft (MSFT) would dominate the fund and make it more like SPY. In my view, part of the appeal of VIG is that it can deliver market-like returns in bull markets while offering some downside protection in bear markets. Another attractive feature is VIG's low 0.06% expense ratio, tied for second-lowest in the dividend category next to the iShares Core Dividend ETF (DIVB). The Index DIVB tracks recently underwent a substantial change to its selection process and is now more of a high-yield ETF best suited for income investors. In contrast, VIG's 1.90% trailing yield indicates the primary goal is capital appreciation.
Key Exposures
VIG's top ten holdings as of July 31, 2023, are listed below. In addition to Microsoft, Apple, and Exxon Mobil, VIG holds numerous blue-chip Health Care stocks like UnitedHealth Group (UNH), Johnson & Johnson (JNJ), and Procter & Gamble (PG). This top ten list totals 31.31% of the portfolio.
Vanguard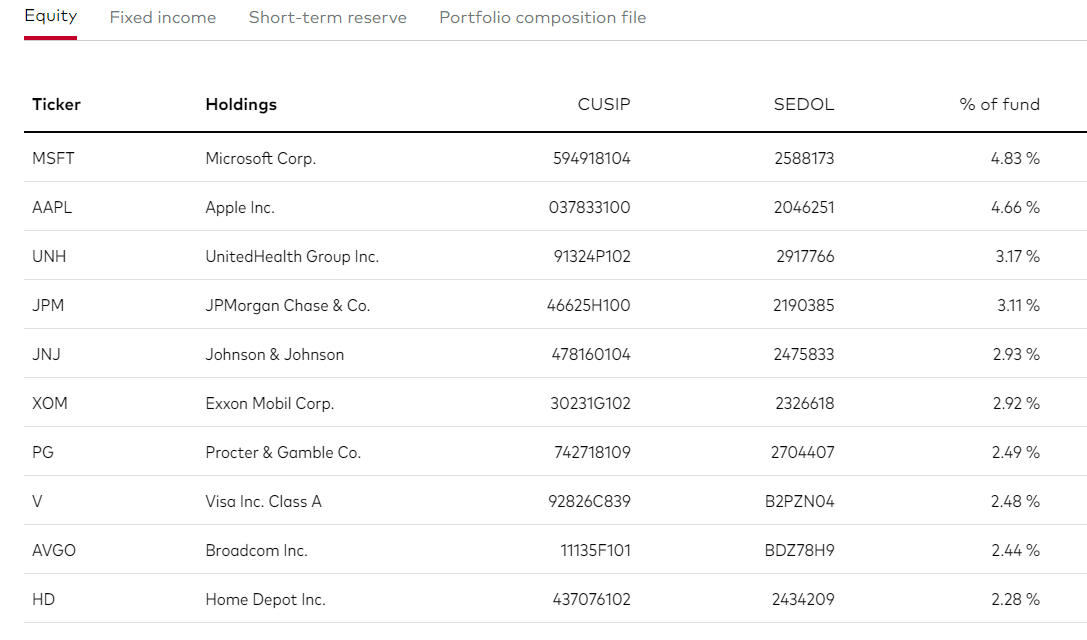
Vanguard will update its holdings as of August 31, 2023, on or around September 15, 2023. However, readers who accept Vanguard's Terms & Conditions can access VIG's Portfolio Composition File on its fund page to derive a holdings list with up-to-date allocations. After converting the number of shares to market value, Johnson & Johnson's weighting is 0.24% less after falling 3.49% in August. Meanwhile, Visa (V) increased its allocation by 0.27% after a solid 3.34% gain in August. Except for when the Index reconstitutes in March, it's unlikely Vanguard's one-month delay in updating its holdings list will have a material impact on any analysis.
VIG's sector exposures are below, alongside SPY and DGRW. DGRW yields 1.86% compared to 1.90% for VIG, and to my surprise, it is having an excellent year. DGRW's high allocation to Technology stocks has driven its 12.31% YTD total return. Since VIG's Index reconstituted in March, DGRW has also outperformed VIG by 1.67% (12.77% vs. 11.10%), so it's an interesting alternative that I'll consider in my fundamental analysis later.
Morningstar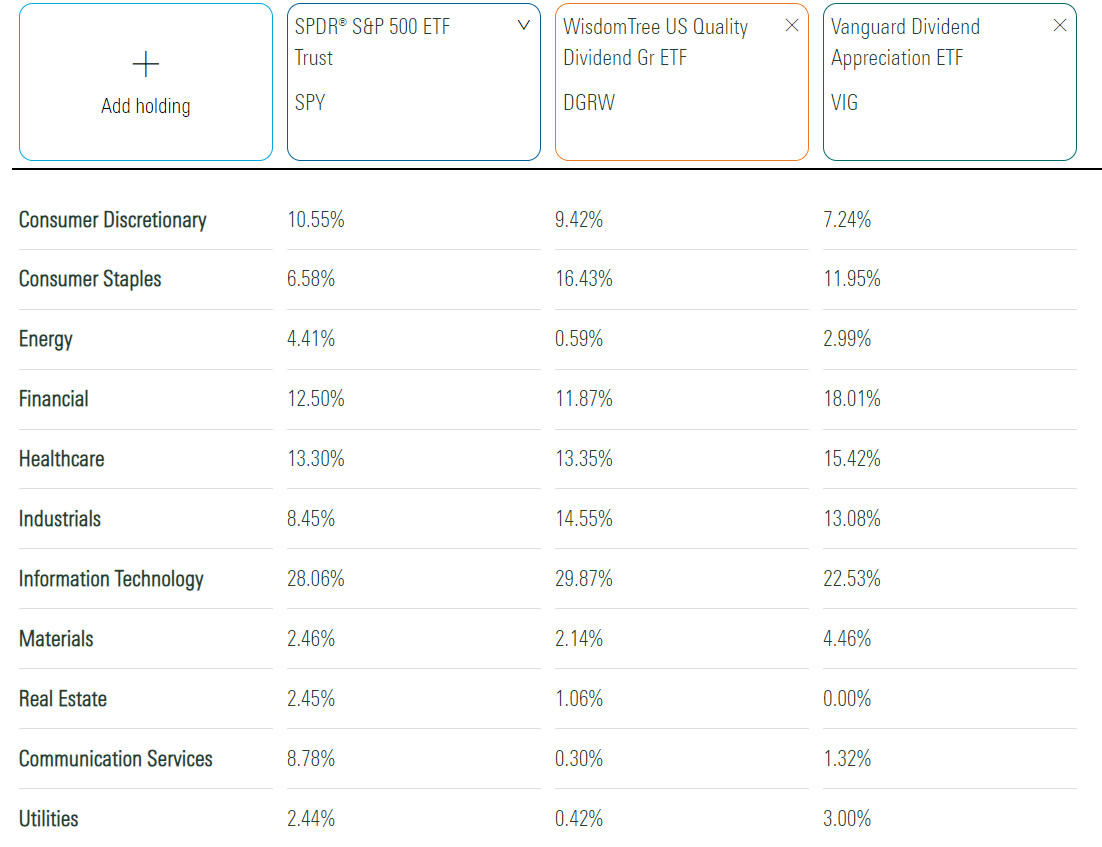
VIG's exposure to the Technology sector is substantial at 22.53% but still 5-7% less than DGRW. VIG also has low exposure to Communication Services and Consumer Discretionary stocks. Given how the Technology Select Sector SPDR ETF (XLK), the Communication Services Select Sector SPDR ETF (XLC), and the Consumer Discretionary Select Sector SPDR ETF (XLY) are up 41.77%, 41.75%, and 32.84% in 2023, these exposures explain a lot of each ETF's YTD returns. VIG also overweights Utilities, and XLU is down 9.31% YTD, the worst of the 11 large-cap sectors.
Performance History
Since June 2006, VIG has slightly trailed SPY by 0.34% per year (9.36% vs. 9.70%), which adds up to a 25.91% total return difference over the 17 years. It's significant over the long run, but as the graph below shows, the two were nearly equal up to 2020. SPY had the edge as growth stocks outperformed after the Q1 2020 crash, and then VIG recovered as markets declined in 2022. With the tech-led recovery in 2023, SPY is up again. I believe this pattern will continue so long as VIG keeps its valuation discount. When I last reviewed it in June, the discount on forward earnings was 4.56 points.
Portfolio Visualizer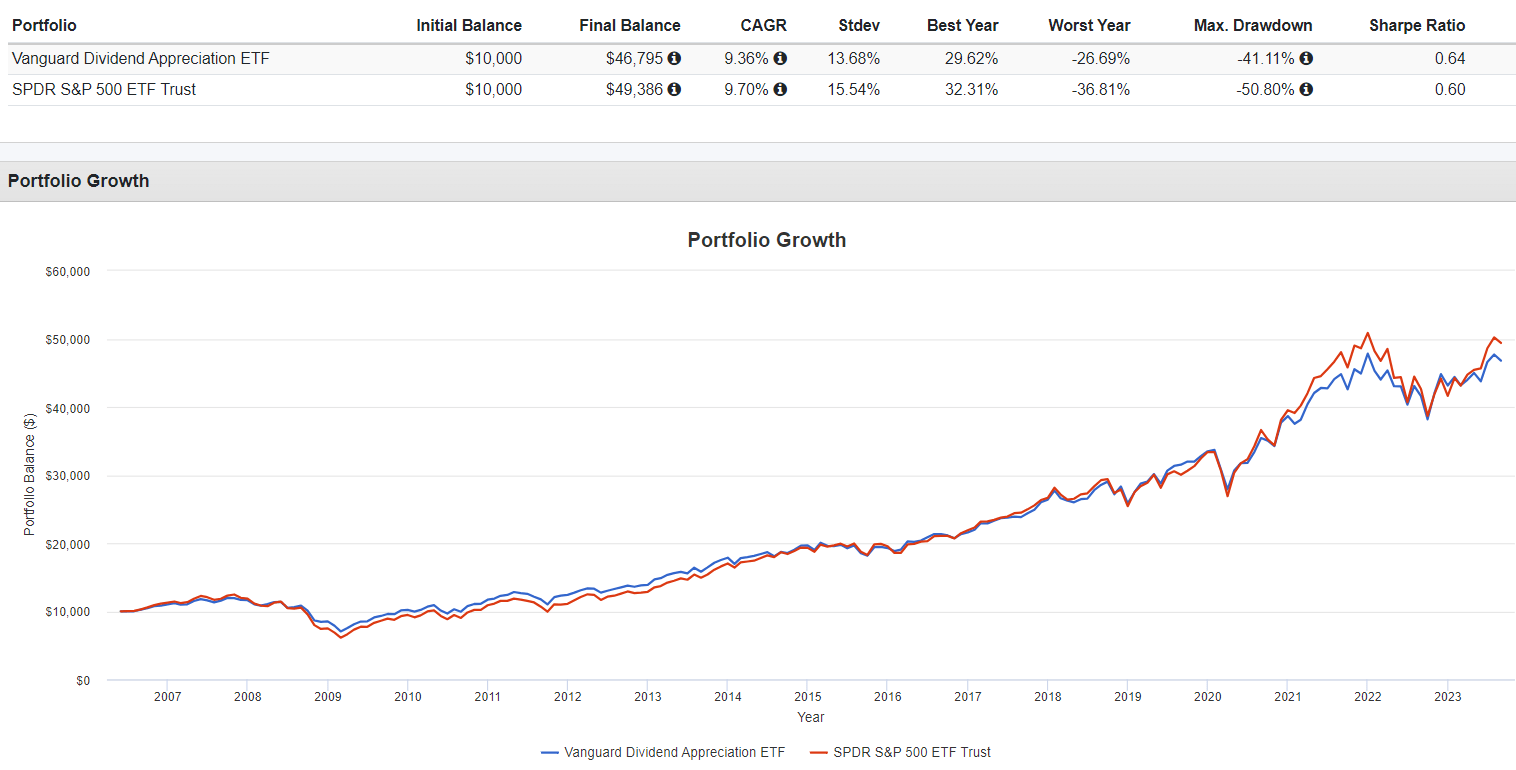
Still, we shouldn't ignore DGRW's strong returns despite its higher 0.28% expense ratio and shorter track record. Launched in May 2013, DGRW has delivered an annualized 12.60% gain compared to 11.18% and 12.45% for VIG and SPY. Again, most of this performance was post-pandemic. As the graph below highlights, VIG, SPY, and DGRW had similar "growth of $10,000" figures before the latter two pulled away. XLK ranked #1, #4, #9, and #1 among the 11 SPDR Select Sector ETFs from 2020-2023. Therefore, you'll first need to decide how much Technology exposure is appropriate, and as always, remember that past performance does not always repeat.
Portfolio Visualizer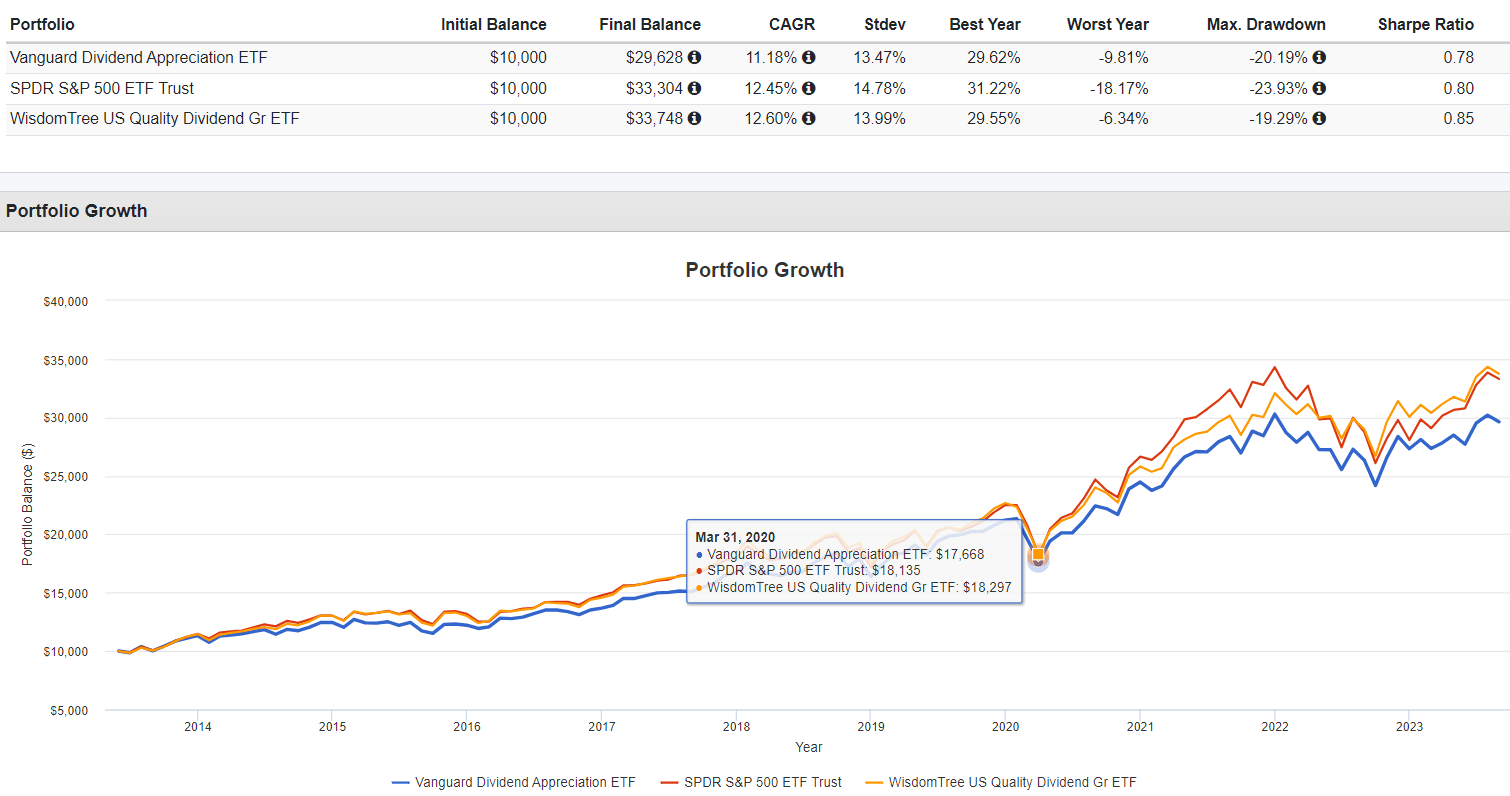
Dividends
Many younger investors find VIG appropriate because of its strong dividend growth track record. As seen below on VIG's Seeking Alpha Dividend Scorecard, VIG has an "A+" Dividend Grade despite a low 1.90% yield. The reason is that it's paid a growing dividend for nine consecutive years, and its 3Y, 5Y, and 10Y dividend growth rates are excellent at 11.75%, 9.89%, and 7.88%. DGRW's "A-" Grade is also good, but its dividend declined in 2020.
Seeking Alpha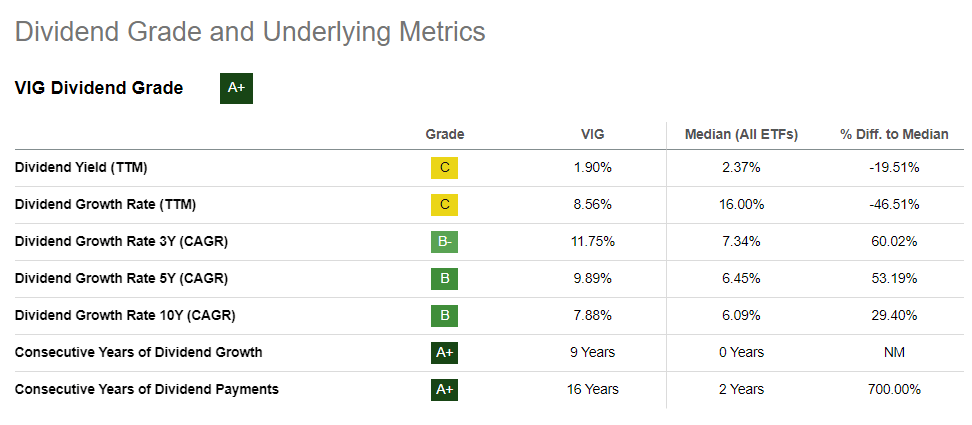
VIG Analysis
Fundamentals By Company
The following table highlights selected fundamental metrics for VIG's top 30 holdings, totaling 59% of the portfolio. I've also included summary metrics for SPY and DGRW in the bottom rows.
The Sunday Investor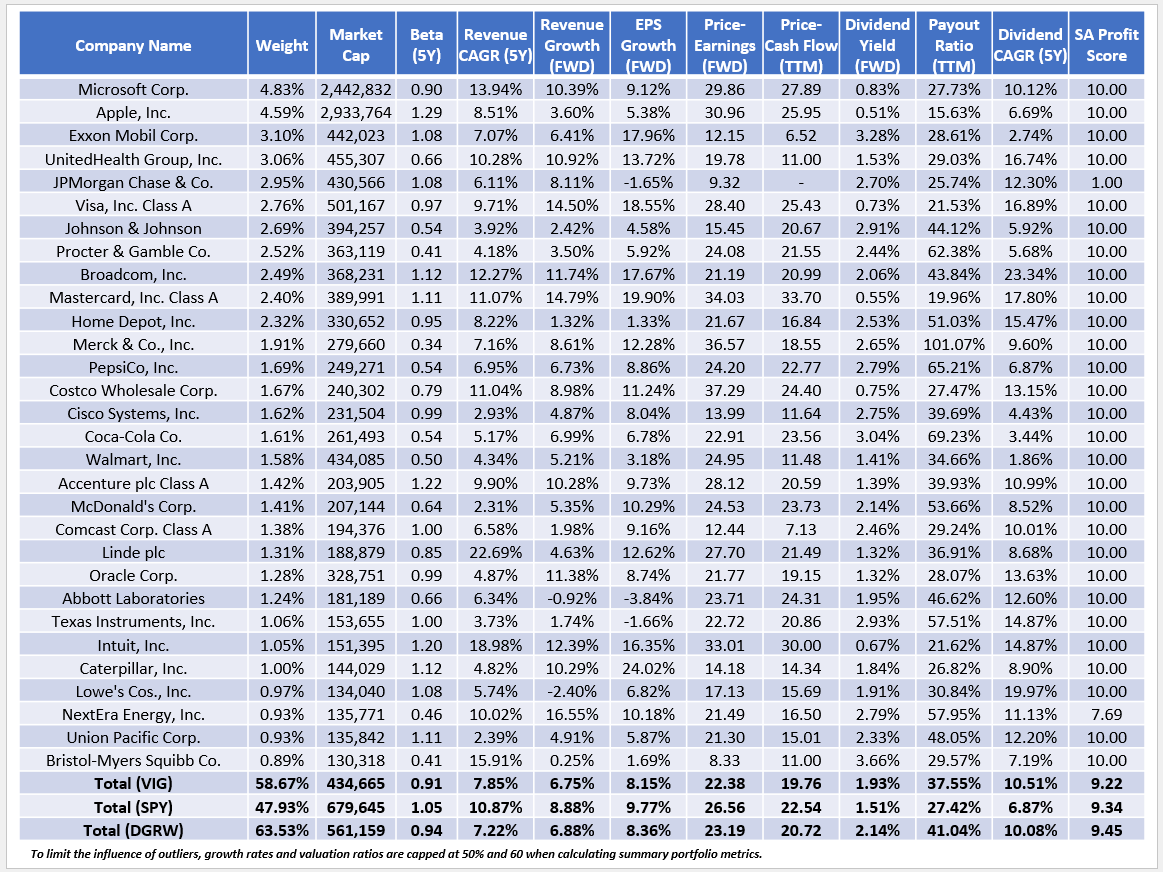
I want to make four observations:
1. VIG's discount on forward earnings decreased from 4.56 points in June to 4.18 points as of August 31, 2023. It's not significant, but its estimated earnings per share growth gap widened from 0.51% (8.12% vs. 8.63%) to 1.62% (8.15% vs. 9.77%). In addition, VIG's estimated sales growth is now 2.13% less (6.75% vs. 8.88%) compared to 1.38% (7.01% vs. 8.39%) in June. In short, VIG's growth expectations have lowered, but prices haven't adjusted accordingly. It could pave the way for some short-term underperformance, but I don't think it's worth worrying about. Instead, it's just disappointing.
2. VIG's constituents have a weighted average 1.93% dividend yield. After subtracting fund fees, investors should net approximately 1.87% at today's price, close to the 1.90% posted trailing yield. SPY's gross dividend yield is 1.51% or 1.42% after fees. S&P 500 Index investors also have the option to choose Vanguard's VOO, iShares' IVV, or State Street's SPLG to lower expenses and boost dividend yield.
3. VIG's constituents have a weighted average 10.51% five-year dividend growth rate partially supported by its 8.15% estimated earnings per share growth rate. Furthermore, its 9.22/10 Profit Score indicates the ETF holds high-quality stocks. Still, SPY's score is superior at 9.34/10, and as a rule of thumb, most large-cap market-cap-weighted ETFs have high profit scores. DGRW is no exception at 9.45/10, and like VIG, its constituents have demonstrated a willingness to increase dividends quickly, not just an ability to do so.
4. DGRW's growth rates and valuation ratios are slightly higher than VIG's. It indicates that it will continue to outperform if the market rises but will underperform in a downturn. That said, it's negligible, and future returns are likely more dependent on how well Technology stocks perform. I'm still cautious, partly because XLK's 41.77% YTD gain is the fourth-highest since 2000. XLK's best year was in 2009, when it gained 51.32%, so there's likely little runway left.
Q2 2023 Earnings Season Summary, Price Returns
The following table highlights sales and earnings surprises for VIG's top 30 holdings and each stock's Seeking Alpha EPS Revision Grade adjusted on a ten-point scale. I use this to measure earnings momentum, as a high score indicates Wall Street analysts are bullish.
The Sunday Investor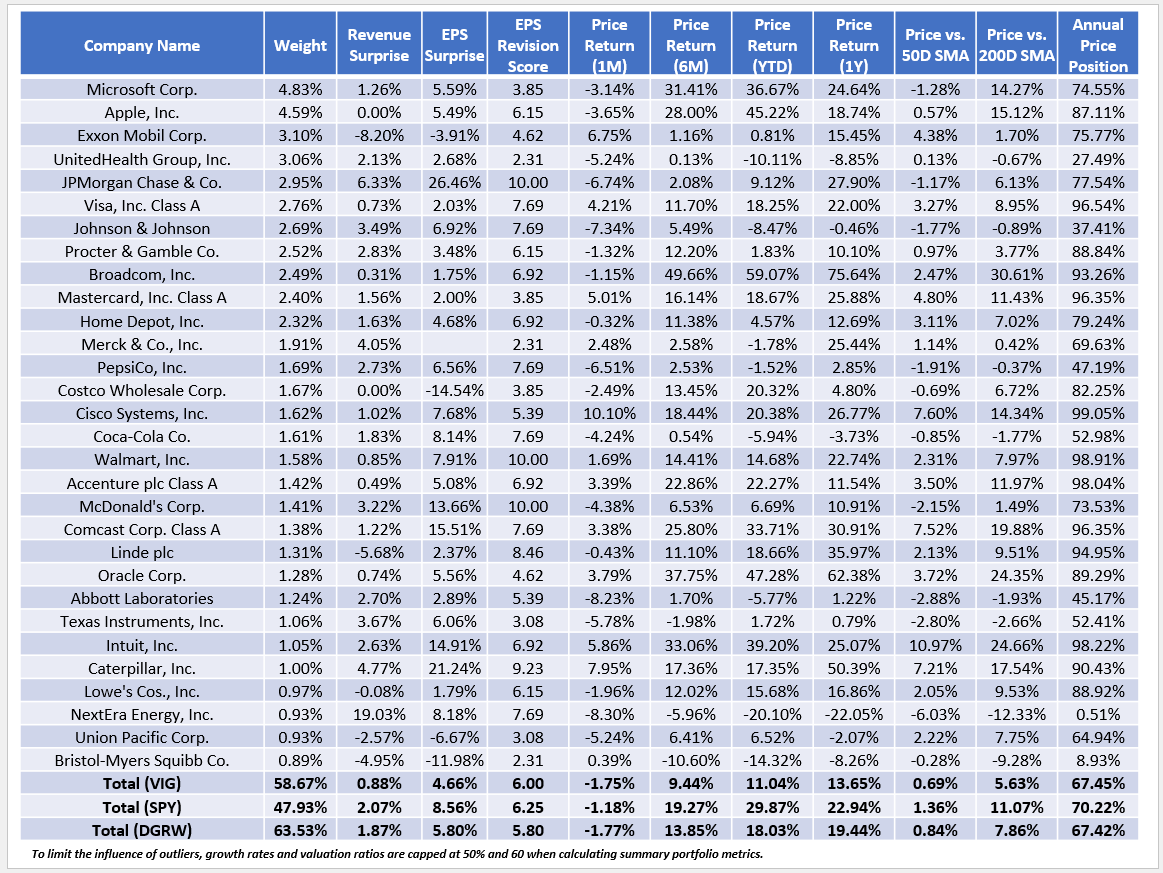
One of the big red flags for me is how Microsoft and Apple reported relatively low sales and earnings surprises last quarter. Unlike the double-digit earnings surprises seen in 2020, these were much softer, contributing to my belief that big-tech stocks are due to pullback. VIG has 9.42% exposure to Microsoft and Apple, while SPY and DGRW have 13.85% and 14.44%, respectively. VIG's lower exposure would be beneficial if my assessment is correct.
At the same time, VIG had only moderate success this earnings season, delivering a weighted average 0.88% and 4.66% sales and earnings surprises. DGRW did slightly better, while SPY performed almost twice as well. Amazon (AMZN) delivered an 89.54% earnings surprise, and Nvidia (NVDA) surprised by 30.65% after beating expectations by 18.80% the prior quarter. The top semiconductor stock pays a small but stable dividend, while Amazon pays nothing, so neither is eligible for inclusion in VIG or DGRW anytime soon. By avoiding these stocks, VIG and DGRW are generally lower-risk funds but offer less growth potential.
One bright spot for VIG is its 6.00/10 EPS Revision Score, which slightly edges out DGRW's 5.80/10. As noted earlier, VIG is well-diversified, so no single industry stands out. However, there's potential in the Health Care Equipment industry, which includes Abbott Laboratories (ABT), Medtronic (MDT), Stryker (SYK), Becton, Dickinson (BDX), ResMed (RMD), STERIS (STE), and LeMaitre Vascular (LMAT). In particular, ABT and MDT are well off their 52-week highs but have decent EPS Revision Grades.
Seeking Alpha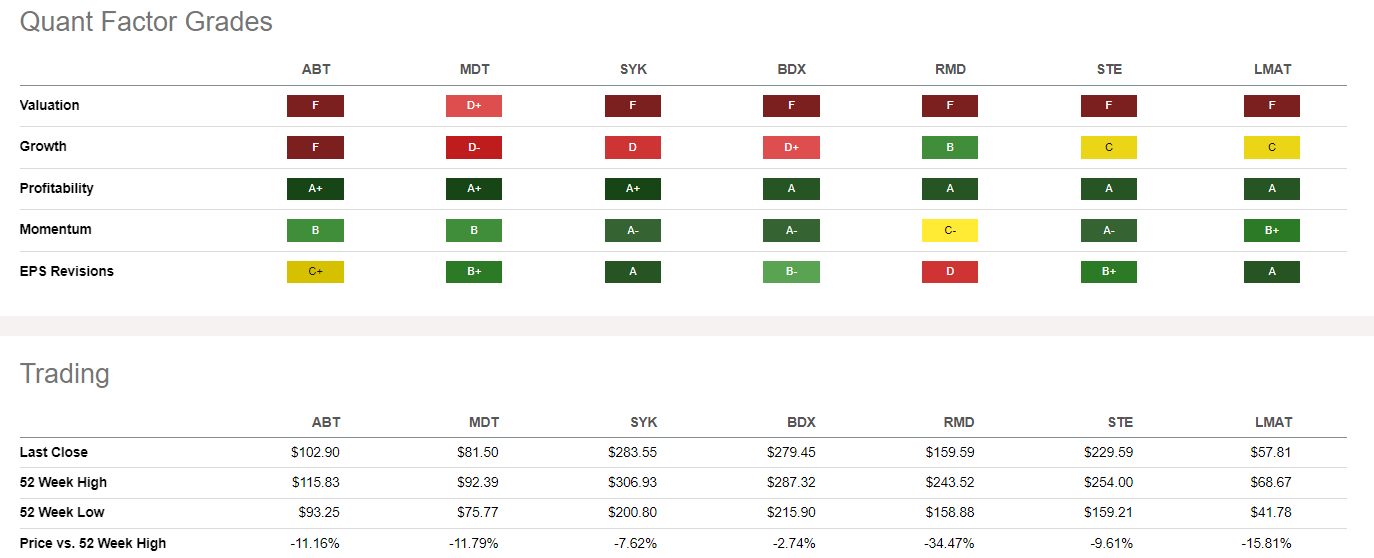
The "Annual Price Position" statistic in the prior table calculates each stock's current price relative to its 52-week high and low price. With this metric, we can see that Johnson & Johnson is another stock trading closer to its 52-week low price that also has a solid EPS Revision Score. In addition, NextEra Energy (NEE) trades near its 52-week low, which I don't feel is warranted, given its solid quarterly results and EPS Revision Score. I discuss large-cap Utility stocks in greater detail in this article.
Finally, remember that VIG underweights the Communication Services sector by 7.46% relative to SPY. Through August 31, 2023, XLC is up 41.75%, good enough for a #2/10 ranking (excluding Real Estate) and just behind XLK's 41.77% gain. Like XLK, there likely is little runway left for XLC. Using Vanguard's VOX to backfill returns for the sector, the current YTD gain would be the best in its 20-year history. The following table highlights the returns and rankings for the ten large-cap sector ETFs over the last decade.
The Sunday Investor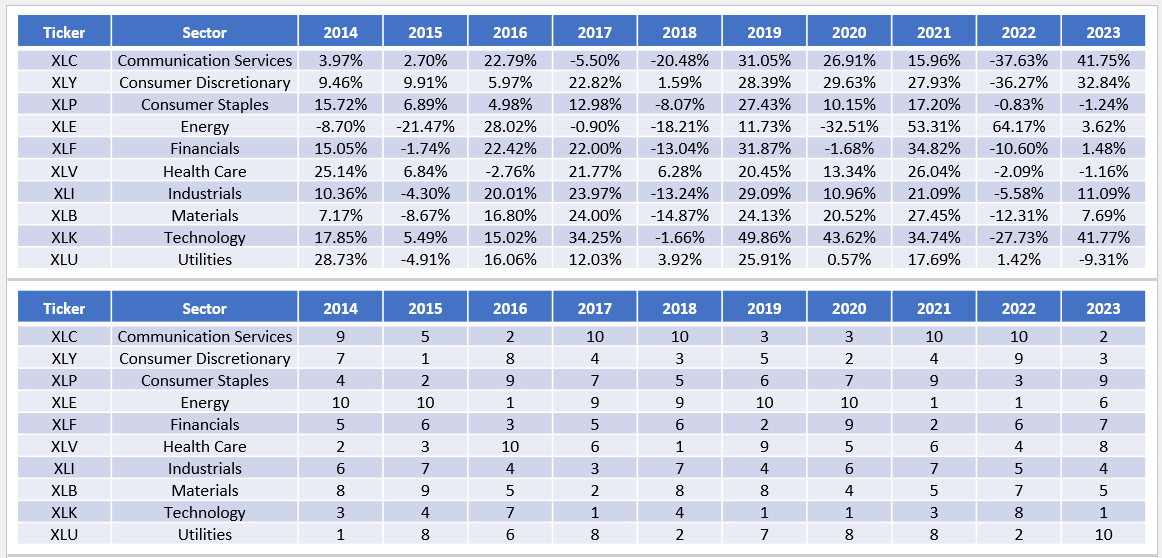
Investment Recommendation
VIG has been a solid dividend ETF this year, though it's underperformed SPY due to its lower allocation to the Technology and Communication Services sectors, which are up 42% YTD. In my view, future gains are limited in these sectors, so VIG remains an excellent option for slightly defensive investors whose primary goals are capital appreciation and dividend growth. VIG's 1.90% dividend yield is not attractive, and its modified market-cap-weighting scheme virtually ensures that will always be the case so long as Microsoft and Apple form part of the Index.
Still, there's no sugarcoating that VIG's fundamentals relative to SPY have deteriorated since my last review in June. VIG's discount on forward earnings narrowed from 4.56 to 4.18 points, and it now offers 1.62% less estimated earnings per share growth compared to 0.51% previously. Furthermore, its constituents delivered a mere 4.66% earnings surprise last quarter, well behind SPY's 8.56%, and hardly enough to get excited over. While I still maintain my buy recommendation, investors should also look closely at DGRW. DGRW has an excellent track record since 2013, and despite my reservations last December, it's the fifth-best-performing dividend ETF 2023, which isn't something I can ignore. Thank you for reading, and as always, I look forward to the discussion in the comments section below.
The Sunday Investor Joins Income Builder
The Sunday Investor has teamed up with Hoya Capital to launch the premier income-focused investing service on Seeking Alpha. Members receive complete early access to our articles along with exclusive income-focused model portfolios and a comprehensive suite of tools and models to help build sustainable portfolio income targeting premium dividend yields of up to 10%.
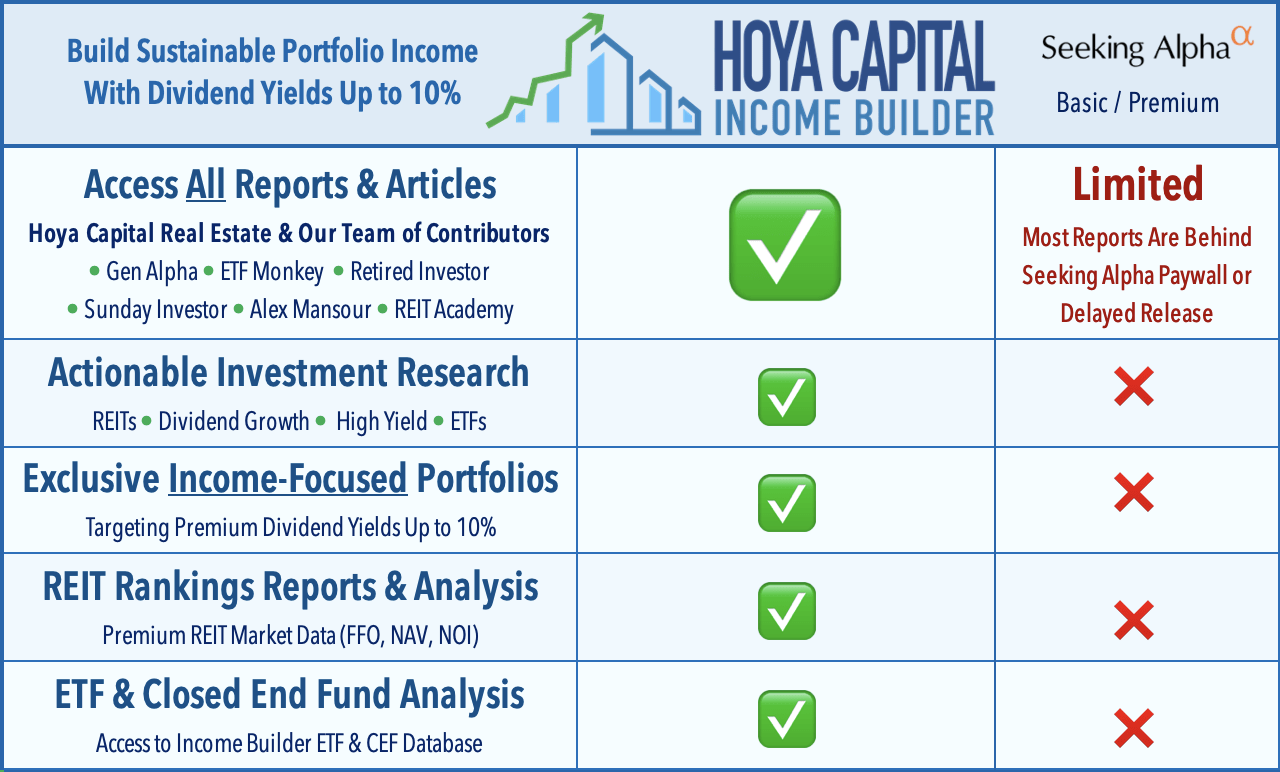
Whether your focus is High Yield or Dividend Growth, we’ve got you covered with actionable investment research focusing on real income-producing asset classes that offer potential diversification, monthly income, capital appreciation, and inflation hedging. Start A Free 2-Week Trial Today!

This article was written by

I perform independent fundamental analysis for over 850 U.S. Equity ETFs and aim to provide you with the most comprehensive ETF coverage on Seeking Alpha. My insights into how ETFs are constructed at the industry level are unique rather than surface-level reviews that’s standard on other investment platforms. My deep-dive articles always include a set of alternative funds, and I am active in the comments section and ready to answer your questions about the ETFs you own or are considering.
My qualifications include a Certificate in Advanced Investment Advice from the Canadian Securities Institute, the completion of all educational requirements for the Chartered Investment Manager (CIM) designation, and a Bachelor of Commerce degree with a major in Accounting. In addition, I passed the CFA Level 1 Exam and am on track to become licensed to advise on options and derivatives in 2023. In November 2021, I became a contributor for the Hoya Capital Income Builder Marketplace Service and manage the "Active Equity ETF Model Portfolio", which as a total return objective. Sign up for a free trial today! Hoya Capital Income Builder.
Analyst’s Disclosure: I/we have a beneficial long position in the shares of VIG, SPY, MSFT either through stock ownership, options, or other derivatives. I wrote this article myself, and it expresses my own opinions. I am not receiving compensation for it (other than from Seeking Alpha). I have no business relationship with any company whose stock is mentioned in this article.
Seeking Alpha's Disclosure: Past performance is no guarantee of future results. No recommendation or advice is being given as to whether any investment is suitable for a particular investor. Any views or opinions expressed above may not reflect those of Seeking Alpha as a whole. Seeking Alpha is not a licensed securities dealer, broker or US investment adviser or investment bank. Our analysts are third party authors that include both professional investors and individual investors who may not be licensed or certified by any institute or regulatory body.
Recommended For You
Comments (2)
