My View Of Wall Street: The Debt Issue

Summary
- Inflation may not be as dead as some believe. At 4% the CORE rate remains "sticky".
- As far as the stock market is concerned, debt isn't a problem until it is. Economic growth is the only way out of this potential time bomb.
- California and New York's economic choices will have ramifications for the entire US economy.
- Perhaps market participants finally realize, "It's Higher for Longer" regarding interest rates.
Dragon Claws/iStock via Getty Images
"The debt is like a crazy aunt we keep down in the basement. All the neighbors know she's there, but nobody wants to talk about her."
Is the debt of the United States a problem or will it become one? Well, history and the opinions of many smart market minds certainly suggest so. According to the U.S. Treasury, the federal government budget has run a surplus only five times in the past 50 years and has not done so since 2001. Otherwise, the budget has been in a constant deficit. Those deficits were funded by issuing debt and the total national debt has consequently ballooned to over $32 trillion.
Everyone has gotten so used to tossing around trillions they often lose their meaning and don't hit home until we add that the government is paying 5 Billion each day to keep things afloat. On a debt-to-GDP basis, we've gone from 52.5% in 1960 to 34.6% in 1980 and back to 56.83% in 2000 and have now hit new levels of extreme borrowing as debt will exceed GDP next year. It is expected to reach 119.14% of GDP by 2033. In other words, our debt levels now exceed the total of what the country produces as a nation. It should not take a Ph.D. in Economics or a CFA charter to grasp that this could potentially cause issues.
It is important to understand, however, that sovereign debt is a little different than corporate or personal debt. Global entities have more options when it comes to servicing and managing that debt, particularly in the case of the U.S. and its massive economy. The government can issue more debt, raise taxes, attempt to "monetize" the debt by "printing" more money and deflating the currency, and if all else fails they can seize and nationalize business and personal assets as a last resort.
They can also cut spending to help bring the debt down over time, but that is political suicide and makes it less likely for those politicians to get reelected. It's a bipartisan issue, too. Both sides bear responsibility for the growing debt load and few running for office do so on a platform of taking things away from voters. Hence, the reason we are in this situation today.
As a result, investment gurus such as Ray Dalio, Stanley Druckenmiller, and Charlie Munger (among others) have all sounded the alarm on the direction we are headed. Munger last year even said that he believes the value of the U.S. Dollar will go to zero within the next 100 years (I'm personally not losing sleep over that today). These money managers are very familiar with the history and the destruction that too much debt eventually causes to nation-states. If there is a nation that can buck that trend, American exceptionalism suggests it would be the United States. Warren Buffett has said that the U.S. will never experience a debt crisis as long as that debt is issued in U.S. dollars. However he does caution against the runaway inflation it could produce, and we have just witnessed that firsthand after the Covid giveaways. At the moment those who refuse to acknowledge the situation, go out kicking and screaming about "cutting" the giveaways will be fighting history and hoping that "this time is different."
Still, it matters less what the credit rating agencies and these market legends think about the debt and more what the market thinks. If the market and its investors collectively believe that the U.S. debt remains the safest investment in the world and that they will receive their principal and interest, then the recent Fitch downgrade isn't going to matter much in the grand scheme of things. When I initially saw the downgrade news, I thought that could start some to start thinking about and addressing the DEBT issues. Yet, all considered, the overall reaction was rather muted. It certainly wasn't like back in 2011 when Standard & Poor's downgraded the U.S. and the S&P 500 fell by almost 7% the following session. There were scant few politicians that came out and called it a wake-up call, indicating that it's business as usual in D.C. Therein lies a problem that's going to affect the MACRO scene shortly.
Moody's, one of the other big three credit ratings agencies, also got into the act recently. They announced that they are putting the credit rating of six major U.S. banks up for review and warned of possible cuts to others'. Such downgrades, both on the sovereign and corporate sides, helped the recent yield surge we just experienced, and will likely help to keep rates higher as investors demand more compensation for assuming the additional risk of loaning capital. As companies and the U.S. government are forced to issue more debt to stay in business as we advance, they will have to do so at higher rates, compounding the problem further.
It's NOT A PROBLEM UNTIL IT IS
Again, all of this isn't an issue until the market decides it is, but the consequences of such a shift in sentiment could be serious. Without the added boost of low interest rates, an increasing money supply, and large federal budget deficits, it will be up to the economy and earnings to organically grow enough to keep the party going. Economic GROWTH is the ONLY way out of this potential time bomb.
If not the powers to be will go right back to the printing press/fiscal stimulus days of the past few years, and it will only kick the can down the road as the problems become even greater. This is one of the reasons why I have been more cautious about adopting the notion that the secular BULL market is about to take another leg higher.
In my view, the U.S. budget problem has arrived, and eventually, the economy and the equity markets are going to begin reacting to the debt spiral. Budget deficits are averaging $2.0 trillion which means that the government must issue an equivalent amount of debt every year to pay its bills. Politicians can no longer kick the can down the road, but as noted a minute ago the reaction to the debt downgrade was a yawn, and that is a troubling sign. We've already covered the fact that interest payments on the debt alone will soon equal social security. Medicare will exhaust its reserves in 2031, all while immigration is allowed to expand exponentially adding more stress to the system. Social Security will follow in 2033. Once its reserves are depleted Social Security benefits will have to be cut by an estimated 23%. I doubt that ever occurs but the other solutions are no less impactful.
Despite the claims that the administration is cutting the deficit, estimates from the CBO (Congressional Budget Office) indicate the budget deficit is poised to exceed $2.0 trillion once again in fiscal 2023 with a string of $2.0-3.0 trillion deficits looming every year for the foreseeable future. And if that is not bad enough, should a recession occur at any point in the upcoming decade the projected deficits will be even larger.
Despite the calls for everyone in America to pay their fair share, make no mistake the deficit problem is not a shortfall of tax revenue. In fact, over the next decade, those revenues are already projected to surpass their average over the past 50 years.
Tax Revenue (www.cbo.gov/topics/taxes)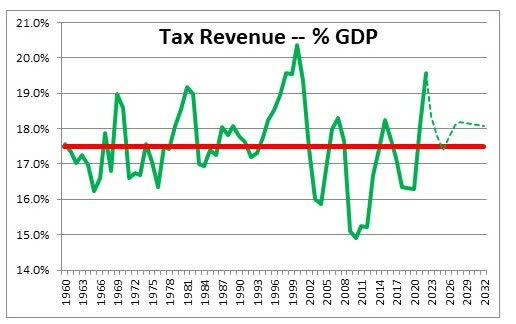
While there is an ever-present onslaught to raise taxes, there is not much room for tax increases to solve the deficit problem. The problem is spending. Government expenditures will average about 24% of GDP compared to their historical average of 20.5%. The solution to the problem is to cut spending.
Given these bloated deficits, the debt outstanding will increase by $2.0-3.0 trillion every single year because that is what the government must do to pay its bills. As a result here is the projection that confirms the debt about GDP will be ~119% by 2033.
Debt/GDP (www.cbo.gov/topics/taxes)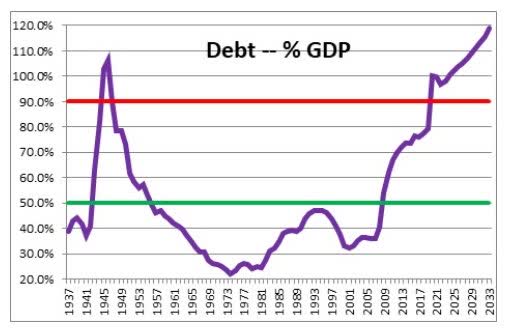
To put this into perspective, the prior record debt to GDP ratio was 106% in 1946. But in the late 1940s, and 1950's government spending plunged because wartime spending ended. That will not happen today because the bloated deficits are caused by excessive spending in general. Furthermore, the pie-in-the-sky spending, loan forgiveness, and increasing benefits for entitlement programs that no longer have work requirements keep expanding. If anyone wonders why I keep railing over the trillions being tossed at the Green energy initiative, Ladies and Gentlemen this is the reason.
It's been deemed that adding ~6-7 million immigrants to the population in less than two years has been the right thing to do. I'm not interested in what anyone's belief is on that topic but understand that will translate into a HUGE cost increase in all of the support systems that cost plenty of money to keep running. The same goes for the support required for the Ukraine war effort. It's a COST that is growing. By itself it is manageable, but add it to all of the other "costs" and it's another item that tips the debt scale. We can now add in the first round of sending military supplies to Taiwan. Millions can turn into billions in a hurry. These are all of the dirty little secrets that no one wants to discuss. Before anyone accuses me of not wanting to assist Ukraine or Taiwan, let me be clear, that is not my intent in mentioning these issues today. The purpose of this exercise is to demonstrate that EVERY cost can no longer be tolerated. I'm not here to voice an opinion, then pick and choose what the US needs to spend money on but someone in power better start doing just that.
Unlike the last time debt to GDP was over 100%, this time around there will be no replay of debt reduction based on the present mindset and the scene I just described. Instead, we are going in the opposite direction. Such a pace is NOT sustainable, but no real solution has been presented for getting that debt down, at least not one that politicians are willing to stomach. We all "get it". No politician ever wants to cut benefits. To do so will negatively impact the income stream for a large number of voters in their district. They regard any cuts to Social Security, and Medicare benefits as the "third rail". Cut them and your term in office will end at the next election.
Like it or not, they will soon need to address these issues AND all of the OTHER spending that is still on the table. The solutions are well known, but the giveaways have become part of a socialist mentality that has gripped the country. Washington DC. has placed itself in a BOX, but they refuse to look for a way out. The last time DC had a debt showdown, there was little appetite for reducing spending. Every effort to cut something was seen as blasphemy in this religion called "spending that makes everyone happy". We are about to enter the twilight zone again with another government funding debate ahead of the September 30 deadline. It will probably be another showdown with one side wanting More and the other wanting Less. Still, it doesn't matter until world investors are no longer willing to fund that debt or require much higher interest rates to do so, making the servicing problem even worse.
Rest assured this DEBT issue has been brewing for years and all inhabitants that write policy in D.C. are responsible. However, instead of realizing the burden and negative effects of COVID spending, and then turning off the spigots, the opposite was done. On top of that, we see how none of this spending is slowing down, it's accelerating with trillions being demanded for "green" initiatives. Denying spending as the real cause of inflation, and not realizing how energy costs negatively impact the inflation scene are both costly mistakes.
Because of the latter point; INFLATION may not be as DEAD as some believe.
Surprisingly, long-term rates remain a tad above where they were before the downgrade, once again going to show that trading the news is usually an exercise in futility. That said, rates were already rising to their highest levels in months before the Fitch news and inflation expectations along with them. There have been many calls that inflation has been defeated and that we will now return to the low-to-no inflation days of the past. However, the market suggests otherwise, with the 5-year Forward Inflation Expectations Rate hitting its highest level in well over a year recently. That isn't really what we'd expect given how many Fed rate hikes we've experienced over that period.
These pesky inflation expectations play right into the "new environment" I have written so much about over the past couple of years, though. Such an environment is characterized by higher inflation, higher rates, more volatility, and less margin for error than we enjoyed over most of the past decade. It isn't just U.S. sovereign debt that is at issue, either. There's frankly too much debt (leverage) all over the place and it will become less manageable as rates rise and stay higher for longer. Credit card debt continues to hit new all-time highs even as credit card interest rates do, too. Student loan payments are about to resume for millions as well. In a strong jobs market with rising wages and ample discretionary income, it's not a huge deal, but, again, there is simply less margin for error now when the economy slows down. In my view with the present policies in place that is a fait accompli.
So when I view the MACRO scene instead of assuming stock prices will keep going higher indefinitely, I have taken a more realistic view. Prices can certainly go higher, and I'll proceed accordingly. However, I think the repercussions of the market situation playing out to the contrary represent too great a risk to ignore. So, when red flags present themselves, I suggest to investors the warnings.
As stated earlier, as far as the Stock market is concerned DEBT isn't a problem until it is.
The Week On Wall Street
After last Friday's reversal that pushed stocks higher, that momentum continued into Monday's session, and when treasury yields reversed and went considerably lower on Tuesday, the risk-on environment was in full swing. The 10-year treasury yield continued to sink, and the stock market rally continued. When Thursday and the end of the month came to a close the S&P500 and day and NASDAQ Composite had their 4-day winning streaks snapped.
Ahead of the three-day weekend, the buyers nor the sellers could take control and the major indices all closed "flat", and they all posted gains for the week.
THE ECONOMY
INFLATION
The PCE inflation indicators (the Fed's preferred indicator) came in as expected.
- PCE Price Index: +0.2% Month over month vs. +0.2% expected and +0.2% prior.
- +3.3% Year over year vs. +3.3% expected and +3.0% prior.
- Core PCE Price Index: +0.2% Month over month vs. +0.2% expected and % +0.2% prior.
- +4.2% Year over year vs. +4.2% expected and +4.1% prior.
At 4%, the CORE rate remains "sticky". Energy prices at these levels of higher is going to make the Fed's 2% target more elusive.
CONSUMER
JOLTS: Job openings tumbled 338k to 8,82k in July, weaker than expected, after sliding 451k to 9,16k in June. Openings are down from the record 12,02k in March 2022 and this is the smallest level since March 2021. The number of jobs available for every unemployed job seeker continues to shrink and is down to a 1.5 to 1 ratio.
Consumer confidence slumped 7.9 points to 106.1 in August, much weaker than forecast, after rising 3.9 points to 114.0 in July. Weakness was in both components. The current conditions index tumbled to 144.8 following a dip to 153.0, while the expectations metric slid to 80.2 after jumping to 88.0. This is an all-around poor report and confirms the message that the
Consumer (www.conference-board.org/topics/consumer-confidence)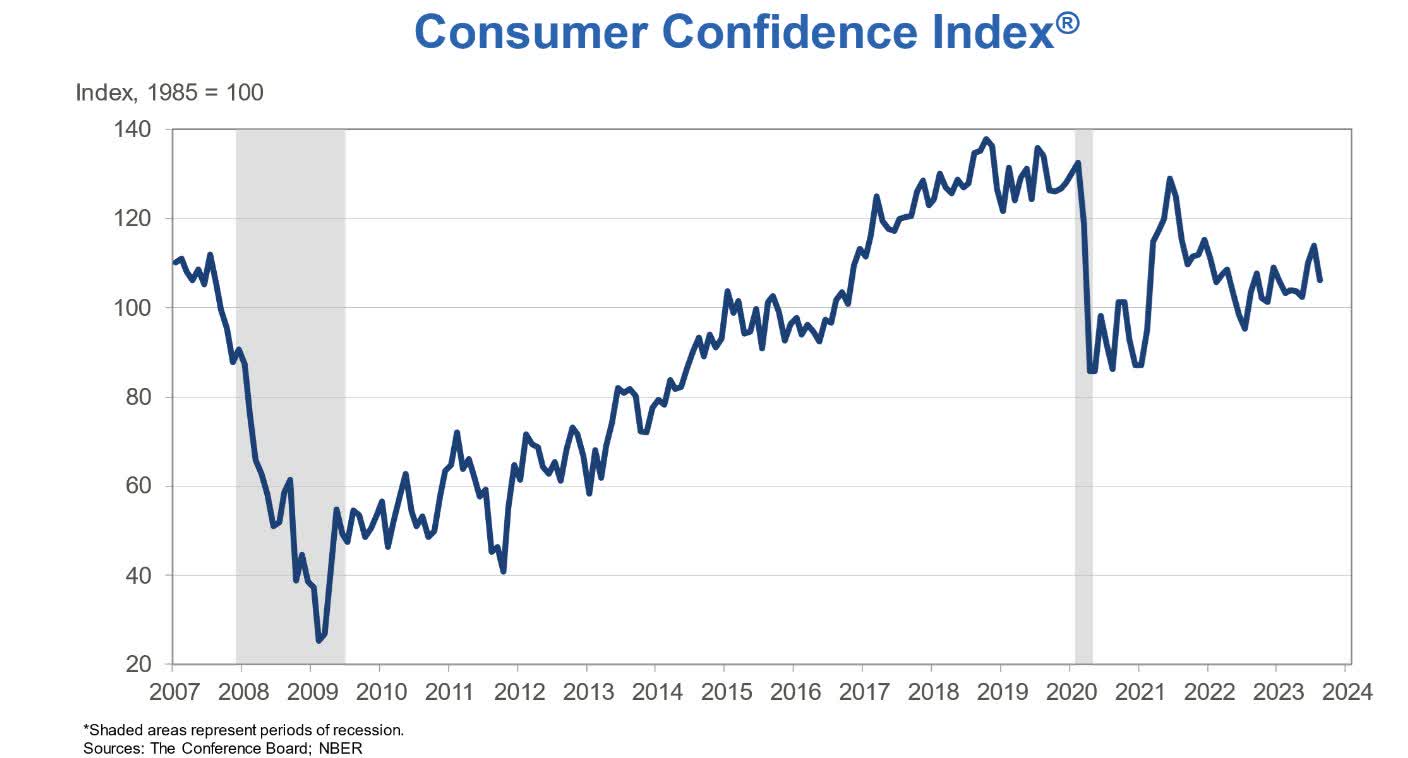
A good reason for the "slump" in confidence;
Gasoline prices are rising, and they are back to levels seen last year when the administration pulled the plug on the SPR releasing millions of barrels onto the market. Since the oil was never replenished, that card can no longer be played. Through Sunday, the national average price of a gallon of gas, according to AAA, stood at $3.82 which is the second highest price for this time of year since at least 2004. The only year that the national average price was higher as of 8/27 was last year ($3.85).
The administration is once again dealing with the dictatorship in Venezuela to increase supply to bring down the cost of oil, and gasoline. U.S. energy producers continue to draw the short straw as regulatory impairments dictate energy policy.
Perhaps someone believes no one will notice that any oil coming from Venezuela has the same or worse impact on the green agenda. At some point, all of this absurdity that defies common sense will come to an end. It's a strategy that impairs US investment and productivity.
The bottom line: stay with the energy trade until common sense and policy change enter the scene. Until then energy prices will remain HIGH. WTI traded at $85/bbl on Friday. That's up from the $70 range in May.
MANUFACTURING
US Manufacturing PMI fell to 47.9 in August, from 49.0 in July, indicating a stronger downturn in operating conditions at US goods producers. The manufacturing sector has contracted every month since November 2022 except for a brief stabilization in April, and the latest PMI reading was in line with the average over this period. Four components of the headline figure had negative contributions in August (the exception being employment), and four had negative directional influences compared with July (the exception being suppliers' delivery times).
U.S. ISM manufacturing index rose 1.2 points to 47.6 in August, stronger than forecast, after edging up 0.4 ticks in July to 46.4. This is the best print since February but is still a tenth straight month below 50. The components were mixed.
The Global Scene
A tale of two Manufacturing worlds.
CANADA
Canada Manufacturing Purchasing Managers' Index remained stuck below the crucial 50.0 no-change mark for a fourth successive month in August. Moreover, dropping to 48.0, from 49.6 in July, the index registered its lowest reading since June 2020 and was consistent with a modest deterioration in operating conditions.
The UK
UK Manufacturing Purchasing Managers' Index posted 43.0 in August, down from 45.3 in July, its lowest level since May 2020 and a reading consistent with a steep deterioration in operating conditions.
EUROZONE
HCOB Eurozone Manufacturing PMI at 43.5 (Jul: 42.7). 3-month high
HCOB Eurozone Manufacturing PMI Output Index at 43.4 (Jul: 42.7). 2-month high
A bounce off the bottom.
INDIA
Rising from 57.7 in July to 58.6 in August, the India Manufacturing Purchasing Managers' Index indicated the second-best improvement in the health of the sector for nearly three years.
JAPAN
The headline au Jibun Bank Japan Manufacturing Purchasing Managers' Index was unchanged at 49.6 in August to indicate a third consecutive deterioration in the health of the Japanese manufacturing sector, albeit one that was only fractional overall.
CHINA
The CAIXIN China General Purchasing Managers' Index rose from 49.2 in July to above the neutral 50.0 threshold at 51.0 in August. This signaled a fresh improvement in the health of the sector, which has strengthened in three of the past four months. Though only mild, the rate of growth was the best seen since February.
When it comes to the Chinese investment scene, China has been its own worst enemy. Perhaps they have realized the error of their ways as they are now trying to stimulate investments in their equity markets. Among a slew of new measures to woo investors to the Chinese stock markets, Beijing has cut the stamp duty on stock trades and also vowed to slow the pace of IPOs (Initial Public Offerings.
Earlier this month, Chinese authorities had urged pension funds, large banks, and other big domestic financial institutions to increase stock investments to support the market. The regulators have also reduced handling fees on stock transactions, allowed mutual fund managers to increase purchases of their equity funds, and encouraged companies to do more share buybacks, said the report.
The stamp duty in China was last cut in April 2008. It was reduced to 0.1% to support the market. In May 2007, China had raised the rate to 0.3% to cool a rally that was drawing more than 300,000 new investors a day. They are now hoping these latest measures will reverse what has been a serious decline in their equity markets.
Later in the week, the stimulus efforts continued as Chinese state banks are now being enlisted to support the economy. China's largest banks are preparing to cut interest rates on existing mortgages and deposits, the latest state-directed measures to shore up growth in the world's second-largest economy.
FOOD FOR THOUGHT
DOMESTIC MIGRATION
It is estimated that ~160 Wall Street firms have moved their headquarters out of New York since the end of 2019, taking nearly $1 trillion AUM (Assets under management) with them, according to data from 17,000 companies compiled by Bloomberg.
A high cost of living, exorbitant taxes, excessive regulations, and rampant crime are the causes of the migration. One of the most prominent is Icahn Capital Management - headed by billionaire corporate raider Carl Icahn - which is among the most prominent firms to leave. In August 2020, the firm left its Manhattan location atop Fifth Avenue's General Motors Building in favor of a 14-story office complex in a Miami suburb.
Paul Singer's Elliott Management has joined many others in leaving for cheaper taxes, lower crime, and wages that are commensurate with a lower cost of living. It's the same story in California for all of the same reasons, and many of those firms have found a new home in Texas.
Why is this important? Both of those states have a big impact on the US economy.
GDP by State (www.visualcapitalist.com/us-economy-by-state/)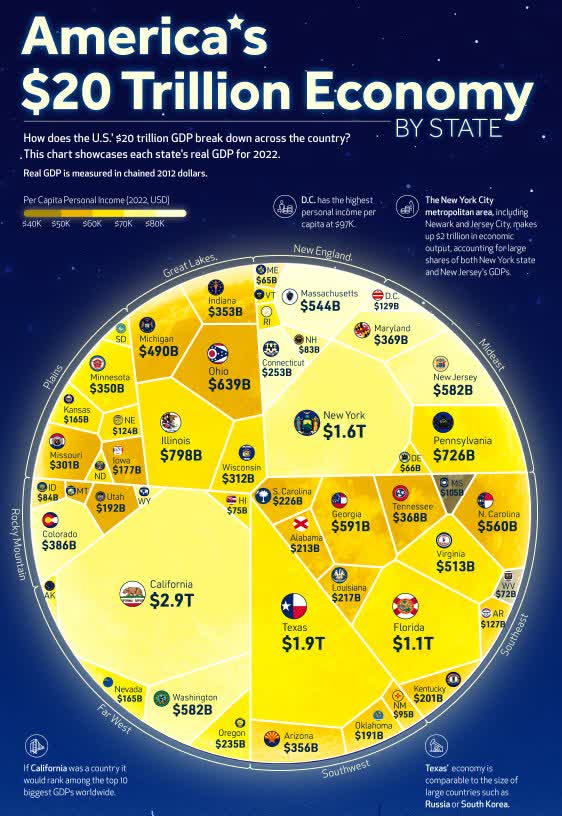
They also receive the most in Federal Aid. It doesn't take a mathematician or an economist to realize when these states run into trouble financially (and that is where they are headed) more Aid will be doled out. These "sanctuary" states are now under the burden of hundreds of thousands of illegal migrants that are costing each state billions. New York City alone is looking at and added $12 Billion expense to support this "issue". With the country already in a debt crisis, what appears to be a simple "shift", can turn into a huge economic problem.
Bottom Line; California and New York have chosen an economic path that unfortunately will have ramifications for the entire US economy. It's certainly an issue that cannot be dismissed lightly.
Another issue driving corporations to greener pastures is "crime". Another dirty secret that no one wishes to discuss. But it comes with a heavy price tag for EVERYONE. It also led to many retailers closing numerous locations in each of these states. Here again that results in lost revenue.
Shrinkage or THEFT?
I've listened to and read EPS transcripts from some of the retailers that have reported recently. Some of you may have heard the word "Shrink" introduced into the conversation, in the case of Dicks Sporting Goods, approximately 1/3 of the EPS miss was due to shrinkage. If you aren't aware some now deem it necessary to label "Theft" as "Shrink". "Thieves" are now called organized units that go around and shoplift or in some cases destroy a store location departing with thousands of dollars in merchandise.
Retailer Five Below (FIVE), spoke to this problem when they reported these comments on their conference call.
The COO;
We also expect higher than originally anticipated shrink levels for the year and have adjusted our guidance accordingly.
I am also leading a team to focus on operational mitigation efforts to counter the elevated shrink trends.
The CFO;
Therefore, we believe it is prudent to increase our shrink reserve for the balance of the year, and we expect a significant impact in the third quarter due to the anticipated year-to-date true-up and higher rate compared to last year."
The approximate 150 basis points of deleverage at the midpoint is primarily due to the anticipated shrink headwind.
What we are listening to is the state of affairs in the retail world today.
Until the Hoodlums and Thieves are taken out of this equation, THEFT will have another negative impact on retailers. Until then brick and mortar retailing faces yet another challenge to their existence. Enter companies like Amazon (AMZN) and Shopify (Shop) to pick up the pieces and be the beneficiaries of the destruction and theft caused by hoodlums.
For sure there are other reasons to own AMZN and SHOP, but they now have a bigger "edge" on their competition that has to deal with what some call "Shrink". Until any brick-and-mortar retailer decides to take POSITIVE steps to stop this trend, rather than ACCEPT it, there is little reason to step in front of another headwind for that sub-sector in the retail group.
The Daily chart of the S&P 500 (SPY)
The rally stalled in August and after a very quick dip that amounted to less than 5% on a closing basis, the S&P 500 was back in rally mode.
S&P 500 (www.tc2000.com)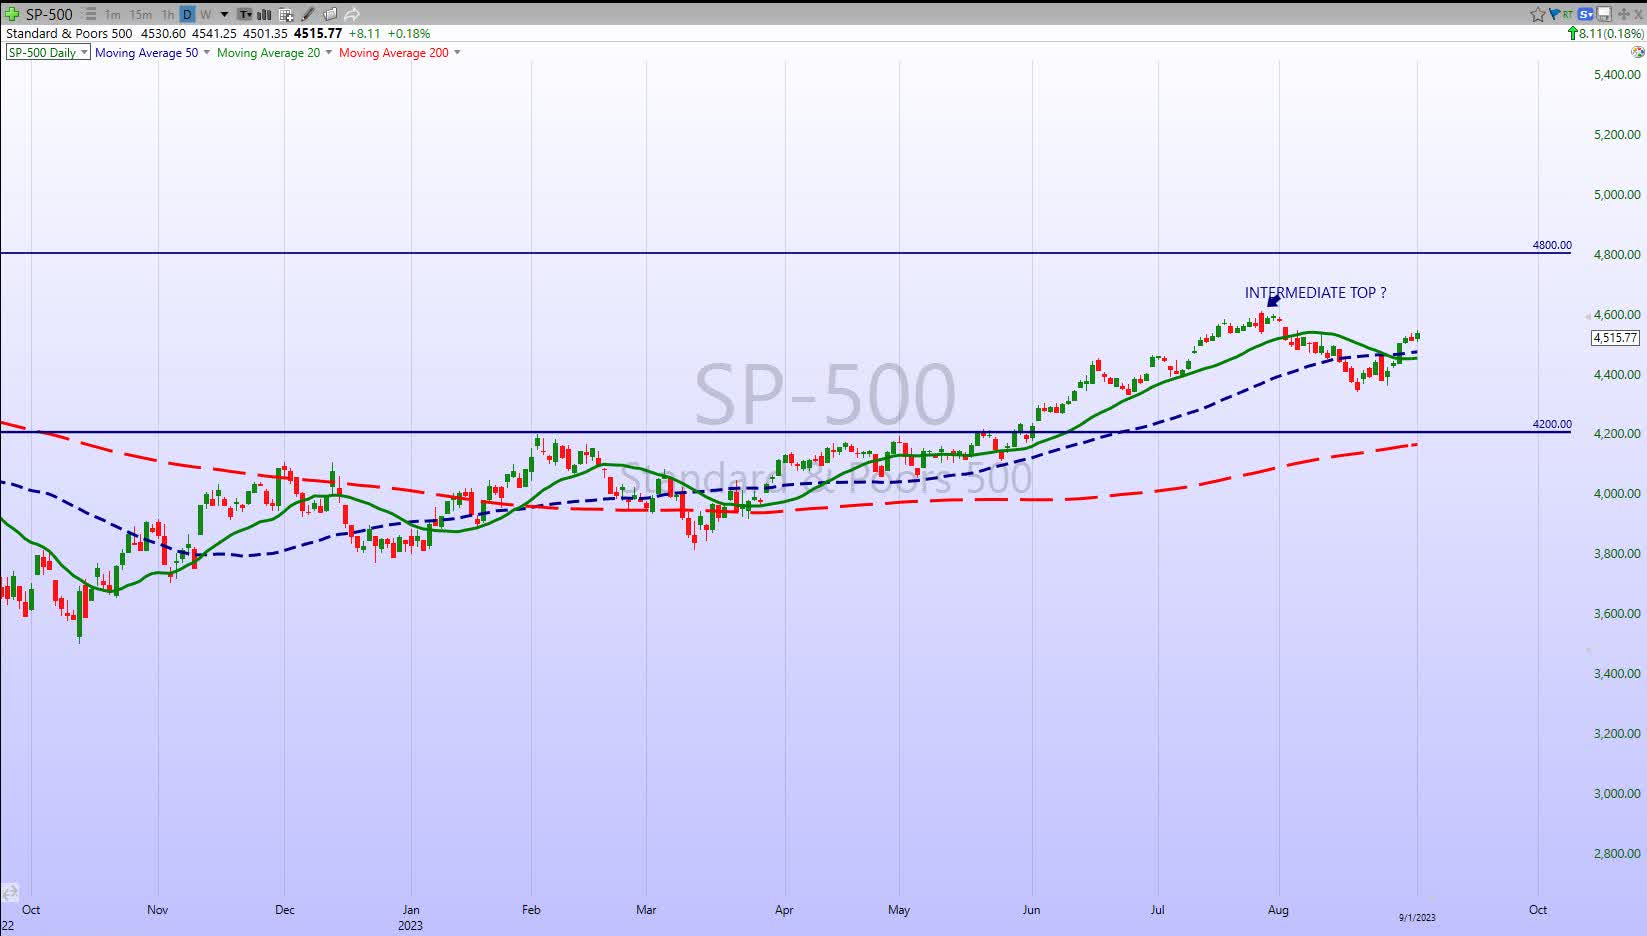
The recent former closing high at 4688 could become a crucial "Pivot point", that could decide how stocks trade going into year-end. With the index quickly retaking the trend lines shown on the chart, the near term takes on more of a Bullish "look".
INVESTMENT BACKDROP
Investors were awaiting the Nvidia (NVDA) EPS report and were hoping a positive report might swing the poor August mode back into a positive tone. After the company posted another spectacular quarter we can now say that while the AI transition won't happen overnight it certainly is real. NVDA is growing in terms of billions. The initial reaction saw the entire AI group sell-off as investors came to find out that for now, this initial AI phenomenon has been priced in and it was priced to "perfection". So instead of kicking off another AI rally The S&P and other indices continued their slide. But that story wasn't over just yet.
I've mentioned that the equity market would be a slave to the action in treasuries, and this past Tuesday was a good example of what I was referring to. Treasury yields dipped and stocks rallied. The 10-year traded down to 4.12%, and when we consider that just a few days before that the 10-year appeared ready to break out at 4.34% - that was welcome news for equity investors.
This action also confirms the notion that the resistance levels I spoke about for the 10-year treasury have held. Perhaps the rally to a yield of 5% that some expected can now be placed on hold. If last Tuesday marked the end of the Treasury yield rally (high probability) and the end of this "dip" in stocks, it followed what I've forecasted - pullbacks will be contained. So, on a closing basis, this dip in the S&P comes in at 4.7%. On Friday the 10-year treasury closed at 4.09%.
Once Treasury yields cratered, it was 'risk-on', and there is no better way to "play" than to get back into the "AI trade". The Energy trade also dominated the week and I believe we can expect to see both sectors continue to "work". During August we've labored in a "summertime" environment where trading desks are operating with skeleton crews. That will slowly change during the first week or two after Labor Day. More than likely we'll get our clues as to what the end of Q3 and Q4 looks like.
August is in the books, and as many forecasted, the month was challenging for the BULLS. Despite the final week rally, it was a period where every index gave back a portion of their gains. However, this latest dip has hardly put a dent in the big gains for the year. The small caps led the way down losing 5%. It's a laggard that continues to lag.
August Results (www.seekingalpha.com/mp/1232-the-savvy-investor/articles)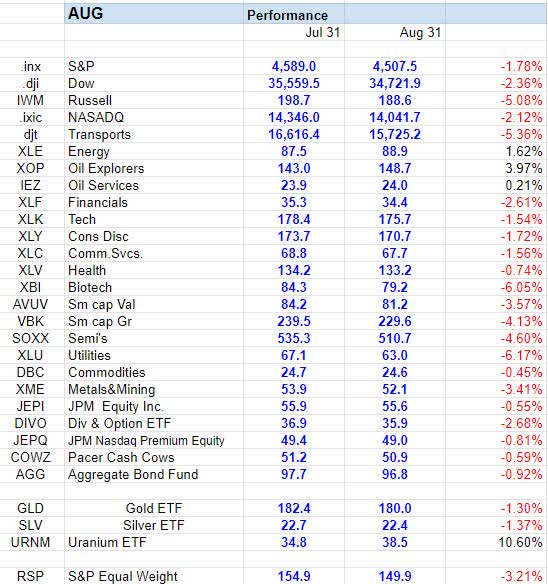
However, there are lagging areas of the market that are leading. For the month, only Energy (XLE) and Healthcare (XLV) posted gains, and if you remember they were poor performers in the first half. Financials are another area that hasn't followed the plan with a 2% loss in August, but in the Q3 performance chart below they have slightly outperformed the indices in the quarter.
After a poor first half, Energy (XLE) has been the clear winning Q3, easily beating everything else.
Q3 Results (www.seekingalpha.com/mp/1232-the-savvy-investor/articles)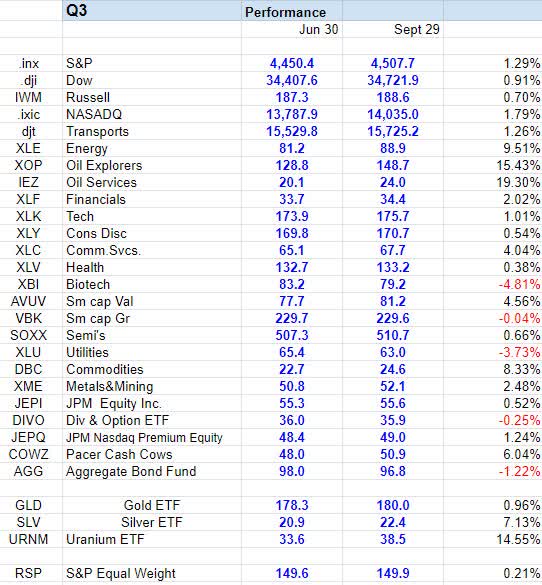
The Metals have done OK in Q3, with Silver and Uranium posting respective 7% and 14% rallies.
This latest rally in Energy has wiped out all the losses this year and added the sector to the list of winners for the year. Healthcare, Biotech, and utilities are still in the red. While there was some giveback in Technology, it remains the top dog as far as the YTD results. The tech sector (XLK) and the semiconductors are up 41% and 46% respectively in '23.
YTD Results (www.seekingalpha.com/mp/1232-the-savvy-investor/articles)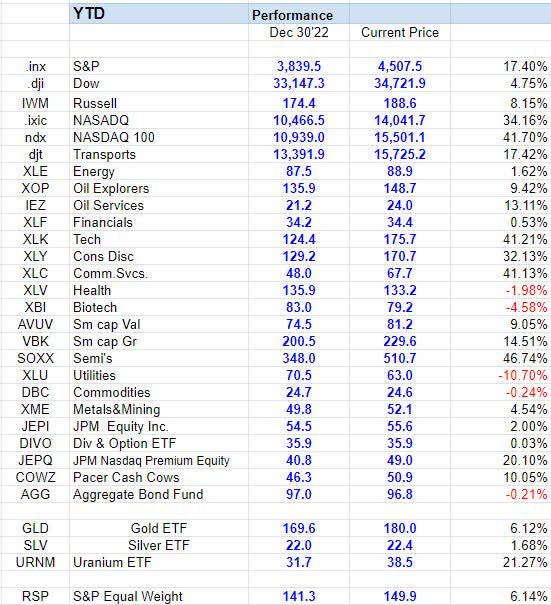
That holds true at the index level as well with the NASDAQ and NASDAQ 100 on top of the heap with performance that doubled the S&P's 17% return in '23. The S&P equal-weighted ETF started to outperform in July but with this renewed interest in the semis and the magic mega caps it has underperformed for Q3 and is running about 11% behind the S&P 500.
SMALL CAPS
When we speak about "failures" the Russell 2000 (IWM) is certainly the leader in failed rallies. Before we overreact, we also have to note that each time the IWM retreats it does find support that holds. Stepping back and taking a look at the longer-term picture, we see a range that has been established since April '22. The next move that can break this range (up or down), will signal the next longer-term direction of the small caps. Until then it's a sloppy mess that keeps traders both happy and busy.
SECTORS
CONSUMER DISCRETIONARY
Despite the sector's (XLY) outperformance in '23, there are still pockets of opportunity that the market is giving investors. I was able to pick up one such gem on Tuesday that rallied 13% since purchase. Savvy Investors celebrated a positive month in what was a difficult backdrop for the BULLS.
ENERGY
I've stayed with the Energy group (XLE) because the long-term BULLISH trend remained in place. That continues to pay dividends. While the short term has been an UP and DOWN ride, we now see the sector make another attempt to break out of the top end of the trading range.
Bottom line- I continue to hold Energy with an Overweight positioning.
NATURAL GAS
The volatile trading pattern has been filled with false breakouts and breakdowns since March. At these levels, I'm committed to UNG as a longer-term holding, while waiting for the eventual upside breakout.
FINANCIALS
More red flags, as the complex moved lower as rates rose. Based on what one bond portfolio manager I correspond with has said, if the 10-year U.S. Treasury yield were to rise to 5-6%, which isn't too ludicrous considering the Fed Funds rate is currently in the 5.25-5.50% range, it would start to blow things up. The price action reflected those concerns.
But as fast as you can say, J.P. Morgan, the treasury yield rally turned into a rout with the 10-year yield dropping off a cliff, and the group saw some renewed life. However, there is a long-term downtrend line that indicates a series of LOWER highs that date back to the ALL-time high.
Banks are starting to take on a look that negates their near-term bullish setup. During this year we witnessed trading that moved the sector back into a BULLISH configuration, but that is now in jeopardy. It's another 'issue" that keeps me from declaring stocks (in general) are ready to embark on a new leg of a BULL market that takes the indices to greater highs.
COMMODITIES
GOLD (GLD), SILVER (iShares Silver Trust ETF (SLV) Stock Price Today, Quote & News), and URANIUM (Global X Uranium ETF (URA) Stock Price Today, Quote & News)
GOLD held support recently challenged and overcame near-term resistance and is now stabilized. The "dip" looks to be complete. The longer-term chart is bullish and I'll HOLD my CORE position.
SILVER has been an area of the market that has produced a few nice trades this year. I've been in sync with the price action by using the charts to establish, and then bail out of trading positions. To that end, I rang the register again this week pocketing another quick 9% on a 'trade". In the meantime, I'll continue to hold my CORE position.
While GOLD and SILVER display more of a short-term sideways pattern, URANIUM has been in an uptrend since I started trading the metal in MARCH. The last trade was successful and I now HOLD the CORE position as the metal challenges the 52-week high.
The longer-term view is very BULLISH. After making several "higher lows" over the past year, it now looks primed to possibly break out to the upside. I still believe that nuclear power is currently the best solution for a transition to a cleaner base energy load, and more nations appear to have gotten on board with that over the past couple of years.
HEALTHCARE
Nothing has changed much in the Healthcare sector (XLV). A sideways trading range with a slight lean to the upside. The opportunities will be in individual stocks within the group, and I continue to prefer select names in the medical device sub-sector. One such favorite is Intuitive Surgical (ISRG). While it's been in the playbook for a while, I gave this out to members as a "BUY" late last week due to the chart setup. Shares are up 10.5% since that price alert.
BIOTECH
As noted in the past couple of weeks rising interest rates are poison for a sector (XBI) that is because they are reliant on access to the capital markets. When it becomes more expensive to do so, the biotechs are seen as a bad place to be. The sector has carved out a large trading range between $75 and $90, and Fridays close at $79 leaving the ETF at the lower end of that range. Now that rates have dropped, it may be a good time to pick out some winners in this group after they have been sold off. Aggressive traders have their parameters set for them and can use this setup to establish a "trade". I maintain a CVORE position in (XBI) and own other small Biotech stocks.
TECHNOLOGY
Semiconductors Sub-Sector
It has been a great year to own this group, but you might be surprised to learn since January '22 the Semiconductor ETF (SOXX) has been down ~8%. After last year's debacle, investors witnessed a rebound that started in January of this year, then AI mania induced another boost to the group in May.
What appears to be another break to higher levels since then appears to have been a "false" move. There is still time for this sub-sector of Technology to continue its uptrend, However, given the enormous move this year probabilities suggest a trading range might come next. The worst-case scenario takes the group lower and adds another question mark to the veracity of this general market embarking on another next leg higher.
International Markets
Everyone Hates China but The Prior Lows Have Held
When "everyone" hates a certain investment area and fear appears to be rampant, it's enough to at least get and keep me interested in looking for an investment opportunity. Technically, China's stock market (at least the various China Large-Cap ETFs) has carved out the "look" of a potential bottom over the past year to go along with plenty of fear and bearishness. That "bottom" setup remains in place for now despite the recent fear. For those interested in International exposure this is an area to watch. The vehicle I've chosen for exposure to China is the KraneShares Chinese Internet ETF (KWEB). It is early in development, but this technical pattern shows more of a Bearish to Bullish reversal pattern taking shape.
FINAL THOUGHTS
Rather than thinking in terms of "bull" and "bear" markets, I find it more helpful to think in terms of a series of risk vs. reward setups. I have expressed my concerns with the bigger picture risk vs. reward setup, but that does not preclude high-quality buy setups on other time frames that may be worth getting more aggressive. That is what I referred to earlier. Many individual setups do not reflect what has taken place in the indices. That is where short-term opportunities lie., and of course how you handle that depends on YOUR situation.
THANKS to all of the readers that contribute to this forum to make these articles a better experience for everyone.
Best of Luck to Everyone!
ENJOY the Holiday weekend!
Learn how the Stock market works. August has been a tough month to navigate but the SAVVY Investor Marketplace Service is closing out the month with gains. Whether you are "trading" this market or in it for the long term, SAVVIES come to realize you have to recognize the MACRO scene FIRST. That determines everything, and answers the gnawing question - "What next for the markets in Q4?"
I'm working on providing those answers for you right now.
Consider joining the Savvy Investor Marketplace service at a NEW reduced rate.

Start your Free Trial today.
This article was written by

INDEPENDENT Financial Adviser / Professional Investor- with over 35 years of navigating the Stock market's "fear and greed" cycles that challenge the average investor. Investment strategies that combine Theory, Practice, and Experience to produce Portfolios focused on achieving positive returns. Last year I launched my Marketplace Service, "The SAVVY Investor", and it's been well received with positive reviews. I've been part of the SA family since 2013 and correctly called the bull market for over 8+ years now.
MORE IMPORTANTLY, I recognized the change to the BEAR MARKET trend in February '22.
Since then investors that followed my NEW ERA investment strategy have been able to survive and profit in this BEAR market. Winning advice that is well documented, helping investors to avoid the pitfalls and traps that wreak havoc on a portfolio with a focus on Income and Capital Preservation.
I manage the capital of only a handful of families and I see it as my number one job to protect their financial security. They don’t pay me to sell them investment products, beat an index, abandon true investing for mindless diversification or follow the Wall Street lemmings down the primrose path. I manage their money exactly as I manage my own so I don’t take any risk at all unless I strongly believe it is worth taking. I invite you to join the family of satisfied members and join the "SAVVY Investor".
Analyst’s Disclosure: I/we have a beneficial long position in the shares of LONG EVERY STOCK/ETF IN THE SAVVY PLAYBOOK either through stock ownership, options, or other derivatives. I wrote this article myself, and it expresses my own opinions. I am not receiving compensation for it (other than from Seeking Alpha). I have no business relationship with any company whose stock is mentioned in this article.
Any claims made in this missive regarding specific Stocks/ ETF’s and the performance contained in this report are fully documented in the Savvy Investor Service. This article contains my views of the equity market, it reflects the strategy and positioning that is comfortable for me. ONLY MY CORE positions are exempt from sale today. Of course, that is subject to change, and may not be suited for everyone, as each individual situation is unique. Hopefully, it sparks ideas, adds some common sense to the intricate investing process, and makes investors feel calmer, putting them in control. The opinions rendered here, are just that – opinions – and along with positions can change at any time. As always I encourage readers to use common sense when it comes to managing any ideas that I decide to share with the community. Nowhere is it implied that any stock should be bought and put away until you expire. Periodic reviews are mandatory to adjust to changes in the macro backdrop that will take place over time. The goal of this article is to help you with your thought process based on the lessons I have learned over the last 35+ years. Although it would be nice, we can't expect to capture each and every short-term move.
Seeking Alpha's Disclosure: Past performance is no guarantee of future results. No recommendation or advice is being given as to whether any investment is suitable for a particular investor. Any views or opinions expressed above may not reflect those of Seeking Alpha as a whole. Seeking Alpha is not a licensed securities dealer, broker or US investment adviser or investment bank. Our analysts are third party authors that include both professional investors and individual investors who may not be licensed or certified by any institute or regulatory body.
Recommended For You
Comments (12)

Yet this week you’ve exceeded even your usual outstanding educational writing.
I could “feel” the passion in your coverage of the unquestionable “elephants in the room.” The national debt and it’s primary cause: out of control government spending.
Wish there were some hope but the politicians have found they can keep themselves in office with more and more spending. You point out so many examples. Yet with the debt now marching towards $33 Trillion, and interest payments on that debt at startling levels, just this week the Administration’s finding yet more ways to a) remove more former students from loan repayments they contractually signed to repay for their self-benefitting college educations, b) declared “climate emergency” that of course needs the one magic bullet, more tax payer emergency and ongoing spending, c) more taxpayer funded $$s military industrial complex weapons to Ukraine, d) average spending in New York estimates of $10,000 per month per illegal immigrant, or $420,000 per year each, and many more, mentioning only one other d) huge tax payer $$$ billions/trillions eventually that redistribute tax payer hard earned dollars to Communist China, our greatest threat and adversary, as it controls up to 95% of metals and minerals that supply darlings of solar panels, wind turbines, and EV batteries.
These debt/GDP levels are at major war time levels, like WW II, perhaps never before seen in time of US peace.
Thanks again Steve.
Stock went from around $300 to mid $80’s…. I’ll take my chances at home.

Take away the can and then lets see what they do. Nothing! Nothing...continues to be done. Stop the Spending and make government smaller, but nothing changes. They just find something else to kick around (meaning steal from).
Folks will need to have it actually affect them some how to get the message.
One would think it should be soon...... Hope you have a delightful long weekend. Rose:))
Holding steady and up ~2% without dividends and up 7.5% with them.
Teasing of course. Always appreciate and learn from you excellent contributions.

