Ames National: High Dividend Yield Does Not Appear To Be Worth It

Summary
- Following the first half's disappointing performance, I've reduced my estimate for the net interest income for this year.
- I'm now expecting earnings to dip by 39% YoY. Previously, I was expecting a decline of 11%.
- ATLO is offering a high dividend yield of 5.9%. The current market price is close to the year-ahead target price.
- High unrealized losses make the risk level moderately high.
JonGorr
Earnings of Ames National Corporation (NASDAQ:ATLO) will most probably plunge this year on the back of continued margin pressure. I'm expecting the company to report earnings of $1.30 per share in 2023, down 39% year-over-year. Compared to my last report on the company, I've reduced my earnings estimate because I've reduced both my margin and loan growth estimates. Ames National is offering a very high dividend yield but the price upside is low. Therefore, I'm maintaining a hold rating on Ames National Corporation.
Margin Likely to Fare Slightly Better in the Second Half
Ames National Corporation's earnings have plunged so far this year mostly because of a sharp rise in interest expenses. Part of the surge in these expenses was attributable to a hike in expensive borrowings. Total borrowings rose to $145 million by the end of June from $80 million at the end of December 2022. An increase in deposit rates across the board was also responsible for the higher cost.
At the same time, the average earning asset yield increased only slightly because most of Ames National's assets are insensitive to rate changes. At the end of December 2022, only around 39% of the loan portfolio consisted of variable-rate loans or fixed-rate loans that would've matured in 2023, according to details given in the 10-K filing (this information hasn't been updated in the quarterly 10-Q filings). Due to the combined effect of sticky asset yields and a surge in the cost of funds, the net interest margin shrank by 25 basis points in the first half of the year. This was worse than what I had projected in my last report on the company.
Going forward, I'm expecting the pressure on the margin to somewhat ease because rate hikes have slowed down of late and become lower in magnitude. Further, I'm expecting only a 25 basis points hike in the fed funds rate for the remainder of the year.
Bankrate.com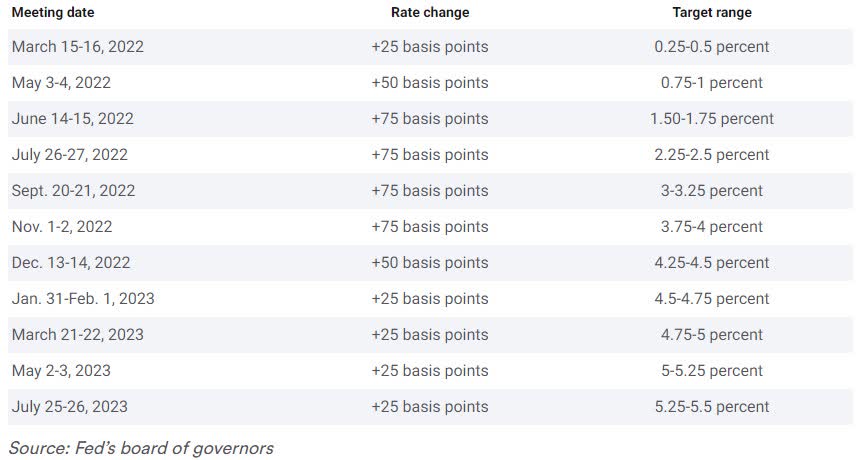
Overall, I'm expecting the margin to dip by four basis points in the second half of the year. Compared to my last report on the company, I've reduced my margin estimate for 2023 partly because the first half's performance missed my expectations. Further, I'm now expecting a reduction in the second half of the year while previously I wasn't expecting much change. This is because the up-rate cycle is likely to last longer than what I previously anticipated.
Better Loan Growth Likely in the Second Half
Loan growth in the second quarter was better than the first quarter but still quite low. The portfolio grew by 0.7% during the second quarter, which missed my previous expectations.
Going forward, I'm expecting loan growth to improve from the second quarter's level because of the trend visible through the last two years. Historically, the second half of the year has been better than the first half for Ames National in terms of loan growth.
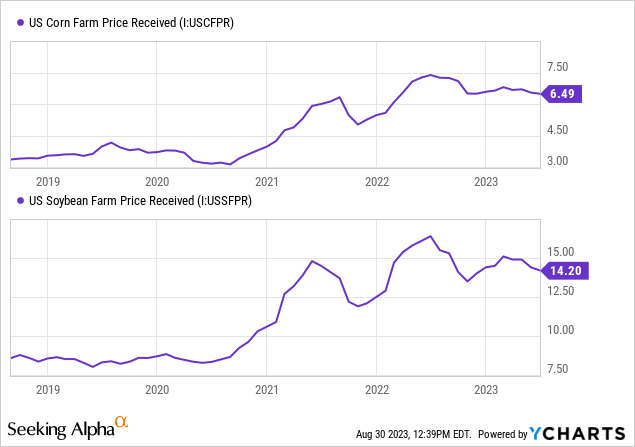
Further, macroeconomic trends seem to be in favor of loan growth. Agriculture and agricultural real estate loans altogether make up 20% of total loans. Therefore, agricultural commodity prices are a good predictor of loan growth in the near term. Compared to previous years, prices are quite high.
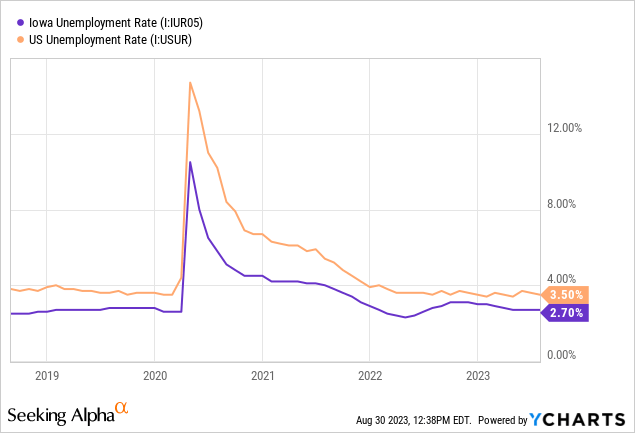
Further, Ames National operates through six banks in Iowa. Therefore, the state's unemployment rate is also a good gauge of credit demand.
In my last report, I estimated that loan growth will slow down to 4% in 2023. Seeing the first half's performance, it now seems like Ames National will be unable to meet my previous expectations. As a result, I've decided to reduce my full-year estimate to 2.6%. The following table shows my balance sheet estimates.
| Financial Position | FY18 | FY19 | FY20 | FY21 | FY22 | FY23E |
| Net Loans | 890 | 1,048 | 1,130 | 1,144 | 1,226 | 1,258 |
| Growth of Net Loans | 15.4% | 17.7% | 7.8% | 1.3% | 7.2% | 2.6% |
| Other Earning Assets | 489 | 595 | 768 | 921 | 813 | 862 |
| Deposits | 1,221 | 1,493 | 1,716 | 1,878 | 1,898 | 1,901 |
| Borrowings and Sub-Debt | 55 | 47 | 40 | 43 | 80 | 148 |
| Common equity | 173 | 188 | 209 | 208 | 149 | 157 |
| Book Value Per Share ($) | 18.6 | 20.3 | 22.9 | 22.8 | 16.5 | 17.4 |
| Tangible BVPS ($) | 17.2 | 18.6 | 21.2 | 21.2 | 14.9 | 15.8 |
| Source: SEC Filings, Earnings Releases, Author's Estimates(In USD million unless otherwise specified) | ||||||
As I've revised downwards both my loan growth and margin estimates, my updated net interest income estimate is much lower than my previous estimate.
Reducing the Earnings Estimate
In my last report, I projected earnings to decline by 11% year-over-year in 2023. I'm now anticipating a decline of 39% because the net interest income has missed my expectation by a large amount during the first half of the year. In light of the first half's disappointing performance, I've also reduced my net interest income estimate for the second half of the year. The following table shows my income statement estimates.
| Income Statement | FY18 | FY19 | FY20 | FY21 | FY22 | FY23E |
| Net interest income | 42 | 45 | 55 | 56 | 53 | 45 |
| Provision for loan losses | 1 | 1 | 6 | (1) | (1) | 1 |
| Non-interest income | 8 | 9 | 11 | 11 | 10 | 9 |
| Non-interest expense | 28 | 32 | 37 | 37 | 39 | 39 |
| Net income - Common Sh. | 17 | 17 | 19 | 24 | 19 | 12 |
| EPS - Diluted ($) | 1.83 | 1.86 | 2.06 | 2.62 | 2.14 | 1.30 |
| Source: SEC Filings, Earnings Releases, Author's Estimates(In USD million unless otherwise specified) | ||||||
Unrealized Losses are the Major Source of Risk
Ames National reported unrealized losses of $75.7 million on its Available-for-Sale securities portfolio. To put this number in perspective, $75.7 million is a hefty 49% of the total equity balance. Apart from these unrealized losses, the riskiness appears normal. Ames National's loan portfolio is well-diversified among different segments; however, the geographical diversity is limited. The deposit book also carries low risk. As mentioned in the 10-Q filing, uninsured deposits excluding deposit accounts collateralized by pledged assets represented just 16% of total deposits as of June 30, 2023.
Dividend Appears Safe
The dividend payout ratio shot up to 95% in the second quarter as the company earned only $0.28 per share and paid out the usual $0.27 per share to shareholders. Nevertheless, I'm not worried that Ames National will cut its dividend because of the following factors.
- I'm expecting earnings to be better in the last two quarters compared to the second quarter of this year. Therefore, for the full year, I'm projecting a dividend payout ratio of 83%, which is uncomfortably high but not impossible to maintain. Any reasonable management would prefer to ride out tough times (the current up-rate cycle) rather than send a negative signal by cutting dividends, as long as the payout is not more than the earnings.
- The capital appears to be at an adequate level. The company reported a total capital-to-risk-weighted asset ratio of 14.3% as opposed to a minimum regulatory requirement of 10.50%. Therefore, the dividend doesn't seem to face much threat from regulatory requirements.
The current quarterly dividend of $0.27 per share implies an attractive dividend yield of 5.9%.
Maintaining a Hold Rating
I'm using the historical price-to-tangible book ("P/TB") and price-to-earnings ("P/E") multiples to value Ames National. The stock has traded at an average P/TB ratio of 1.36 in the past, as shown below.
| FY18 | FY19 | FY20 | FY21 | FY22 | Average | |
| T. Book Value per Share ($) | 17.2 | 18.6 | 21.2 | 21.2 | 14.9 | |
| Average Market Price ($) | 28.6 | 27.1 | 21.2 | 24.3 | 23.1 | |
| Historical P/TB | 1.66x | 1.46x | 1.00x | 1.15x | 1.55x | 1.36x |
| Source: Company Financials, Yahoo Finance, Author's Estimates | ||||||
Multiplying the average P/TB multiple with the forecast tangible book value per share of $15.8 gives a target price of $21.6 for the end of 2023. This price target implies a 17.6% upside from the August 29 closing price. The following table shows the sensitivity of the target price to the P/TB ratio.
| P/TB Multiple | 1.16x | 1.26x | 1.36x | 1.46x | 1.56x |
| TBVPS - Dec 2023 ($) | 15.8 | 15.8 | 15.8 | 15.8 | 15.8 |
| Target Price ($) | 18.4 | 20.0 | 21.6 | 23.2 | 24.8 |
| Market Price ($) | 18.4 | 18.4 | 18.4 | 18.4 | 18.4 |
| Upside/(Downside) | 0.3% | 9.0% | 17.6% | 26.2% | 34.8% |
| Source: Author's Estimates |
The stock has traded at an average P/E ratio of around 12.1x in the past, as shown below.
| FY18 | FY19 | FY20 | FY21 | FY22 | Average | |
| Earnings per Share ($) | 1.83 | 1.86 | 2.06 | 2.62 | 2.14 | |
| Average Market Price ($) | 28.6 | 27.1 | 21.2 | 24.3 | 23.1 | |
| Historical P/E | 15.6x | 14.6x | 10.3x | 9.3x | 10.8x | 12.1x |
| Source: Company Financials, Yahoo Finance, Author's Estimates | ||||||
Multiplying the average P/E multiple with the forecast earnings per share of $1.30 gives a target price of $15.7 for the end of 2023. This price target implies a 14.3% downside from the August 29 closing price. The following table shows the sensitivity of the target price to the P/E ratio.
| P/E Multiple | 10.1x | 11.1x | 12.1x | 13.1x | 14.1x |
| EPS 2023 ($) | 1.30 | 1.30 | 1.30 | 1.30 | 1.30 |
| Target Price ($) | 13.2 | 14.5 | 15.7 | 17.0 | 18.3 |
| Market Price ($) | 18.4 | 18.4 | 18.4 | 18.4 | 18.4 |
| Upside/(Downside) | (28.4)% | (21.3)% | (14.3)% | (7.2)% | (0.1)% |
| Source: Author's Estimates |
Equally weighting the target prices from the two valuation methods gives a combined target price of $18.7, which implies a 1.7% upside from the current market price. Adding the forward dividend yield gives a total expected return of 7.5%. Hence, I'm maintaining a hold rating on Ames National.
This article was written by

Analyst’s Disclosure: I/we have no stock, option or similar derivative position in any of the companies mentioned, and no plans to initiate any such positions within the next 72 hours. I wrote this article myself, and it expresses my own opinions. I am not receiving compensation for it (other than from Seeking Alpha). I have no business relationship with any company whose stock is mentioned in this article.
Seeking Alpha's Disclosure: Past performance is no guarantee of future results. No recommendation or advice is being given as to whether any investment is suitable for a particular investor. Any views or opinions expressed above may not reflect those of Seeking Alpha as a whole. Seeking Alpha is not a licensed securities dealer, broker or US investment adviser or investment bank. Our analysts are third party authors that include both professional investors and individual investors who may not be licensed or certified by any institute or regulatory body.