SPXN Vs. VOO: Avoiding Financials Without Losing Return

Summary
- Investors can now remove financials from their allocation while maintaining exposure to the rest of the S&P 500 Index through the ProShares S&P 500 Ex-Financials ETF.
- The Vanguard S&P 500 ETF is a good Large-Cap ETF to own as a Core holding in one's equity allocation.
- Removing financials and real estate from the S&P 500 Index has had little effect on return or risk data but has resulted in slight shifts in market cap and style factors.
- Both ETFs get a Buy rating from me but for different purposes within a portfolio.
- Looking for more investing ideas like this one? Get them exclusively at Hoya Capital Income Builder. Learn More »
AlexSecret
Introduction
After the banking crisis in early 2023 and for those who lived thru the 2008-09 GFC that was triggered by the collapse of Lehman Brothers and the need for bailouts of other major financial institutions, investors were introduced to funds that excluded those assets from their mix.
For investors who own an ETF like the Vanguard S&P 500 ETF (NYSEARCA:VOO), they now have the ability to remove Financials & Real Estate stocks from some of their allocation while maintaining the rest of the S&P 500 Index stocks via the ProShares S&P 500 Ex-Financials ETF (NYSEARCA:SPXN). Since SPXN started in 2015, both ETFs show about the same results and risk statistics, thus my Buy rating for SPXN is for those investors who want lower exposure to banks, insurance, other financial stocks or Real Estate stocks. I give the VOO ETF a Buy rating as a Large-Cap Core holding.
Index review
Since both ETFs use variations of the S&P 500 Index, I chose to do one review. The major differences between the full and ex-Financial version will be covered when the ETFs themselves are compared. The S&P 500 Index is widely regarded as the best single gauge of large-cap U.S. equities, with an estimated $15.6t indexed or benchmarked against it. The index covers approximately 80% of available market capitalization. I think this picture is a good overview of the index.
spglobal.com S&P 500 Index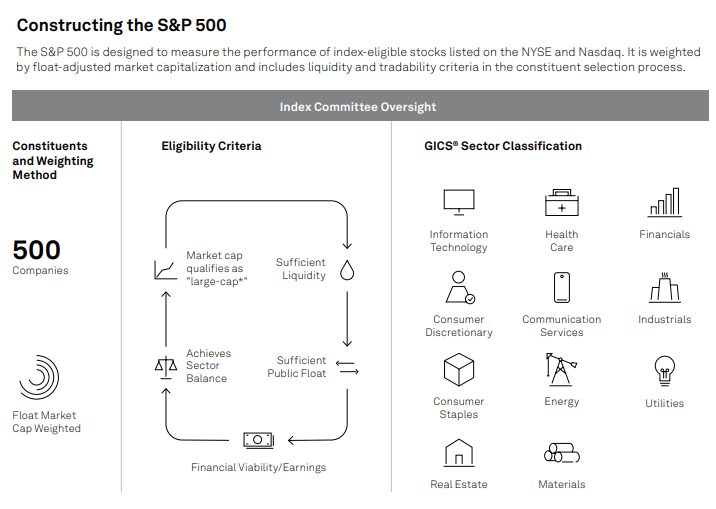
The Ex-index removes the Financials sector, the third largest allocation at 12.6%, and the Real Estate sector (2.5%) and reweights the remaining sectors.
Vanguard S&P 500 ETF review
Seeking Alpha describes this ETF as:
The Vanguard S&P 500 ETF invests in stocks of companies operating across diversified sectors. The fund invests in growth and value stocks of large-cap companies. It seeks to track the performance of the S&P 500 Index. VOO started in 1976.
Source: seekingalpha.com VOO
VOO has $327b in AUM and has what might be the lowest fees for an ETF based on the S&P 500 Index at 3bps. The TTM Yield is 1.52%.
VOO holdings review
While Vanguard provided sectors, they were not in allocation order, which I believe readers prefer.
seekingalpha.com VOO sectors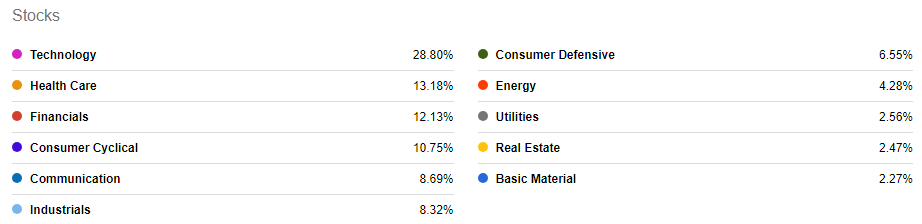
Vanguard holdings data classified each stock at the industry level, which provides this overview of the ETF.
advisors.vanguard.com; compiled by Author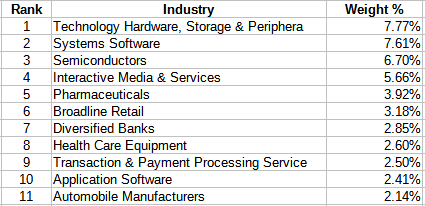
Top Holdings
VOO holds all the stocks in the S&P 500 index, with the Top 20 comprising 40% of the portfolio.
advisors.vanguard.com; compiled by Author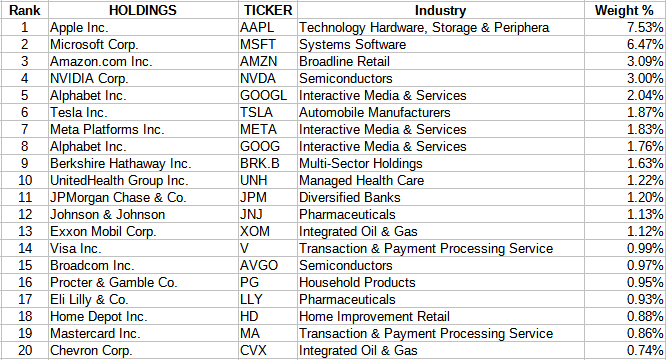
It takes just four stocks to equal 20% of the portfolio, equal to the combined weight of the smallest 333 positions! That highlights both the positive and negative of holdings concentration.
VOO distribution review
seekingalpha.com VOO DVDs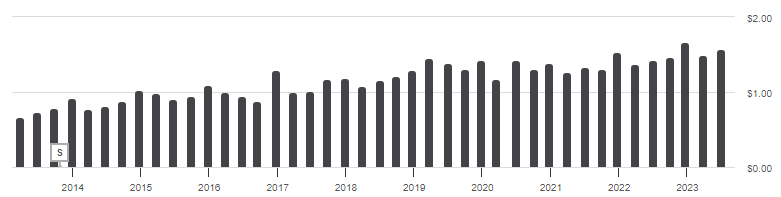
Over the past decade, dividends from the Large-Cap stocks have allowed VOO to increase its payout by 7.4%, slightly lower in more recent years. Seeking Alpha gives VOO a "B" grade for this ETF factor.
ProShares S&P 500 Ex-Financials ETF review
Seeking Alpha describes this ETF as:
The ProShares S&P 500 Ex-Financials ETF invests in growth and value stocks of large-cap companies. It seeks to track the performance of the S&P 500 Ex-Financials and Real Estate Index. SPXN started in 2015.
Source: seekingalpha.com SPXN
SPXN has just $42m in AUM, very small for an ETF started in 2015. Fees are 9bps and the TTM yield only 1.1%.
SPXN holdings review
To be consistent, I will used the same source for sectors for SPXN.
seekingalpha.com SPXN sectors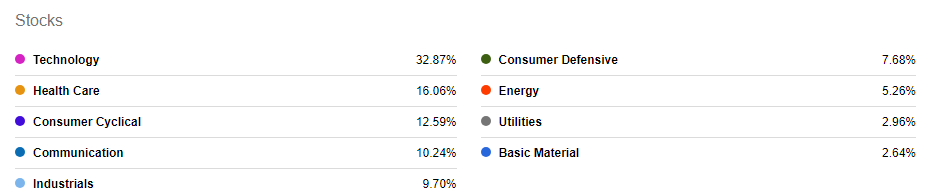
I will compare these against VOO later but all weights are higher for the nine sectors in both compared to VOO's allocations as expected. ProShares not only fails to provide Industry data, but individual stocks weren't attached to their sector either.
proshars.com; compiled by Author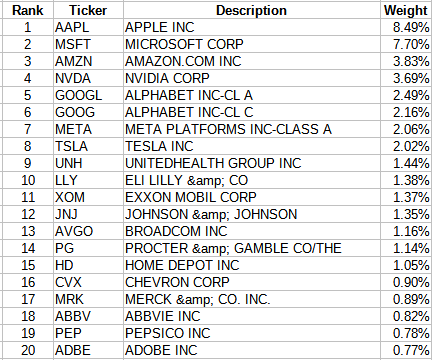
With 100 fewer stocks, here the Top 20 stocks come to over 45% of the portfolio, the same top four positions to 23%. In SPXN, the bottom 2/3rds equates to only 18% of the portfolio's weight. While investors "gain" the absence of two sectors, the concentration risk is increased compared to VOO.
SPXN distribution review
seekingalpha.com SPXN DVDs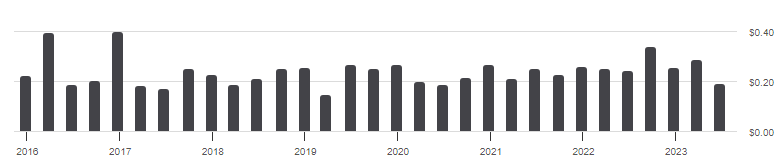
The five-year dividend growth rate is 4.14%, less than the 6.16% experienced by VOO holders. So despite all the issues related to both removed sectors, it appears they were increasing their payouts faster than the other sectors were. Removing the two sectors also lowered the yield compared to what VOO holders receive. Seeking Alpha gives SPXN a "C+" grade for this factor.
Comparing ETFs
While I will show later that removing the two sectors has had little effect on return or risk data, it might have affected the portfolio itself. First comparison is market-cap and style factors.
advisors.vanguard.com compare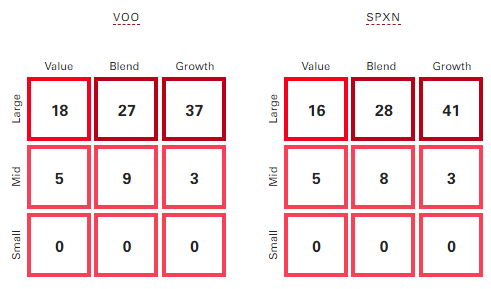
Removing the sectors had almost no effect on market-cap allocations. With Large-Cap dominating both, this could have been predicted. The shift from Value To Growth was only slightly more noticeable, though the fact neither grid totals to 100 hurts the analysis. Needless to say, none of the above is a concern when deciding between VOO and SPXN. Maybe sectors are.
ETFRC.com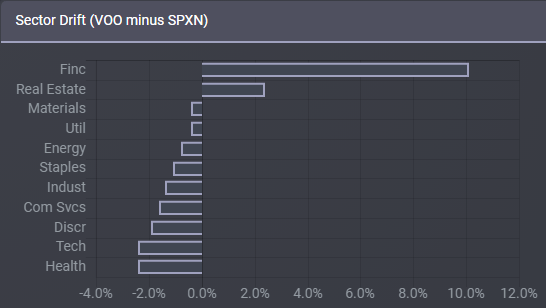
Even with 16% of the weight to redistribute, only two sectors gained over/near 2% compared to the full index weightings. The additions seem to align with the initial size of each sector as the wight represented by the excluded sectors is redistributed among the remaining companies in the S&P 500 on a pro rata basis.
When looking at basic equity data, removing the sectors did not affect these values much either. Except for lowering the yield, the two removed sectors characteristics match closely to what remained. That greatly simplifies the decision making on which ETF to hold.
morningstar.com; compiled by Author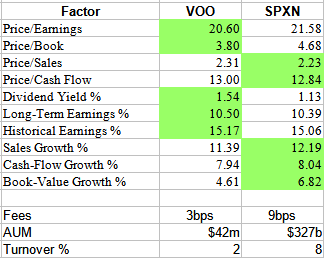
I saw similar results when running both ETFs thru Portfolio Visualizer, with the exception of the Alpha generated, one reason to own one ETF over another.
| Factor | VOO ETF | SPXN ETF |
| Beta | .97 | .94 |
| Alpha | 1.01 | 1.71 |
| Sharpe ratio | .81 | .81 |
| Sortino ratio | 1.26 | 1.25 |
| StdDev | 15.95% | 16.39% |
| Positive periods | 72.3% | 70.2% |
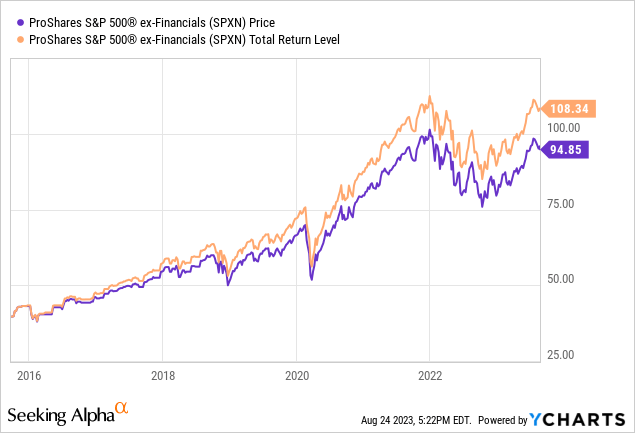
Performance results
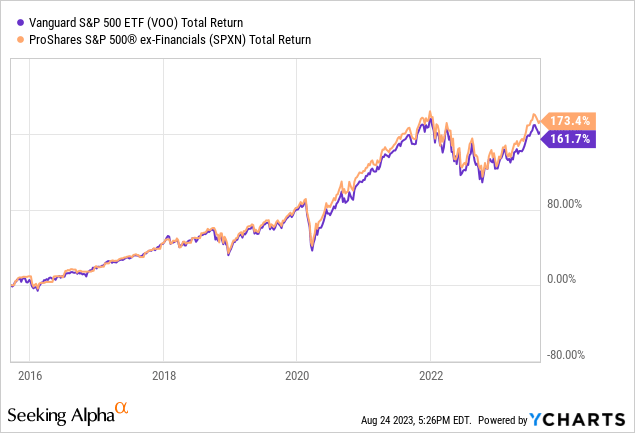
Annualized, the CAGE comes to 13.10% for the VOO ETF and 13.54% for the SPXN ETF, or about $100/year per $10k invested.
Conclusion
Except for avoiding those two sectors, there is little reason to hold SPXN versus a Core holding like VOO, for which it deserves a Buy rating. I will give a Buy rating for SPXN for those investors who want lower exposure to banks, insurance, other financial stocks, or Real Estate stocks.
Portfolio strategy
Here, one might choose to own SPXN over VOO or other S&P 500 Index based ETFs simply for the reason they want to avoid Financials and Real Estate stocks during certain market cycles, like when interest rates are climbing. That said, SPXN has a performance edge over VOO since the start of 2022.
Another would be looking to gain Alpha by owning a "factor" based ETF that outperforms ETFs based on the full, regularly weight index. According to Portfolio Visualizer's data, SPXN has achieved that.
Final thought
With fixed income assets, avoiding Financials has been a good strategy, which I reviewed here: PFF Vs. PFXF ETF: Avoiding Financials Has Worked (NASDAQ:PFF).

I ‘m proud to have asked to be one of the original Seeking Alpha Contributors to the 11/21 launch of the Hoya Capital Income Builder Market Place.
This is how HCIB sees its place in the investment universe:
Whether your focus is high yield or dividend growth, we’ve got you covered with high-quality, actionable investment research and an all-encompassing suite of tools and models to help build portfolios that fit your unique investment objectives. Subscribers receive complete access to our investment research - including reports that are never published elsewhere - across our areas of expertise including Equity REITs, Mortgage REITs, Homebuilders, ETFs, Closed-End-Funds, and Preferreds.
This article was written by

I have both a BS and MBA in Finance. I have been individual investor since the early 1980s and have a seven-figure portfolio. I was a data analyst for a pension manager for thirty years until I retired July of 2019. My initial articles related to my experience in prepping for and being in retirement. Now I will comment on our holdings in our various accounts. Most holdings are in CEFs, ETFs, some BDCs and a few REITs. I write Put options for income generation. Contributing author for Hoya Capital Income Builder.
Analyst’s Disclosure: I/we have no stock, option or similar derivative position in any of the companies mentioned, and no plans to initiate any such positions within the next 72 hours. I wrote this article myself, and it expresses my own opinions. I am not receiving compensation for it (other than from Seeking Alpha). I have no business relationship with any company whose stock is mentioned in this article.
Seeking Alpha's Disclosure: Past performance is no guarantee of future results. No recommendation or advice is being given as to whether any investment is suitable for a particular investor. Any views or opinions expressed above may not reflect those of Seeking Alpha as a whole. Seeking Alpha is not a licensed securities dealer, broker or US investment adviser or investment bank. Our analysts are third party authors that include both professional investors and individual investors who may not be licensed or certified by any institute or regulatory body.