Coal India among 5 stocks reversing from oversold zone, shows stochastic scan
, ETMarkets.com|

iStock

The tool compares the stock’s particular closing price to the price range over some period. Usually, the period for computing Stochastic is 14 days.
Formula: %K= 100 [(C-L14)/ ( H14-L14)]
Herein, C is the closing price, L14 is the lowest price during the reference period of 14 days and H14 is the highest price during the period.
iStock

The indicator helps in generating overbought and oversold trading signals. Also, the indicator measures the momentum of a security’s price for determining trends and predicting reversals.
iStock
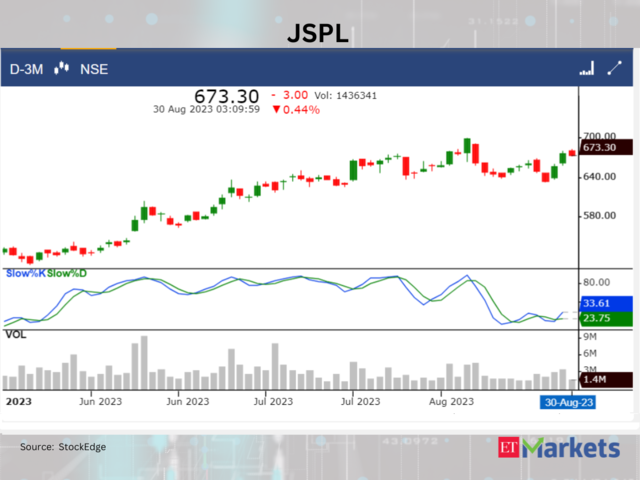
Slow Stochastic %K: 33.61| Last close: Rs 676.3
ETMarkets.com

ETMarkets.com

ETMarkets.com
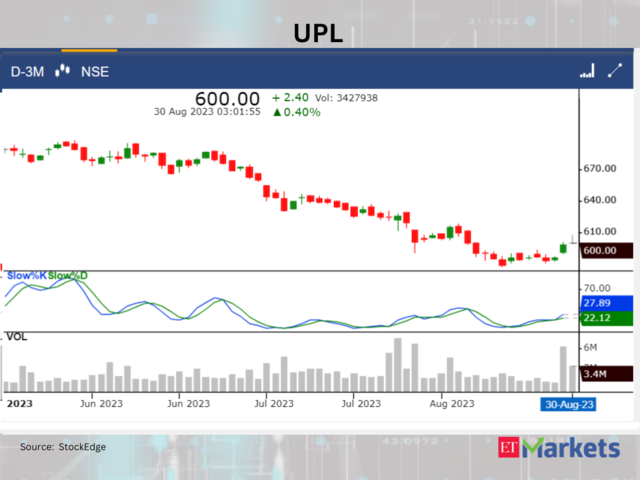
Slow Stochastic %K: 27.89| Last close: Rs 597.6
ETMarkets.com

Slow Stochastic %K: 20.75| Last close: Rs 229.95
ETMarkets.com