TDVG: A Promising Dividend Growth ETF

Summary
- T. Rowe Price Dividend Growth ETF is an actively managed fund focused on dividend income and long-term capital growth.
- It is well-diversified across several sectors.
- The TDVG ETF is similar to the S&P 500 regarding valuation metrics, but it is superior in quality.
- Total return since inception is close to competitors, and the year-to-year dividend growth is much better.
- Quantitative Risk & Value members get exclusive access to our real-world portfolio. See all our investments here »
arthon meekodong/iStock via Getty Images
TDVG strategy and portfolio
T. Rowe Price Dividend Growth ETF (NYSEARCA:TDVG) started investing operations on 08/04/2020 with an objective of "dividend income and long-term capital growth." It is an actively managed fund, which offers a lot of flexibility. On the downside, the strategy is impossible to duplicate or backtest like index-based exchange-traded funds, or ETFs. Moreover, this fund doesn't disclose its holdings on a daily basis like most ETFs do. As of writing, the website shows the top 10 holdings as of 7/31/2023 (1-month delay) and the full holding list as of 6/30/2023 (2-month delay). However, a daily proxy portfolio is available, with a current overlap of 93.68% relative to the real portfolio. The fund's expense ratio is 0.50%.
As described in the prospectus by T. Rowe Price, stock selection criteria include:
- above-average earnings and dividend growth;
- current dividend yield;
- a sound balance sheet and cash flow;
- a leading market position;
- attractive valuation ratios.
The fund is almost exclusively invested in U.S. companies (about 95% of asset value), mostly in large and mega caps (82%).
As with the large-cap benchmark S&P 500 (SP500), information technology is the heaviest sector. However, the fund is better-balanced in its top 4 sectors: technology, healthcare, financials and industrials weigh between 14.8% and 18.8%. Other sectors are below 10%. Compared to the S&P 500, the fund underweights technology, consumer discretionary and it almost ignores communication. It overweights mostly industrials and materials.
Sector breakdown (Chart: author; data: T. Rowe Price, SSGA)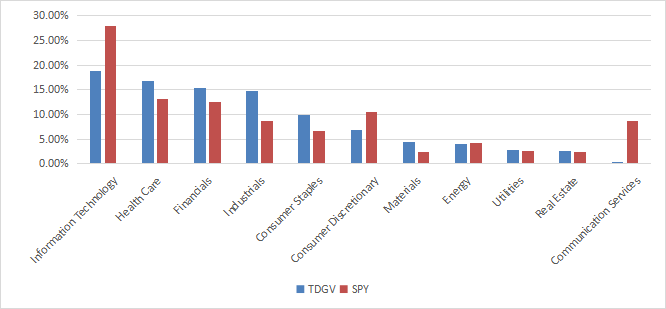
The top 10 holdings of the proxy portfolio, listed in the next table with fundamental ratios, have an aggregate weight of 25.5%. Microsoft and Apple weigh over 10% together, and risks related to other individual companies are low.
Ticker | Name | Weight % | EPS growth % TTM | P/E TTM | P/E fwd | Yield % |
Microsoft Corp. | 5.82% | 0.42 | 33.43 | 29.47 | 0.84 | |
Apple, Inc. | 4.47% | -1.68 | 30.28 | 29.76 | 0.53 | |
UnitedHealth Group, Inc. | 2.13% | 16.73 | 21.98 | 19.79 | 1.53 | |
Visa, Inc. | 2.12% | 16.71 | 31.49 | 28.13 | 0.74 | |
Accenture PLC | 1.99% | 8.87 | 28.60 | 27.65 | 1.40 | |
Marsh & McLennan Cos., Inc. | 1.93% | -1.11 | 29.69 | 25.17 | 1.46 | |
JPMorgan Chase & Co. | 1.92% | 24.77 | 9.49 | 9.33 | 2.71 | |
Chubb Ltd. | 1.74% | -16.01 | 14.42 | 10.83 | 1.71 | |
Eli Lilly & Co. | 1.72% | 13.03 | 78.15 | 57.86 | 0.82 | |
General Electric Co. | 1.70% | 1271.03 | 13.90 | 48.73 | 0.28 |
Historical performance
The next chart plots the total return since inception of TDVG, compared with SPY and four large-cap dividend growth ETFs:
- ProShares S&P 500 Dividend Aristocrats ETF (NOBL).
- iShares Core Dividend Growth ETF (DGRO).
- Vanguard Dividend Appreciation Index Fund (VIG).
- Schwab U.S. Dividend Equity ETF (SCHD).
SCHD is leading the pack. TDVG is close to other competitors.
TDVG vs. Competitors, since inception (Seeking Alpha)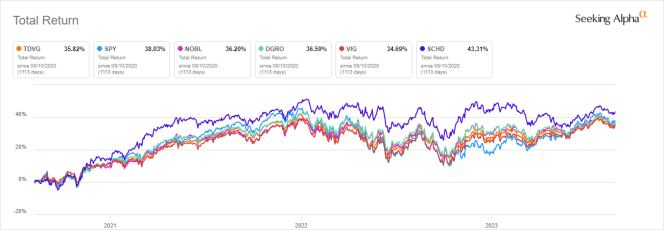
In 2023 to date, SPY beats the dividend funds, but TDVG is the second-best performer by a short margin, just behind VIG:
TDVG vs. Competitors, year-to-date (Seeking Alpha)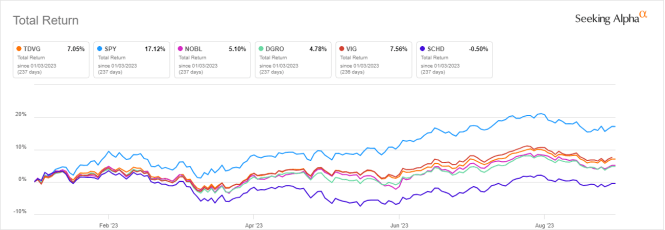
The next chart compares the distribution growth rates of the same funds between 2021 and 2022. In this regard, TDVG is the best performer, and 100% of distributions are reported as net income (no capital gain). A note of caution, though: the fund's history is too short to assess the strategy. Anyway, it is interesting to note that the dividend aristocrat fund (NOBL) is the only one in this list with decreasing annualized distributions from 2021 to 2022.
Dividend growth, 2021 to 2022 (Chart: author; data: Seeking Alpha)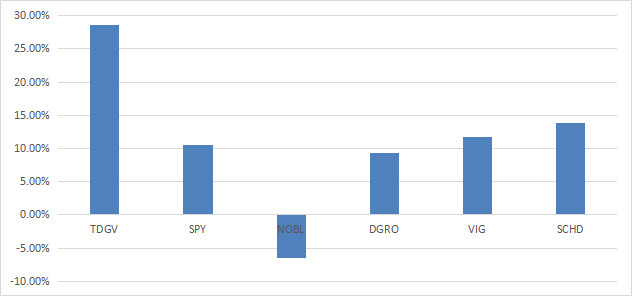
Portfolio valuation and quality
Valuation ratios are close to S&P 500 values. In this regard, TDVG isn't better than the benchmark.
TDVG | SPY | |
Price / Earnings TTM | 21.98 | 23.32 |
Price / Book | 4.17 | 4.1 |
Price / Sales | 2.4 | 2.62 |
Price / Cash Flow | 17.64 | 16.37 |
In previous articles, I have shown how three factors may help cut the risk in a dividend portfolio: Return on Assets, Piotroski F-score, Altman Z-score. My core portfolio holds 14 stocks selected using these metrics (more info at the end of this post). I have scanned the proxy portfolio with these quality metrics. I consider that risky stocks are companies with at least 2 red flags among: bad Piotroski score, negative ROA, unsustainable payout ratio, bad or dubious Altman Z-score, excluding financials and real estate, where these metrics are less relevant. With these assumptions, only 6 stocks out of 102 are risky, and they weigh about 3% of asset value, which is a good point.
Based on my calculation of aggregate metrics reported in the next table, the proxy portfolio's quality is superior to the benchmark.
TDVG | SPY | |
Altman Z-score | 4.47 | 3.51 |
Piotroski F-score | 5.84 | 5.68 |
ROA % TTM | 10.25 | 7.1 |
Takeaway
T. Rowe Price Dividend Growth ETF is an actively managed fund in the dividend growth arena. It is well-diversified across several sectors. TDVG is close to the S&P 500 regarding valuation metrics, but it looks superior in quality. The fund's history is too short to assess the strategy, but it is promising: total return since inception is close to competitors, and the year-to-year dividend growth is much better.
Quantitative Risk & Value (QRV) features data-driven strategies in stocks and closed-end funds outperforming their benchmarks since inception. Get started with a two-week free trial now.

This article was written by

Step up your investing experience: try Quantitative Risk & Value for free now (limited offer).
I am an individual investor and an IT professional, not a finance professional. My writings are data analysis and opinions, not investment advice. They may contain inaccurate information, despite all the effort I put in them. Readers are responsible for all consequences of using information included in my work, and are encouraged to do their own research from various sources.
Analyst’s Disclosure: I/we have no stock, option or similar derivative position in any of the companies mentioned, and no plans to initiate any such positions within the next 72 hours. I wrote this article myself, and it expresses my own opinions. I am not receiving compensation for it (other than from Seeking Alpha). I have no business relationship with any company whose stock is mentioned in this article.
Seeking Alpha's Disclosure: Past performance is no guarantee of future results. No recommendation or advice is being given as to whether any investment is suitable for a particular investor. Any views or opinions expressed above may not reflect those of Seeking Alpha as a whole. Seeking Alpha is not a licensed securities dealer, broker or US investment adviser or investment bank. Our analysts are third party authors that include both professional investors and individual investors who may not be licensed or certified by any institute or regulatory body.