The State Of REITs: August 2023 Edition

Summary
- The REIT sector followed a strong June with further gains in July, averaging a solid +4.37% total return in July.
- Small-cap REITs (+5.23%) continued to outperform in July. Large caps (+2.46%) underperformed their smaller REIT peers for the 3rd straight month in July.
- 73.72% of REIT securities had a positive total return in July with 60.63% in the black year to date.
- Office (+11.03%) and Malls (+7.92%) outperformed other REIT property types in July. Self-Storage (-2.24%) and Advertising (-1.10%) REITs averaged the biggest declines.
- The average REIT NAV discount narrowed from -22.44% to -19.78% during July. The median NAV discount narrowed from -20.48% to -17.37%.
- This idea was discussed in more depth with members of my private investing community, Portfolio Income Solutions. Learn More »
Kwarkot
REIT Performance
REITs built on June’s strong performance with another +4.37% average total return in July. REITs again outperformed the S&P 500 (+3.2%), Dow Jones Industrial Average (+3.4%) and NASDAQ (+4.1%). The market cap weighted Vanguard Real Estate ETF (VNQ) underperformed the average REIT in July (+2.03% vs. +4.37%), but has outperformed YTD (+5.55% vs. +3.95%). The spread between the 2023 FFO multiples of large cap REITs (17.2x) and small cap REITs (13.5x) narrowed in July as multiples remained flat for large caps and expanded 1.8 turns for small caps. Investors currently need to pay an average of 27.4% more for each dollar of FFO from large cap REITs relative to small cap REITs. In this monthly publication, I will provide REIT data on numerous metrics to help readers identify which property types and individual securities currently offer the best opportunities to achieve their investment goals.
Source: Graph by Simon Bowler of 2nd Market Capital, Data compiled from S&P Global Market Intelligence LLC. See important notes and disclosures at the end of this article
Large cap REITs (+2.46%) fell short of their smaller peers again in July. Small caps (+5.23%) led the REIT sector yet again in July, narrowly edging out mid-caps (+4.72%) and micro caps (+4.64%). Despite three straight months of underperformance, Large cap REITs (+6.75%) are outperforming small caps (+4.76%) by 199 basis points on YTD 2023 total return.
Source: Graph by Simon Bowler of 2nd Market Capital, Data compiled from S&P Global Market Intelligence LLC. See important notes and disclosures at the end of this article
14 out of 18 Property Types Yielded Positive Total Returns in July
77.78% percent of REIT property types averaged a positive total return in July, with a 13.31% total return spread between the best and worst performing property types. Office (+11.07%) and Malls (+7.92%) outpaced the rest of the REIT sector in July. The Office REIT outperformance in July was driven by massive gains from Hudson Pacific Properties (HPP) (+39.10%), SL Green Realty (SLG) (+26.40%) and Vornado Realty Trust (VNO) (+23.93%).
Self-Storage (-2.24%), Advertising (-1.10%), Casino (-0.95%) and Multifamily (-0.49%) were the only property types in the red in July. Extra Space Storage (EXR) (-5.61%) saw the largest decline among Self Storage REITs, falling sharply after posting an earnings miss and downwardly revised FFO/share guidance on August 3rd.
Source: Table by Simon Bowler of 2nd Market Capital, Data compiled from S&P Global Market Intelligence LLC. See important notes and disclosures at the end of this article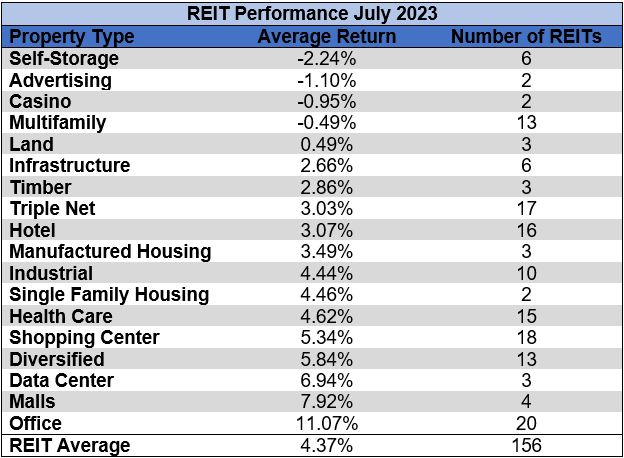
After Office REITs rallied in July, Infrastructure (-23.42%) is now the only property type with a double-digit negative average return year to date. Land (-8.82%), Office (-7.35%) and Malls (-5.37%) all saw gains in July but remain in the red thus far in 2023. The number of REIT property types in the black year to date increased from 10 to 12 in July. Data Centers (+26.01%) and Single Family Housing (+23.84%) overtook Health Care (+22.29%) as the best performing property type year to date.
Source: Table by Simon Bowler of 2nd Market Capital, Data compiled from S&P Global Market Intelligence LLC. See important notes and disclosures at the end of this article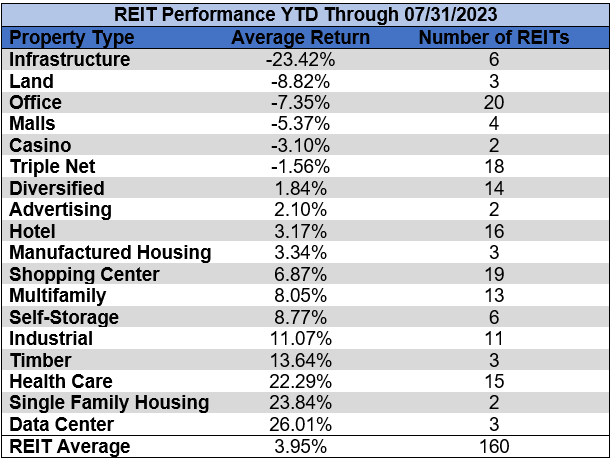
The REIT sector as a whole saw the average P/FFO (2023Y) increase 0.6 turns in July from 13.1x up to 13.7x. The average FFO multiple expanded for 70.6% of property types and contracted for 29.4%. There are no recent 2023 FFO/share estimates for any of the Timber REITs. Land (37.1x), Data Centers (25.4x), Single Family Housing (21.4x) and Manufactured Housing (20.6x) continue to trade at the highest average multiples among REIT property types. Malls (5.3x), Office (8.1x) and Hotels (8.2x) all saw multiple expansion in July, but remain the only REIT property types trading at single digit multiples.
Source: Table by Simon Bowler of 2nd Market Capital, Data compiled from S&P Global Market Intelligence LLC. See important notes and disclosures at the end of this article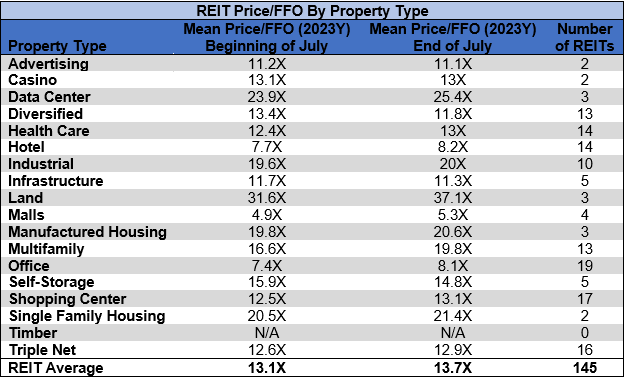
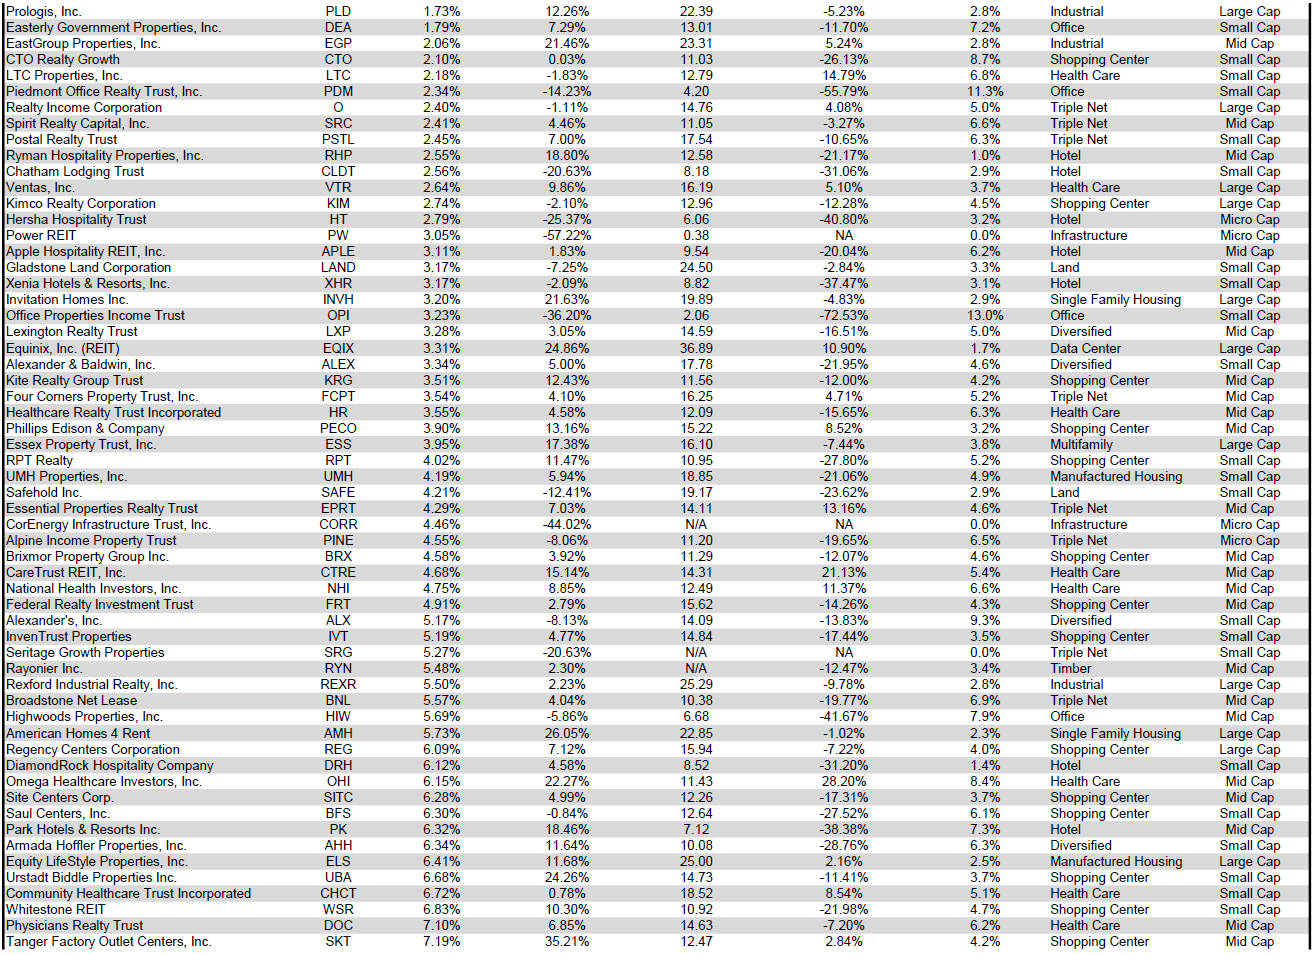
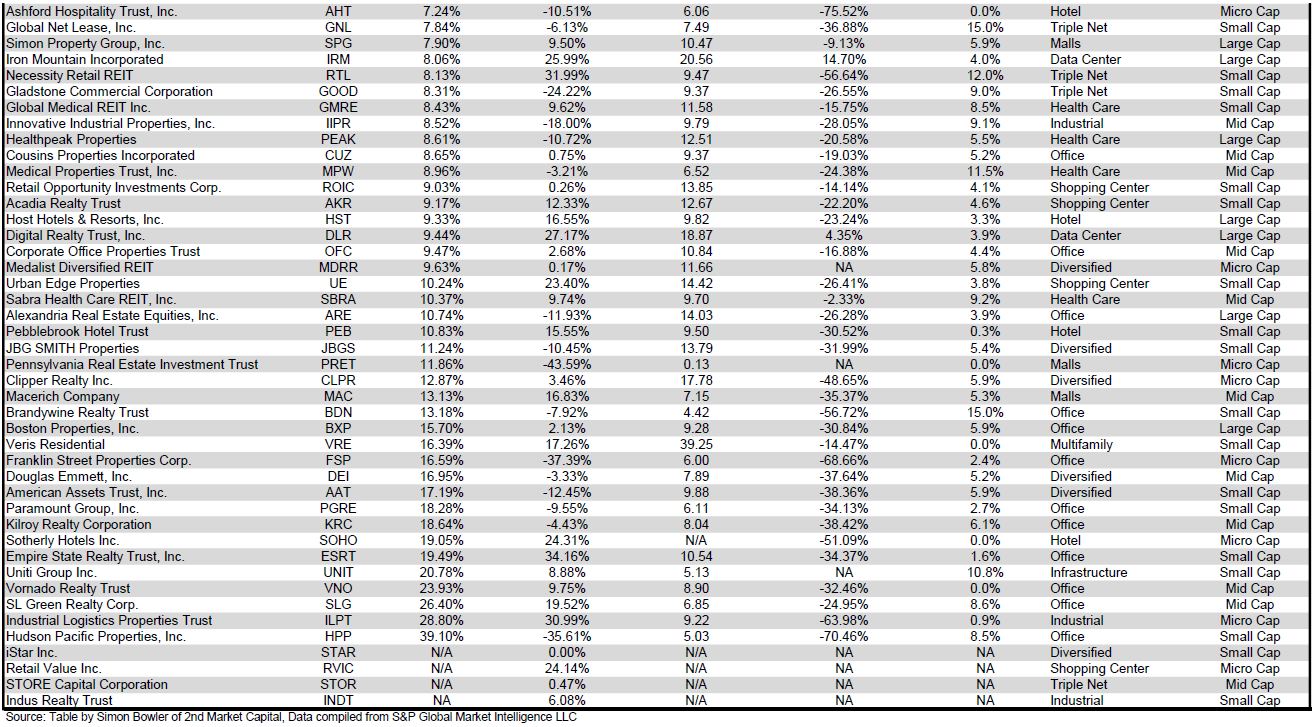
Performance of Individual Securities
Life Storage (LSI) was acquired by Extra Space Storage (EXR) on July 20th. Shareholders of Life Storage received 0.895 shares of EXR for each share of LSI.
Hudson Pacific Properties (HPP) (+39.10%) was the biggest beneficiary of the July Office REIT rebound. Having suffered the deepest price decline of any Office REIT in the first half of the year, HPP saw the largest rebound as that selloff partially reversed in July. Despite outpacing all other REITs in July, HPP remains deeply in the red year to date with a brutal -35.61% total return.
InnSuites Hospitality Trust (IHT) (-15.93%) continues to experience significantly greater share price volatility than their REIT peers, enduring the largest decline of any REIT in July. However, IHT is still the 2 nd best performing Hotel REIT in 2023 with a +21.02% total return trailing only Sotherly Hotels (SOHO) (+24.31%).
73.72% of REITs had a positive total return in July with 60.63% in the black year to date. During the first seven months of last year the average REIT had a -10.94% return. During the first seven months of this year the average REIT has performed much better with a +3.95% total return.
Source: Table by Simon Bowler of 2nd Market Capital, Data compiled from S&P Global Market Intelligence LLC. See important notes and disclosures at the end of this article Source: Table by Simon Bowler of 2nd Market Capital, Data compiled from S&P Global Market Intelligence LLC. See important notes and disclosures at the end of this article Source: Table by Simon Bowler of 2nd Market Capital, Data compiled from S&P Global Market Intelligence LLC. See important notes and disclosures at the end of this article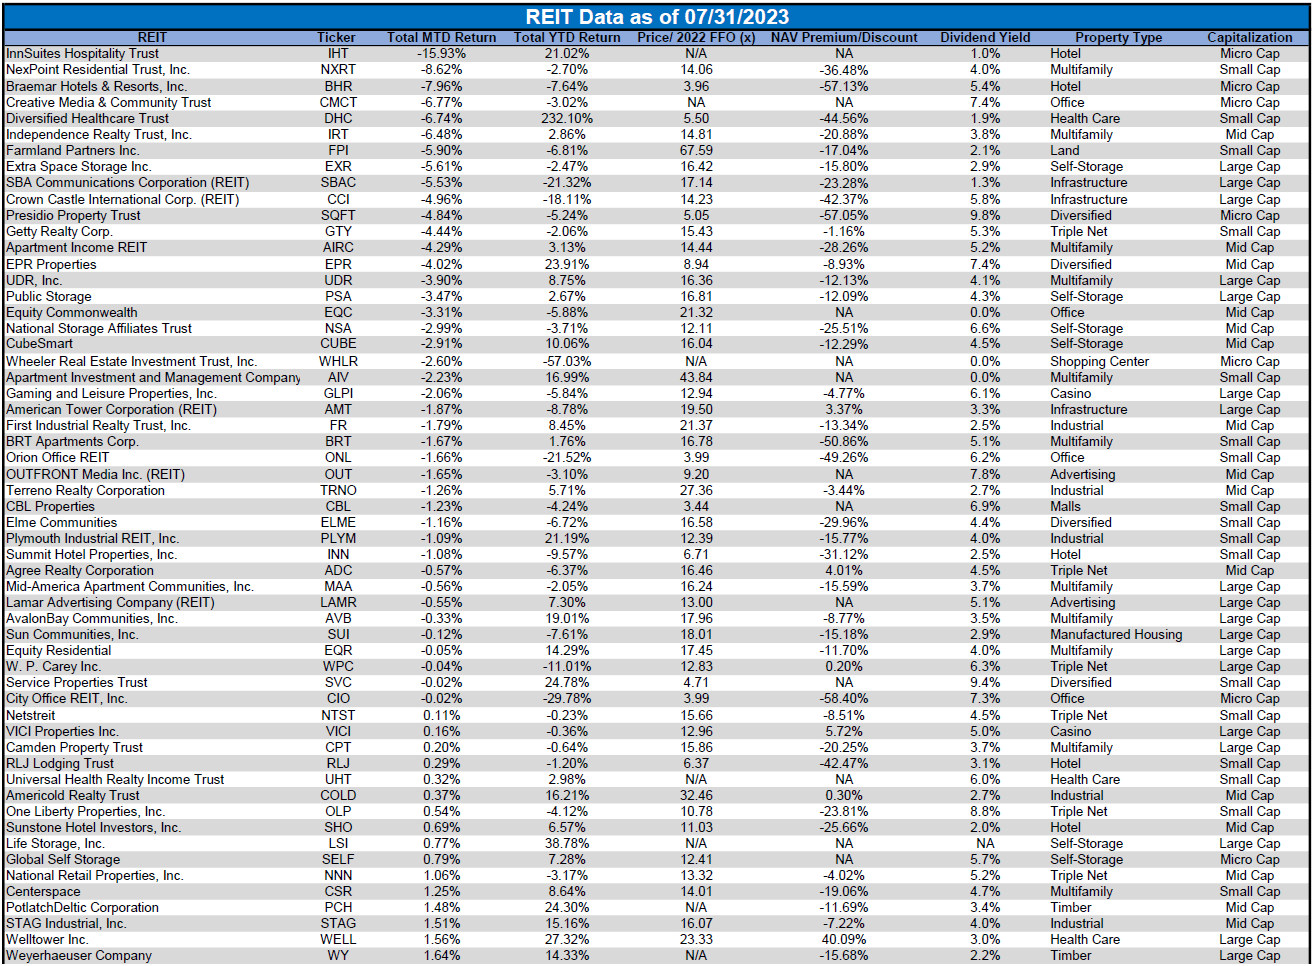
For the convenience of reading this table in a larger font, the table above is available as a PDF as well.
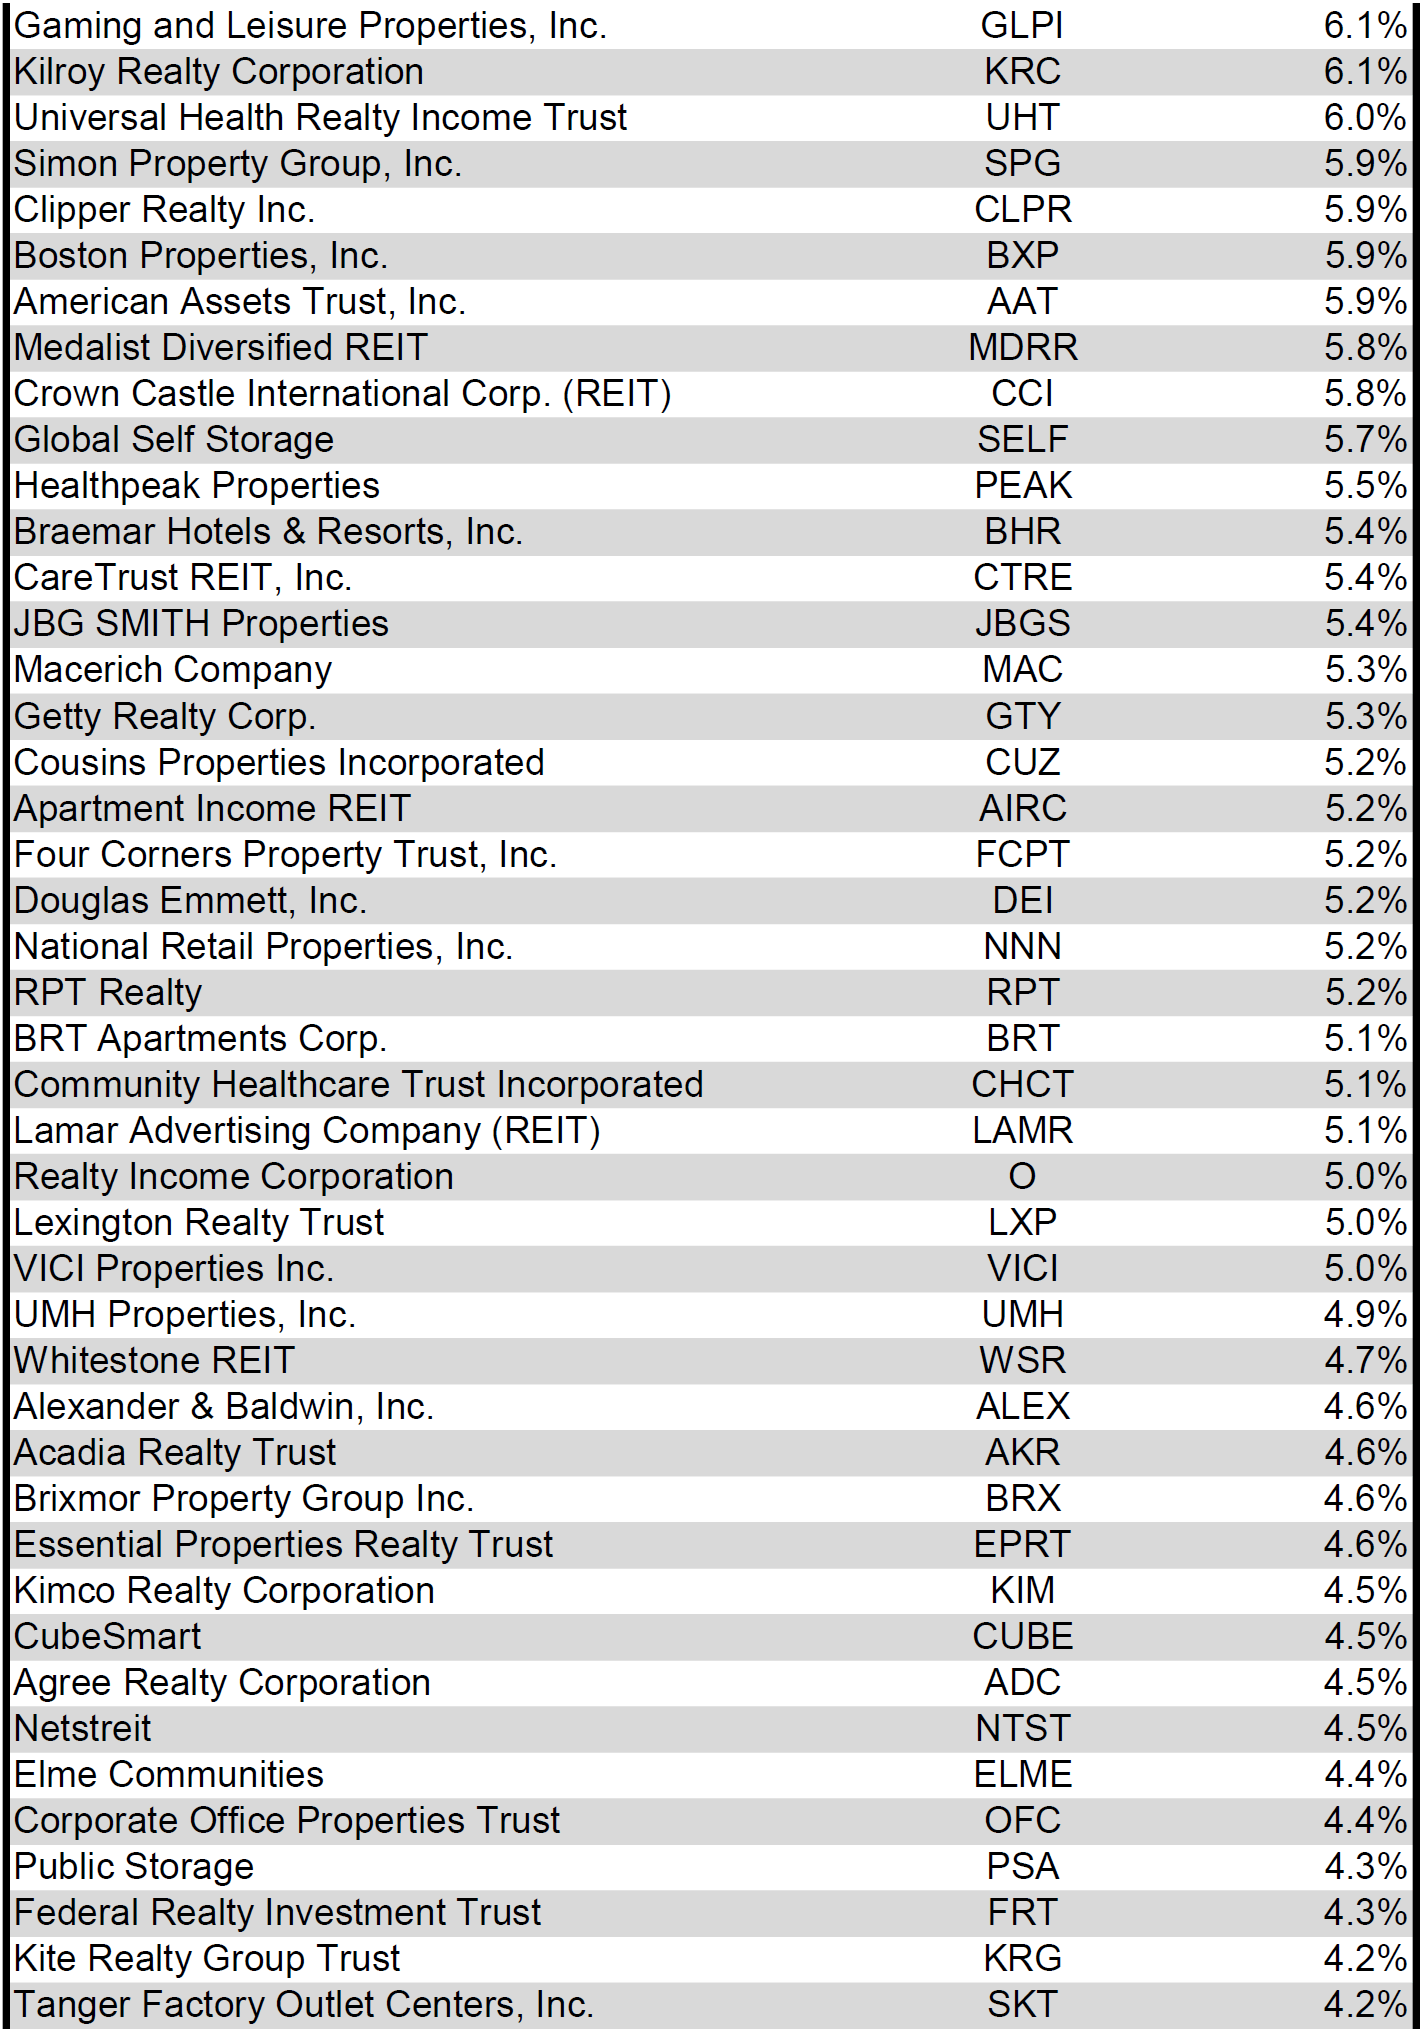
Dividend Yield
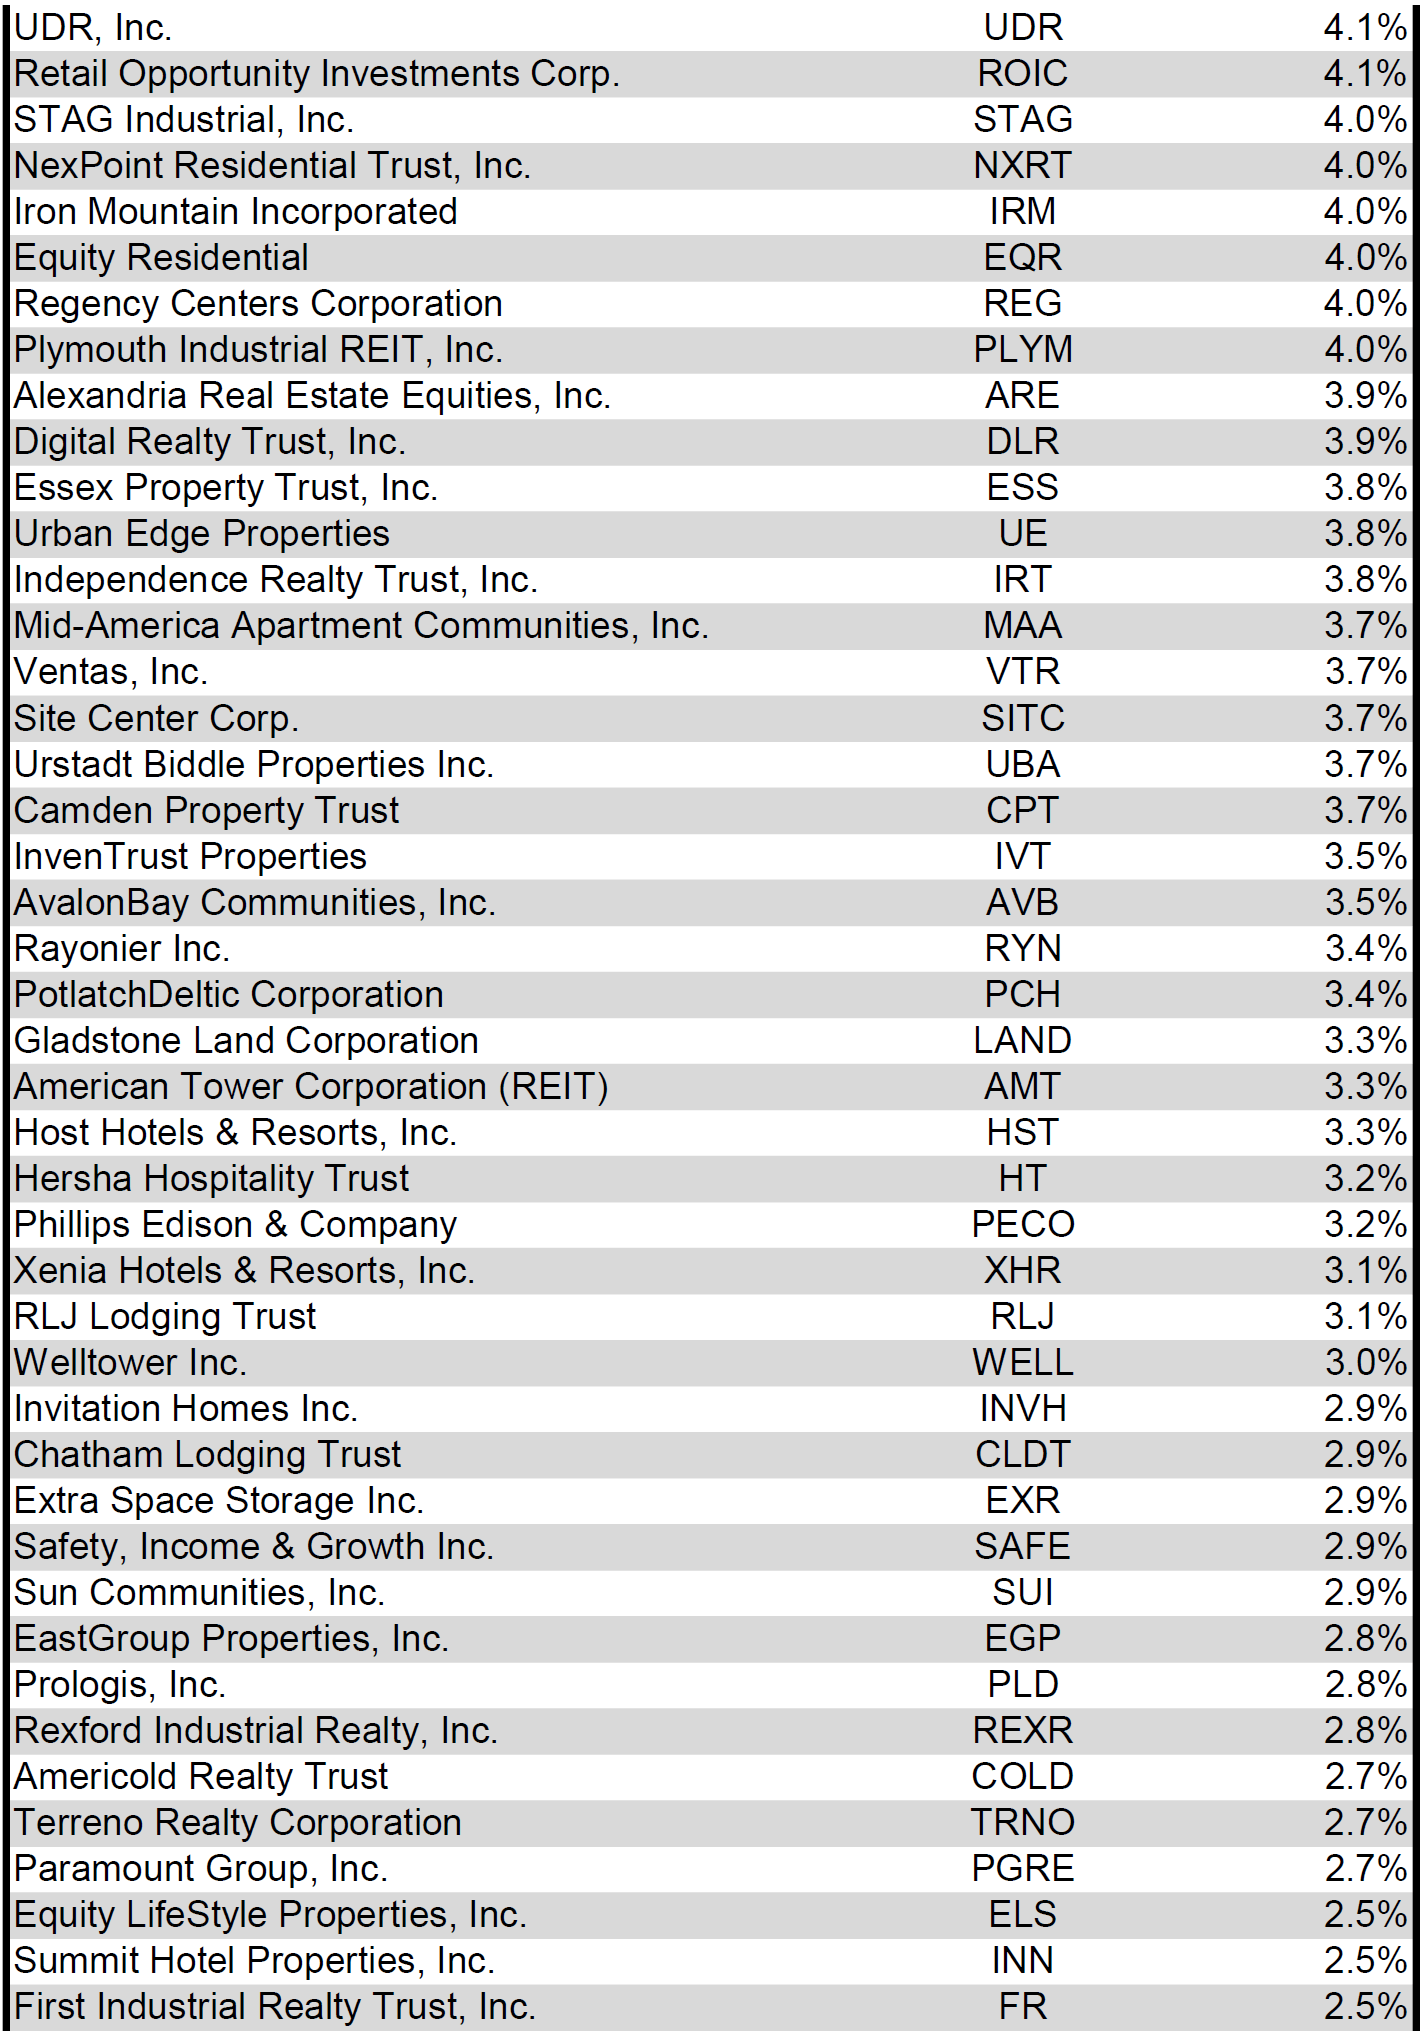
Dividend yield is an important component of a REIT's total return. The particularly high dividend yields of the REIT sector are, for many investors, the primary reason for investment in this sector. As many REITs are currently trading at share prices well below their NAV, yields are currently quite high for many REITs within the sector. Although a particularly high yield for a REIT may sometimes reflect a disproportionately high risk, there exist opportunities in some cases to capitalize on dividend yields that are sufficiently attractive to justify the underlying risks of the investment. I have included below a table ranking equity REITs from highest dividend yield (as of 07/31/2023) to lowest dividend yield.
Source: Table by Simon Bowler of 2nd Market Capital, Data compiled from S&P Global Market Intelligence LLC. See important notes and disclosures at the end of this article Source: Table by Simon Bowler of 2nd Market Capital, Data compiled from S&P Global Market Intelligence LLC. See important notes and disclosures at the end of this article Source: Table by Simon Bowler of 2nd Market Capital, Data compiled from S&P Global Market Intelligence LLC. See important notes and disclosures at the end of this article Source: Table by Simon Bowler of 2nd Market Capital, Data compiled from S&P Global Market Intelligence LLC. See important notes and disclosures at the end of this article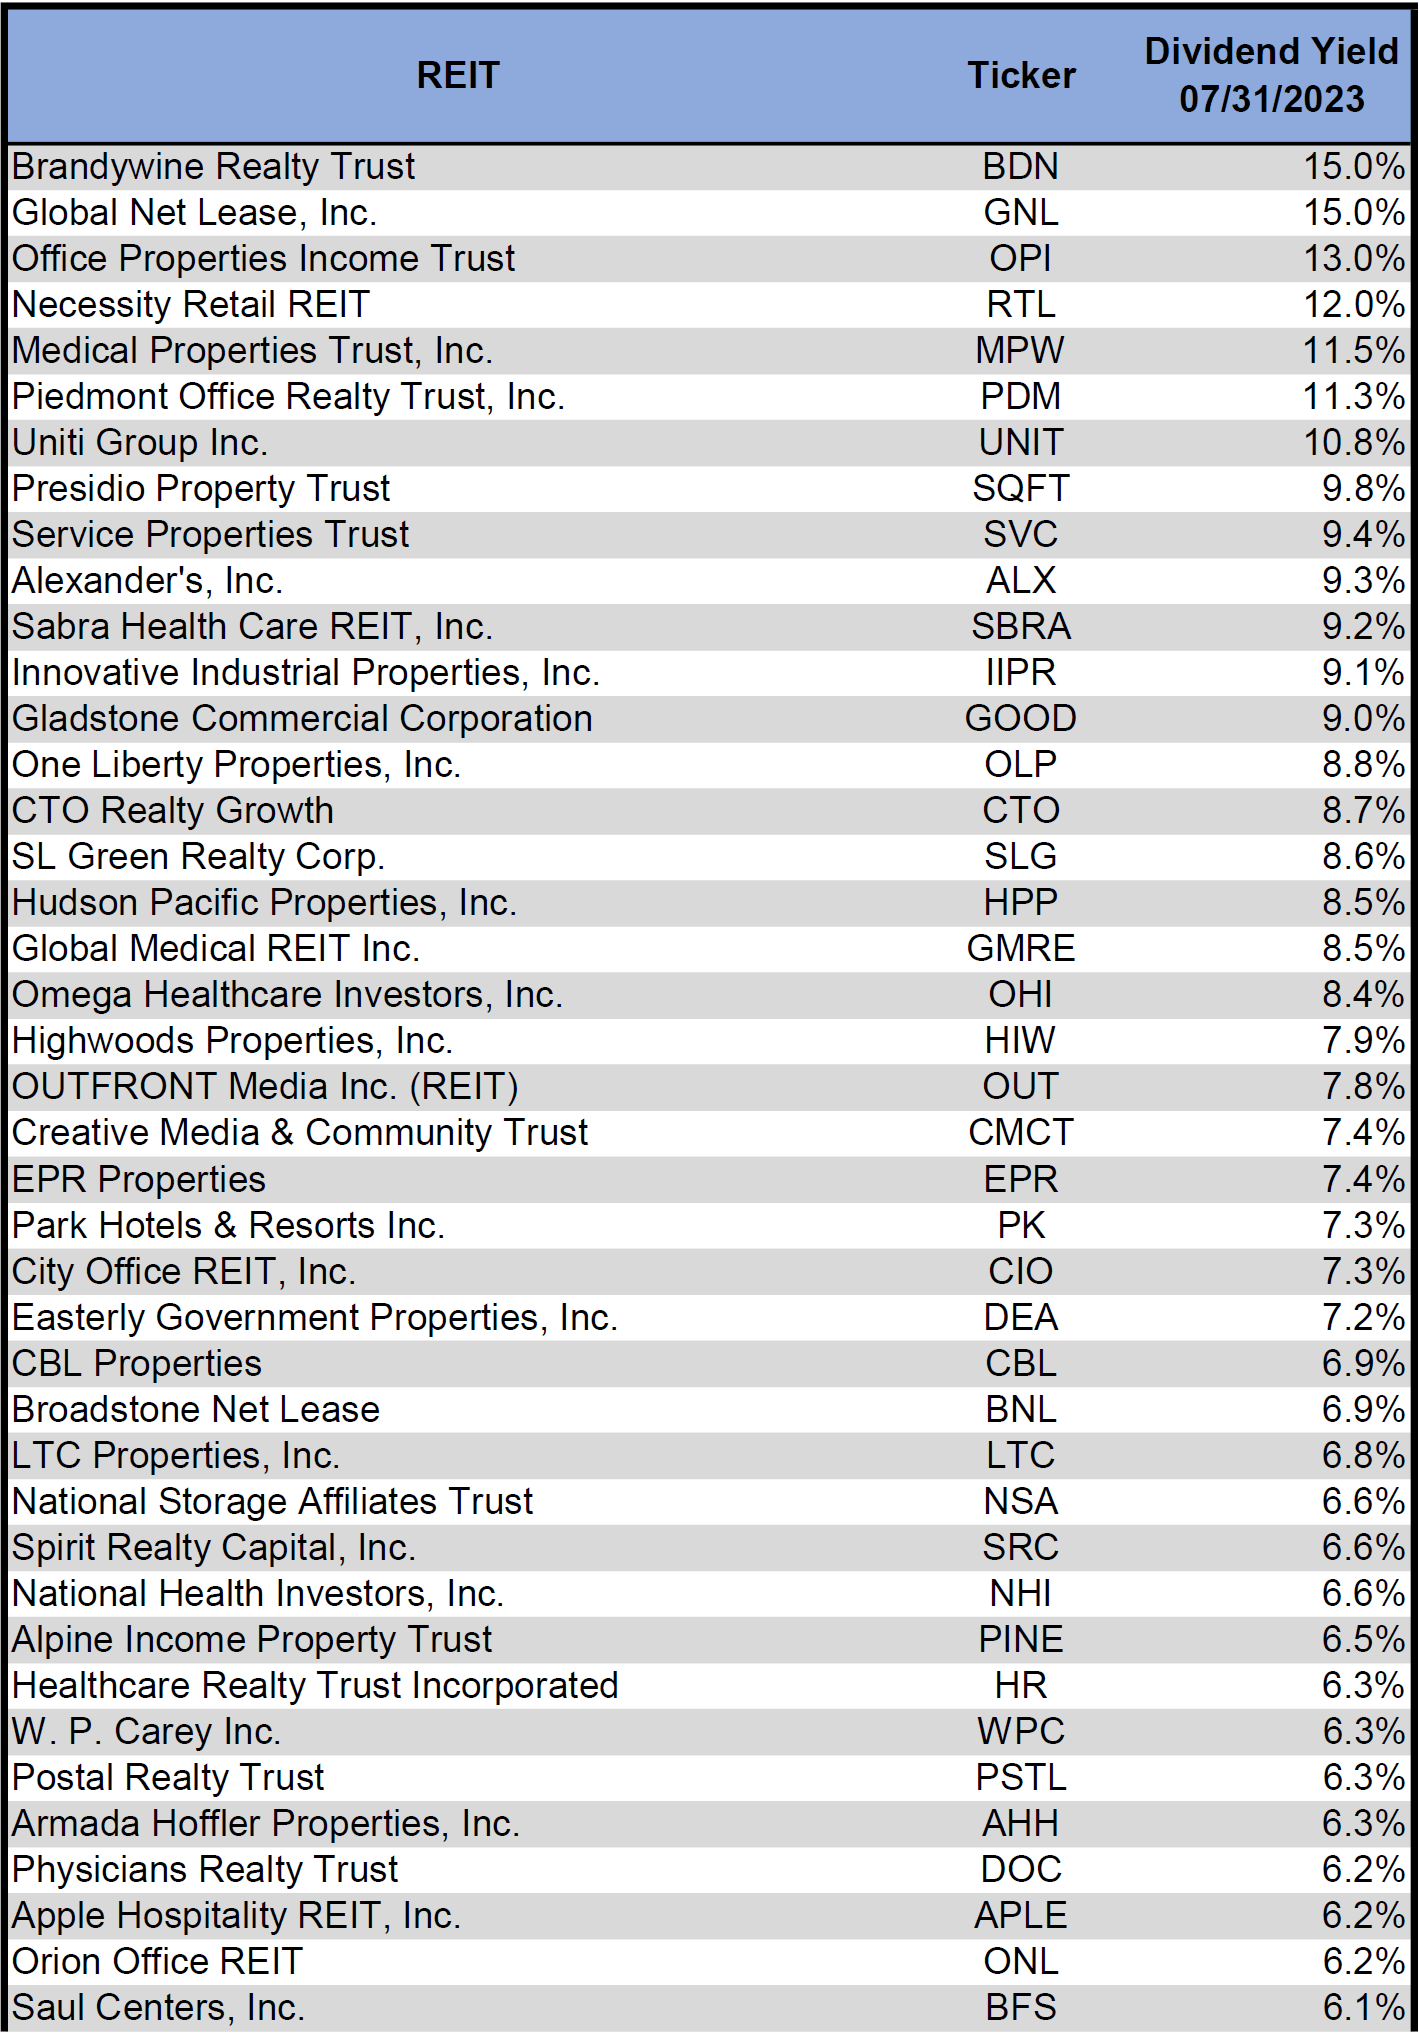

For the convenience of reading this table in a larger font, the table above is available as a PDF as well.
Although a REIT’s decision regarding whether to pay a quarterly dividend or a monthly dividend does not reflect on the quality of the company’s fundamentals or operations, a monthly dividend allows for a smoother cash flow to the investor. Below is a list of equity REITs that pay monthly dividends ranked from highest yield to lowest yield.
Source: Table by Simon Bowler of 2nd Market Capital, Data compiled from S&P Global Market Intelligence LLC. See important notes and disclosures at the end of this article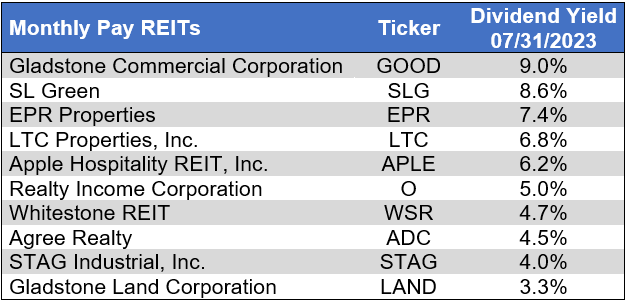
Valuation
REIT Premium/Discount to NAV by Property Type
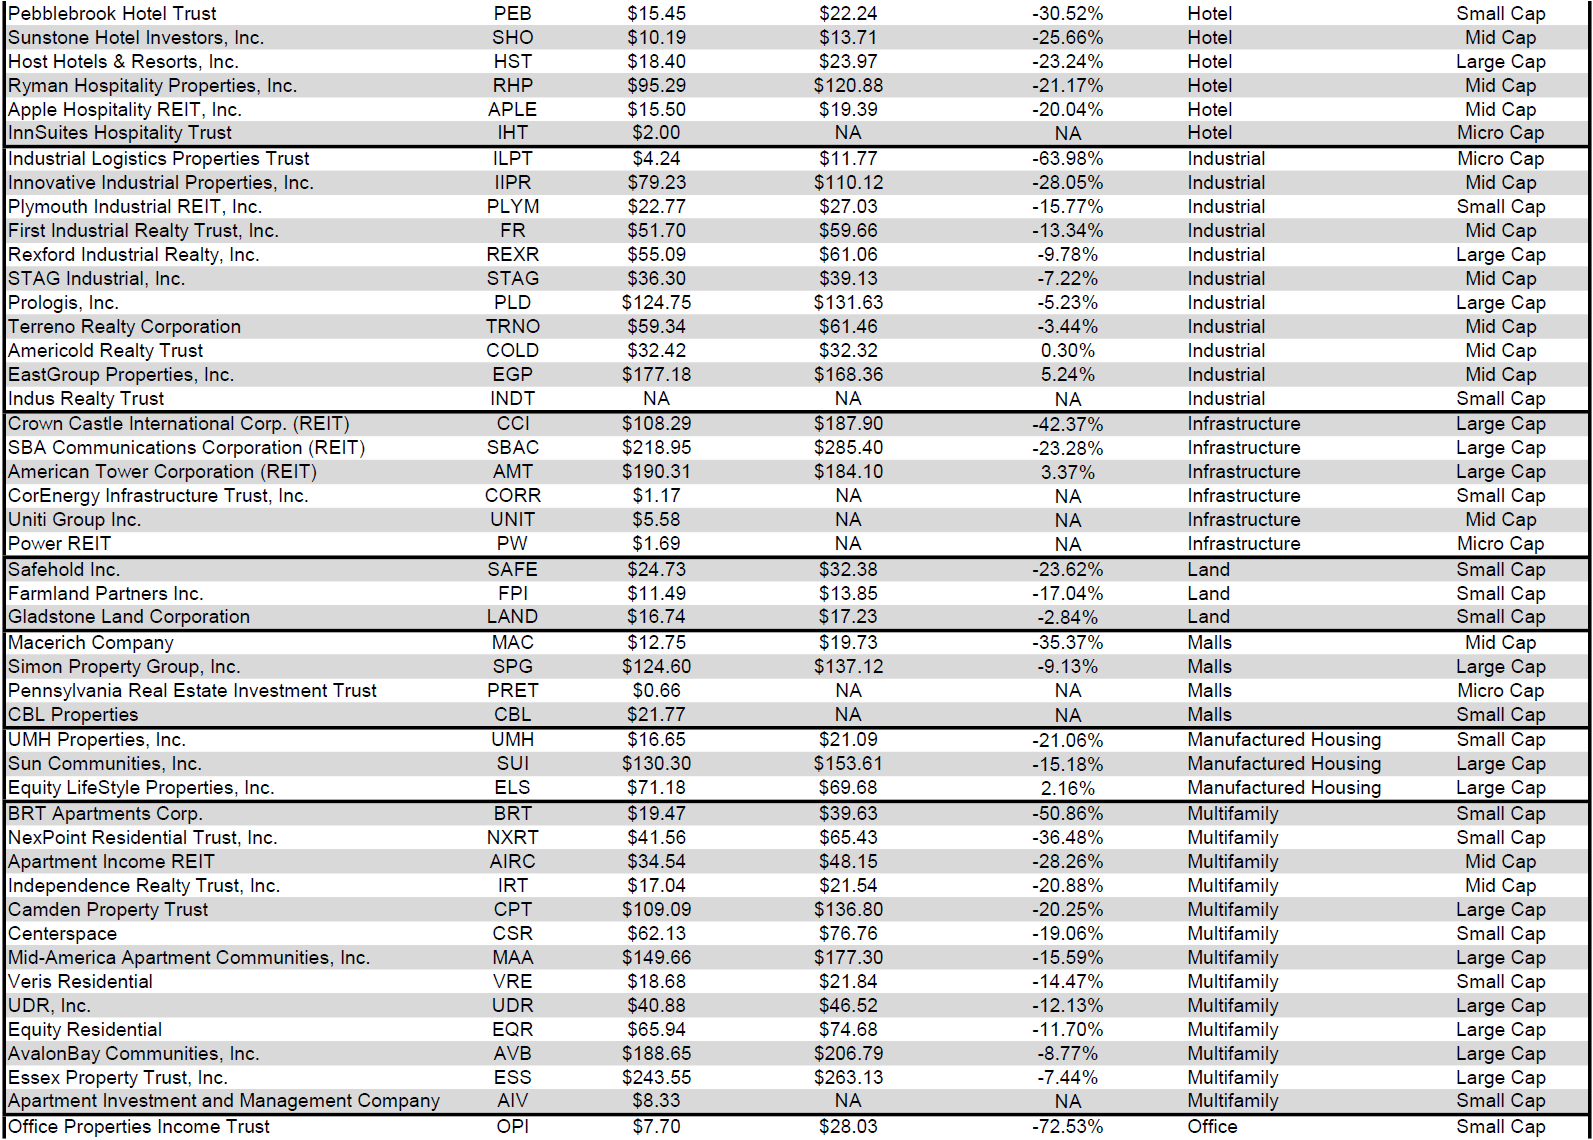
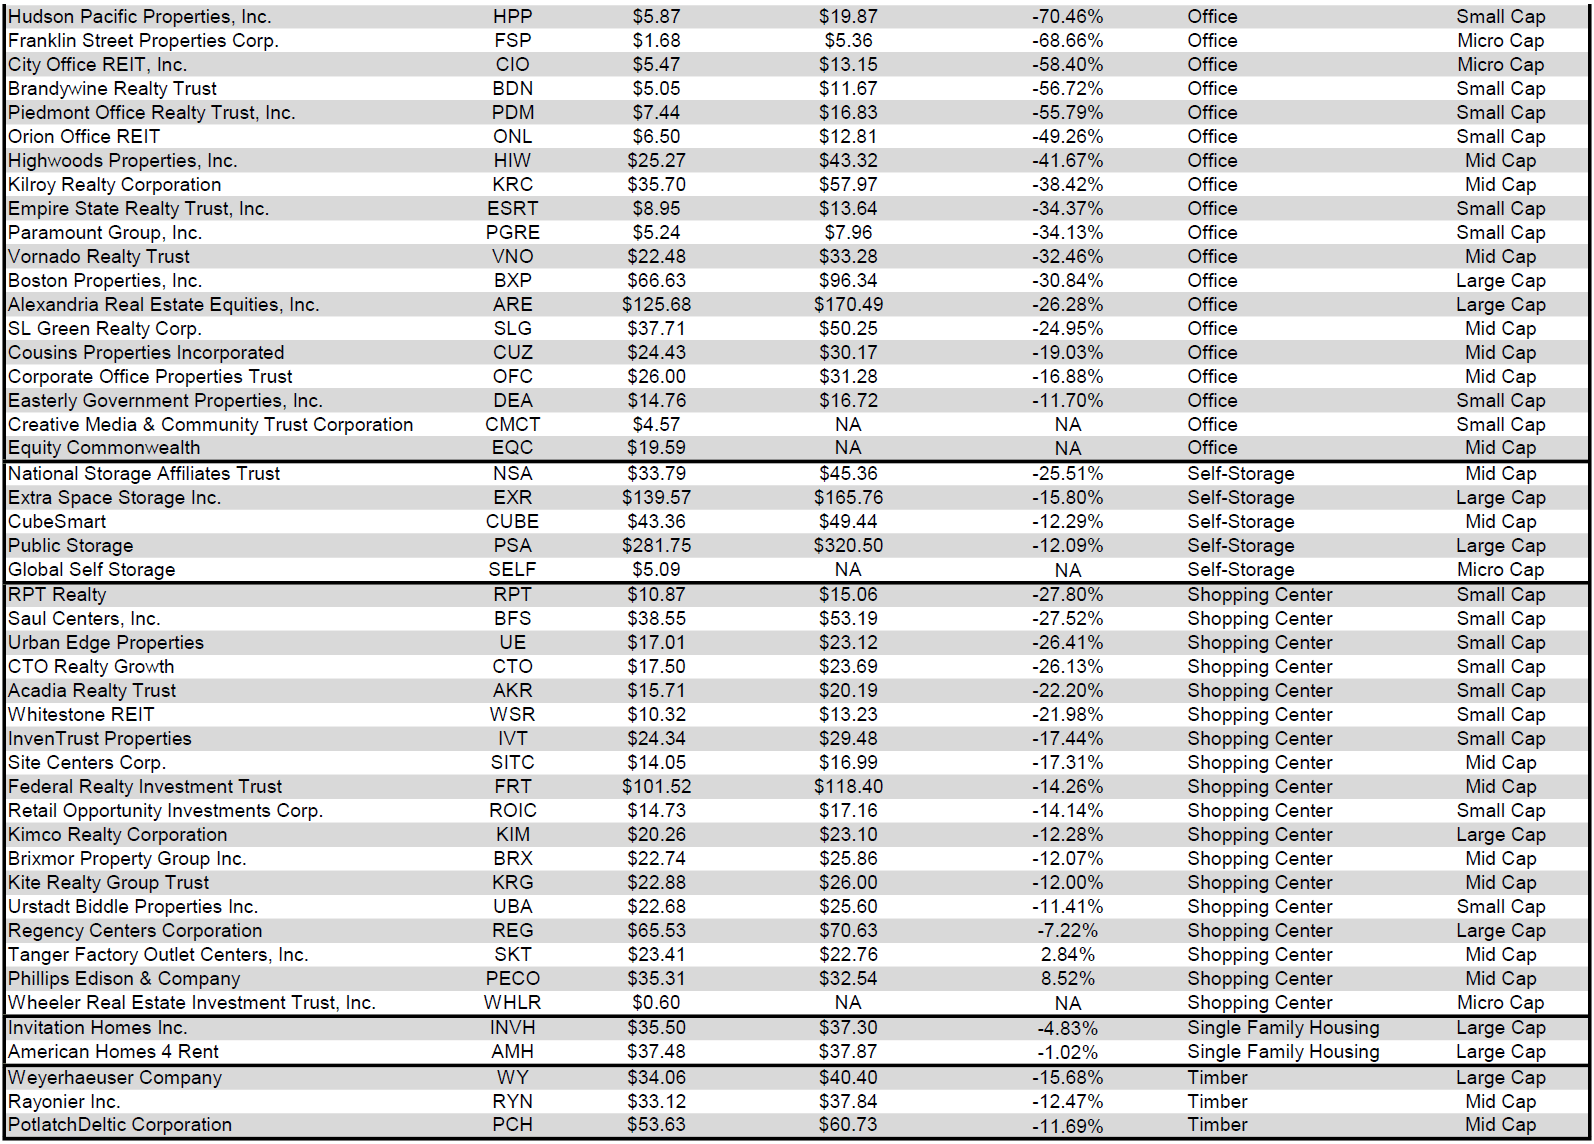
Below is a downloadable data table, which ranks REITs within each property type from the largest discount to the largest premium to NAV. The consensus NAV used for this table is the average of analyst NAV estimates for each REIT. Both the NAV and the share price will change over time, so I will continue to include this table in upcoming issues of The State of REITs with updated consensus NAV estimates for each REIT for which such an estimate is available.
Source: Table by Simon Bowler of 2nd Market Capital, Data compiled from S&P Global Market Intelligence LLC. See important notes and disclosures at the end of this article Source: Table by Simon Bowler of 2nd Market Capital, Data compiled from S&P Global Market Intelligence LLC. See important notes and disclosures at the end of this article Source: Table by Simon Bowler of 2nd Market Capital, Data compiled from S&P Global Market Intelligence LLC. See important notes and disclosures at the end of this article Source: Table by Simon Bowler of 2nd Market Capital, Data compiled from S&P Global Market Intelligence LLC. See important notes and disclosures at the end of this article

For the convenience of reading this table in a larger font, the table above is available as a PDF as well.
Takeaway
The large cap REIT premium (relative to small cap REITs) narrowed in July and investors are now paying on average about 27% more for each dollar of 2023 FFO/share to buy large cap REITs than small cap REITs (17.2x/13.5x - 1 = 27.4%). As can be seen in the table below, there is presently a strong positive correlation between market cap and FFO multiple.
Source: Table by Simon Bowler of 2nd Market Capital, Data compiled from S&P Global Market Intelligence LLC. See important notes and disclosures at the end of this article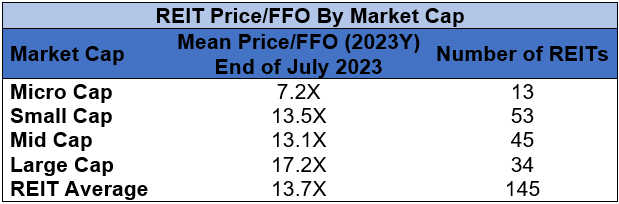
The table below shows the average NAV premium/discount of REITs of each market cap bucket. This data, much like the data for price/FFO, shows a strong, positive correlation between market cap and Price/NAV. The average large cap REIT (-7.79%) trades at a high single digit discount to NAV, while mid-cap REITs (-12.73%) trade at double-digit discount. Small cap REITs (-27.57%) trade at a little less than 3/4 of NAV. Micro caps on average continue to trade at less than half of their respective NAVs (-54.09%).
Source: Table by Simon Bowler of 2nd Market Capital, Data compiled from S&P Global Market Intelligence LLC. See important notes and disclosures at the end of this article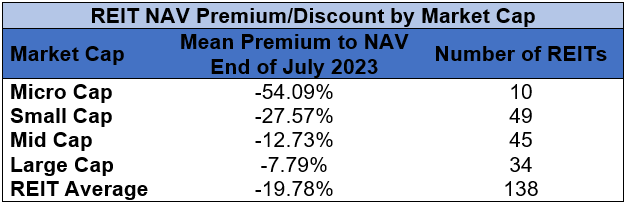
Bankruptcy filings rose in July from already elevated levels in June. The number of bankruptcies in just the first 7 months of 2023 have already surpassed the total bankruptcies for all of 2022. With inflation not yet under control and the Fed signaling that further rate hikes remain very much on the table, the pace of bankruptcies is not likely to taper off yet. As businesses are forced to refinance maturing debt at much higher interest rates or are potentially unable to refinance in a tighter lending environment, the pace of bankruptcies will remain elevated and may continue to accelerate.
Source: S&P Global Market Intelligence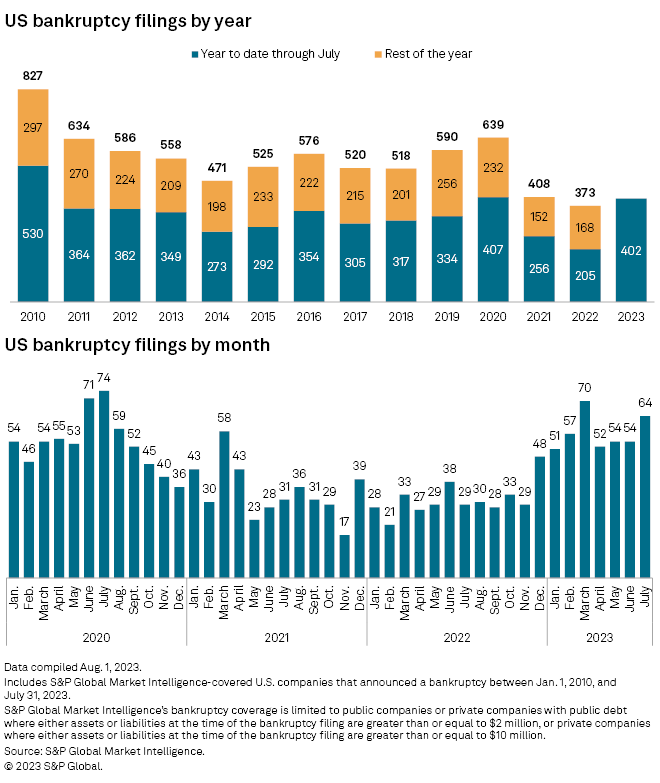
Despite an increasingly challenging economic backdrop, the REIT sector has continued to post strong earnings. An analysis by S&P Global Market Intelligence identified that 61.7% of REITs beat on FFO/share in Q2 2023 including an impressive 75% of Office REITs. Self Storage REITs fell short of earnings expectations in Q2 with twice as many missing on earnings than beating.
Source: S&P Global Market Intelligence
By far the largest FFO/share beat in Q2 came from Veris Residential (VRE), which beat analyst expectations by a remarkable 77.8%. Also notable was the huge 29.7% earnings beat posted by Medical Properties Trust (MPW), which has taken a significant share price beating over recent months.
Source: S&P Global Market Intelligence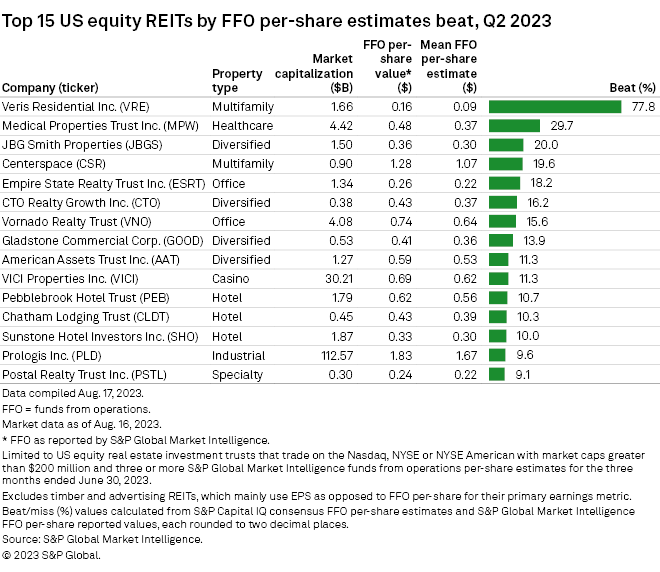
Whitestone REIT (WSR) was the only REIT to miss the FFO/share consensus estimate by more than 10%. However, 75% of that miss ($0.03/share of the $0.04/share miss) was driven by legal expenses rather than property level issues.
Source: S&P Global Market Intelligence
It is always important to understand key differences between individual REITs (such as differences in portfolio composition, capital structure and upcoming debt maturities) in order to successfully identify opportunities for generating alpha. However, it has become particularly crucial now that refinancing maturing debt will in virtually all situations need to be done at a higher interest rate than the maturing loan. REITs with fixed-rate debt and little to no debt maturing in upcoming years will be significantly less impacted by rising rates than will REITs with substantial exposure to floating rate debt or upcoming debt maturities.
Editor's Note: This article covers one or more microcap stocks. Please be aware of the risks associated with these stocks.
Dividends are scarce, we provide the solution

For everything you need to build a growing stream of dividend income, please consider joining Portfolio Income Solutions. As a member you will get:
- Access to a curated Real Money REIT Portfolio
- Continuous market and single stock analysis
- Data sets on every REIT
You will benefit from our team’s decades of collective experience in REIT investing. On Portfolio Income Solutions, we don’t only share our ideas, we also discuss best trading practices and help you become a better investor.
This article was written by

Simon Bowler is the Chief Communications Officer at 2nd Market Capital Advisory Corporation (2MCAC). 2MCAC specializes in the analysis and trading of real estate securities. Through a selective process and consideration of market dynamics, we aim to construct portfolios for rising streams of dividend income and capital appreciation.Our Portfolio Income Solutions Marketplace service provides stock picks, extensive analysis and data sheets to help enhance the returns of do-it-yourself investors.Investment Advisory Services
We now offer a way to directly invest in our Proprietary Investment Portfolio Strategy via REIT Total Return, which replicates our activity in client accounts. Total Return client’s brokerage accounts are automatically invested simultaneously and at the same price when we make a trade in the REIT Total Return Portfolio (also known as 2CHYP).
Learn more about our REIT Total Return Portfolio.Simon Bowler, along with fellow SA contributors Dane Bowler and Ross Bowler, is an investment advisory representative of 2nd Market Capital Advisory Corporation (2MCAC), a state-registered investment advisor.Full Disclosure. All content is published and provided as an information source for investors capable of making their own investment decisions. None of the information offered should be construed to be advice or a recommendation that any particular security, portfolio of securities, transaction, or investment strategy is suitable for any specific person. The information offered is impersonal and not tailored to the investment needs of the specific person. Please see our SA Disclosure Statement for our Full Disclaimer.
Analyst’s Disclosure: I/we have a beneficial long position in the shares of SLG, MPW & WSR either through stock ownership, options, or other derivatives. I wrote this article myself, and it expresses my own opinions. I am not receiving compensation for it. I have no business relationship with any company whose stock is mentioned in this article.
Important Notes and Disclosure All articles are published and provided as an information source for investors capable of making their own investment decisions. None of the information offered should be construed to be advice or a recommendation that any particular security, portfolio of securities, transaction, or investment strategy is suitable for any specific person. The information offered is impersonal and not tailored to the investment needs of any specific person. Readers should verify all claims and do their own due diligence before investing in any securities, including those mentioned in the article. NEVER make an investment decision based solely on the information provided in our articles. It should not be assumed that any of the securities transactions or holdings discussed were profitable or will prove to be profitable. Past performance does not guarantee future results. Investing in publicly held securities is speculative and involves risk, including the possible loss of principal. Historical returns should not be used as the primary basis for investment decisions. Commentary may contain forward-looking statements which are by definition uncertain. Actual results may differ materially from our forecasts or estimations, and 2MCAC and its affiliates cannot be held liable for the use of and reliance upon the opinions, estimates, forecasts, and findings in this article. S&P Global Market Intelligence LLC. Contains copyrighted material distributed under license from S&P 2nd Market Capital Advisory Corporation (2MCAC) is a Wisconsin registered investment advisor. Simon Bowler is an investment advisor representative of 2nd Market Capital Advisory Corporation.
Seeking Alpha's Disclosure: Past performance is no guarantee of future results. No recommendation or advice is being given as to whether any investment is suitable for a particular investor. Any views or opinions expressed above may not reflect those of Seeking Alpha as a whole. Seeking Alpha is not a licensed securities dealer, broker or US investment adviser or investment bank. Our analysts are third party authors that include both professional investors and individual investors who may not be licensed or certified by any institute or regulatory body.