Energy Transfer: The Cash Flow Beast Everyone Should Own

Summary
- Energy Transfer is a major player in the transportation of natural gas and crude oil, with significant market share in the US and global markets.
- Despite a decrease in total revenues, the company's adjusted EBITDA and distributable cash flow remain relatively stable.
- The company's strong liquidity, growth ambitions, and attractive dividend yield make it an appealing investment option in the energy sector.
- With upcoming investor interest, Energy Transfer could attain a 10x EV/EBITDA valuation, in my view. Coupled with a high dividend yield of over 9%, the company's appeal is further amplified.
- Looking for a helping hand in the market? Members of Beyond the Wall Investing get exclusive ideas and guidance to navigate any climate. Learn More »
PashaIgnatov
The Company
Energy Transfer (NYSE:ET) is a $41-billion market cap firm that operates an extensive pipeline network across 41 US states and plays a vital role in transporting 30% of US natural gas, 35% of US crude oil, and 20% of global natural gas liquids exports.
ET's factsheet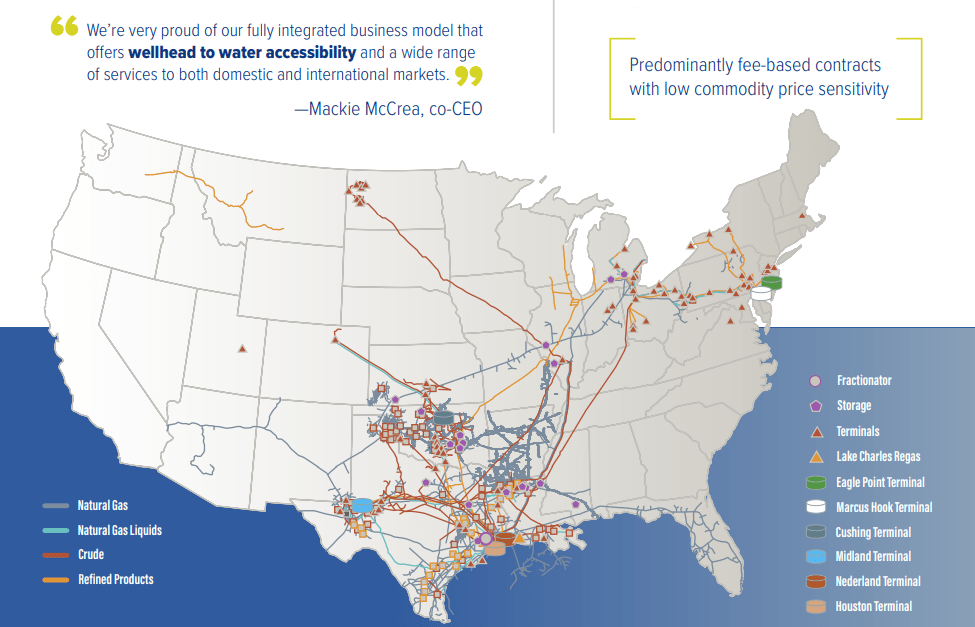
The company is divided into 5 segments and has investments in subsidiaries involved in various energy-related activities. These include compression services, natural gas marketing, and resource management. They also hold interests in other companies engaged in compression services and manage coal and natural resource properties, generating revenue from royalties and land management activities.
Energy Transfer's Q2 FY2023 NGL fractionation, transportation, and midstream gathered volumes hit record highs of 5%, 13%, and 8% growth, respectively. Intrastate natural gas transportation rose by 3%, while interstate gas transportation saw a substantial 17% increase. Crude transportation and terminal volumes surged by 23% and 15%, respectively.
The increase in volumes helped slightly offset the sharp fall YoY in the price of transported commodities in all the company's main segments. But of course, this was not enough to achieve similar financial results to the previous year.
ET's 10-Q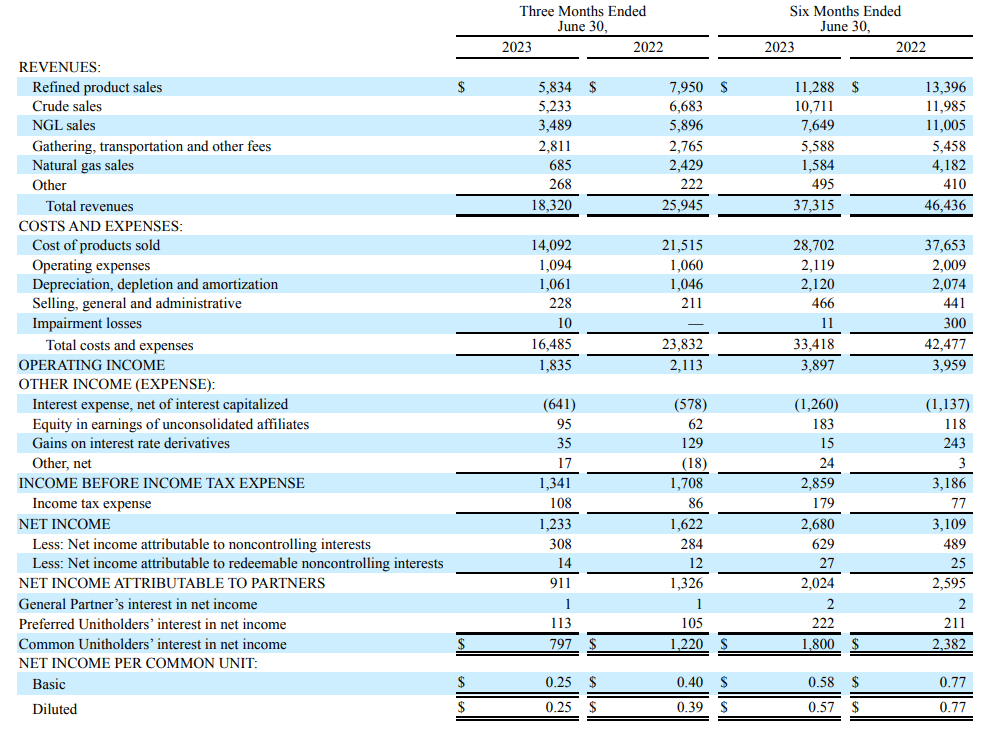
Despite total revenues falling by 29.3% YoY in Q2, ET's adjusted EBITDA amounted to $3.12 billion compared to $3.23 billion in Q2 2022, which is not that bad. Distributable cash flow [DCF] was $1.55 billion, compared to $1.88 billion in Q2 2022, with excess cash flow after distributions at $579 million.
As of June 30, 2023, their credit facility had $2.36 billion available. The company invested ~$387 million in growth CAPEX for Q2 FY2023. ET acquired Lotus Midstream Operations and continues to integrate operations. Lake Charles LNG secured non-binding agreements for long-term LNG offtake totaling 3.6 million tonnes per annum.
The company's liquidity is at a very good level, and the constant attempts to expand the volume base speak, in my opinion, to the quality of the management of the excess cash flow. Management is clearly looking to the years ahead and is not limited to the current conditions of the still ongoing bull oil & gas cycle.
Long-term debt on the balance sheet decreased by 7.4% compared to the previous year, as part of the debt was transferred to short-term debt, which matures in 2024. The company's cash flow capacity seems sufficient, in my opinion, to service the debt easily; the debt burden itself is not high in relation to equity.
ET projected adjusted EBITDA for FY2023 to range between $13.1 billion and $13.4 billion. That's around 15.4% to the consensus revenue figure Wall Street expects from ET for FY2023:
Seeking Alpha, ET stock, Earnings Estimates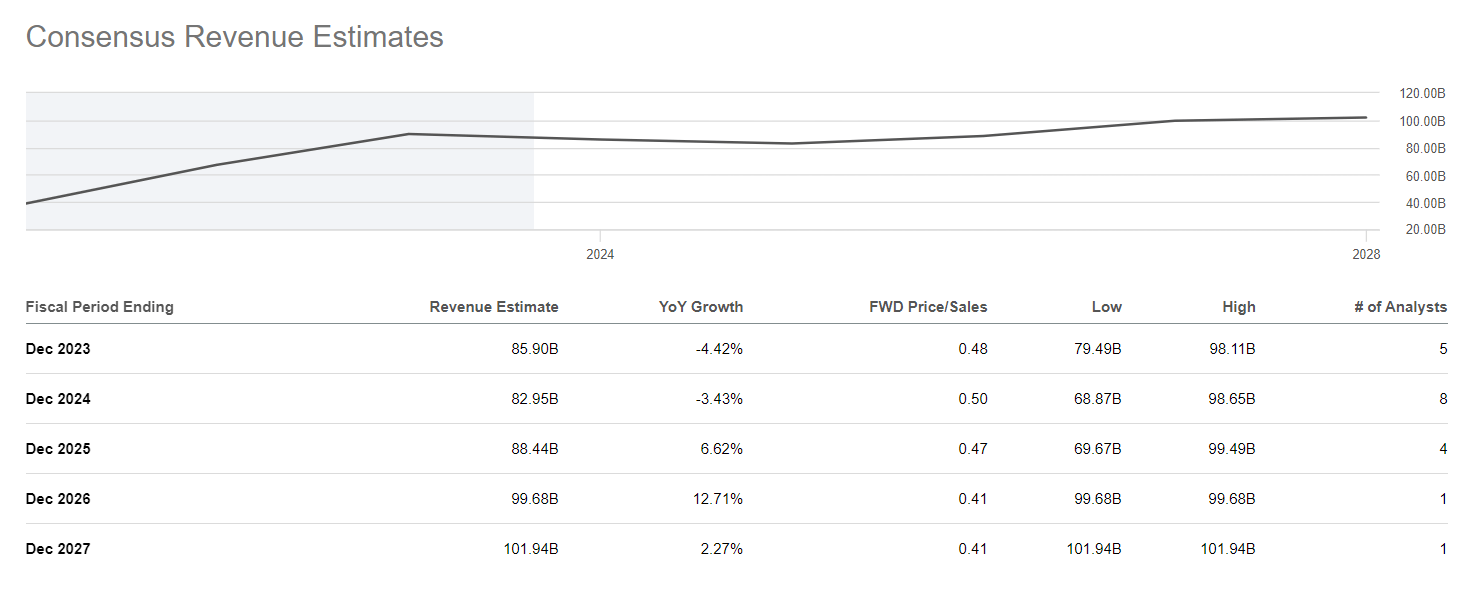
A quarterly cash distribution of $0.31 per common unit ($1.24 annualized) was announced for Q2 2023. This puts the forward yield at ~9.5%, which is well above average even among energy stocks. Many readers are probably wondering if this yield is sustainable, as the O&G sector is very cyclical and unstable to all sorts of macro issues. Historically, ET's payout grew at a CAGR of 6.38% [10-year period] over the long term. Today, industry analysts predict that ET's dividend yield will increase to 10.21% by FY2025:
Seeking Alpha Premium, ET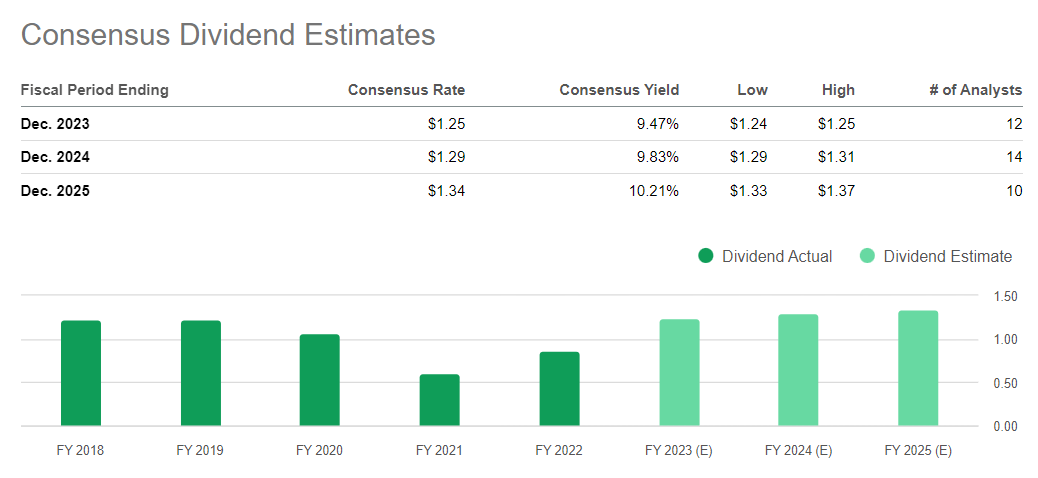
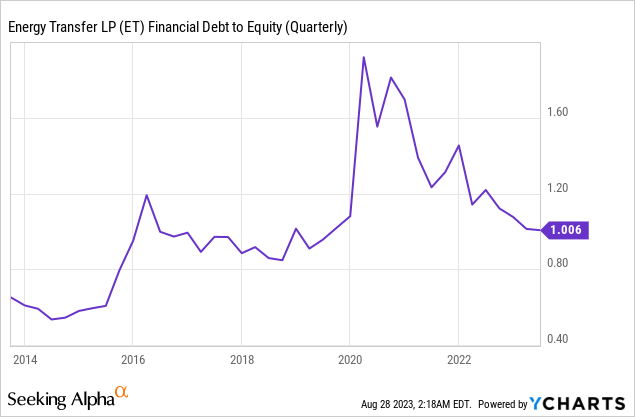
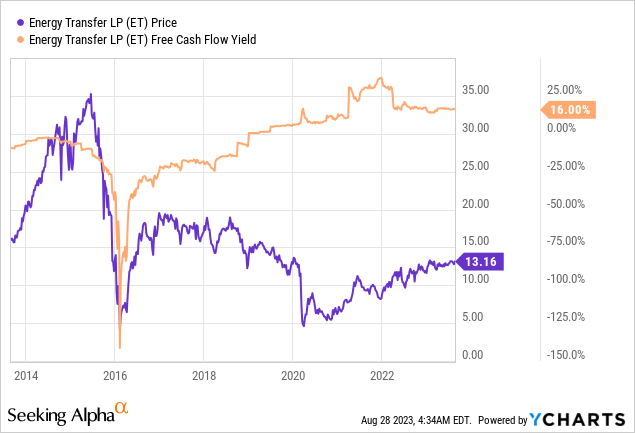
Like many analysts at Seeking Alpha, I foresee difficulties for the development of the global economy in the foreseeable future - this should certainly put pressure on demand for hydrocarbons of all types. However, in the case of ET, this seems to be partially priced in, as the yield is so high even though from a historical perspective we are now roughly in the zone of normality:
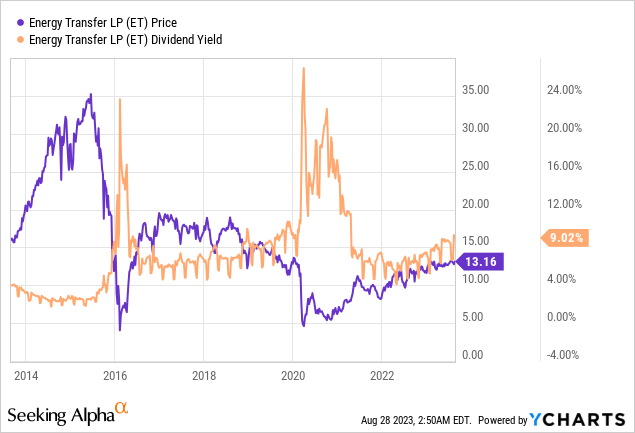
Why are most of the risks priced in?
Because the falls of 2015 and 2020 in the chart above had very different reasons than the ones that are likely to happen next in my view.
This time, the major oil exporters appear to be aware of the medium-term risks and are positioning their production levels accordingly. This has led to one of the most oil price-supportive setups in crude oil inventories today:
BofA [August 15, 2023 - proprietary source]![BofA [August 15, 2023 - proprietary source]](https://static.seekingalpha.com/uploads/2023/8/28/49513514-1693207623760069_origin.png)
At the same time, demand for certain activities has not yet recovered from COVID, such as the demand for jet fuel in China:
Goldman Sachs [August 24, 2023 - proprietary source]![Goldman Sachs [August 24, 2023 - proprietary source]](https://static.seekingalpha.com/uploads/2023/8/28/49513514-1693207296808252_origin.png)
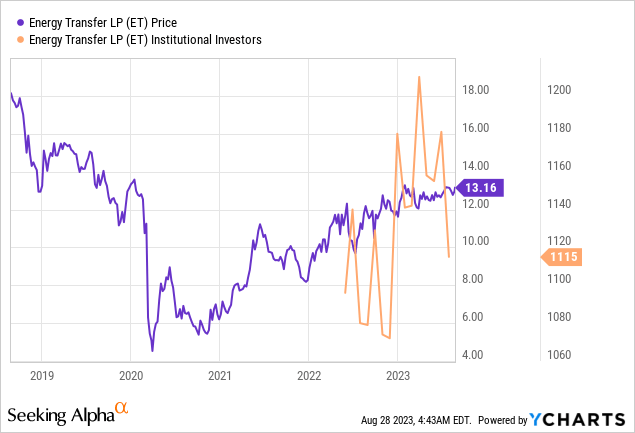
If we look at the positioning of hedge funds, the energy sector does not seem to be that crowded so far, despite its superior rise last month:
Ned Davis [August 24, 2023 - proprietary source], author's notes![Ned Davis [August 24, 2023 - proprietary source], author's notes](https://static.seekingalpha.com/uploads/2023/8/28/49513514-16932084112017806_origin.png)
Seeking Alpha, Market Data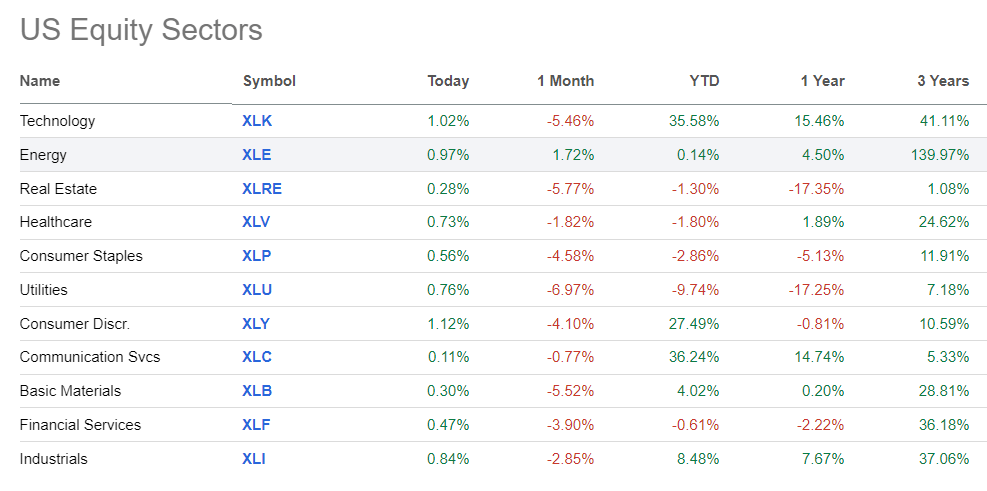
In my opinion, the energy sector has not yet lost its attractiveness for investors, as buying volumes have just started to return to the market, according to data from Ned Davis [proprietary source]. The valuation of the sector as a whole is also still enticing. The energy sector accounts for 12.4% of the S&P 500's gains, third only to technology and financials. However, it accounts for only 4.3% of the index's market capitalization, placing it 8th.
ET itself should get an additional tailwind from the growing buying power in the sector, as the company looks like a very reliable midstream player with a good balance sheet, healthy growth ambitions, and now a very attractive dividend yield, which sell-side analysts believe is set to rise further.
But what about the attractiveness of the valuation of the ET stock itself?
The Valuation
Again, I suggest looking at a company's valuation in a historical context, based on both TTM and FWD metrics. I usually look at EV/EBITDA [in the case of oil and gas - EBITDAR]. Since YCharts does not provide data on EBITDAR values, I will focus on the classic calculation formula for simplicity of visualization.
So let's take a look back at 2020. Crude oil futures fell into negative territory for the first time in their history, forcing some derivatives textbooks authors to urgently add to their new editions. Energy companies faced unprecedented downtime - no one needed oil. The global economy was at a standstill, and the prevailing uncertainty led to a general panic in the stock market. As we can see in the chart below, at the height of this panic, the EV/EBITDA of ET dropped to about 7x, possibly even a bit lower. After that, the drop in actual EBITDA values from ET led to a sharp increase in this metric, which is logical.
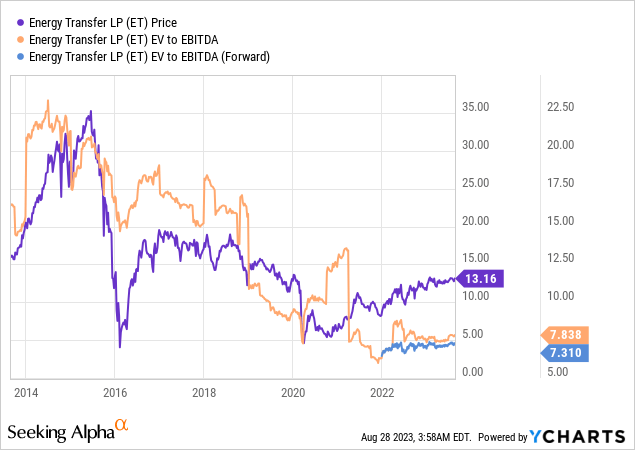
Since 2021, oil and gas companies, including ET, have been on the upswing, leading to a further decline in their EV/EBITDA ratios. As I wrote above, this sector is very cyclical, so it is not surprising that EV/EBITDA multiples fall sharply at some point: most likely they will rise sharply again when selling volumes/prices fall.
But here I have a logical question: if ET's volumes are growing at the moment [we saw it in Q2] and the market is waiting for a probable increase in energy prices in the foreseeable future due to the building supply/ demand imbalance, why is the FWD metric even lower than the TTM metric, when the logic of things should be the other way around? If you have an answer to my question, please let me know in the comments below.
I assume that even if the multiples of ET remain where they are now, income-seeking investors in the form of large funds (and not only them) should come to buy this stock because of its growth approach and shareholder return policy. The distribution yield looks quite stable even against the backdrop of the sharp decline in the share price in recent months.
Even in the event of a mild recession, ET should feel relatively comfortable thanks to its margin of safety. How much further should its EV/EBITDA ratio fall?
And what is the growth upside of ET's FCF yield in this case?
I simply don't have answers to my last 2 questions.
The Verdict
My current Buy rating has a number of pitfalls. First, it is not at all necessary that hydrocarbon prices continue to rise, as we have seen in recent weeks. I believe that we still have a mild recession ahead of us due to declining purchasing power and rising real interest rates. Oil prices are very elastic to changes in market demand. So if the US manufacturing activity feels more pain than I expect, the increase in volume from ET may not be enough to keep it undervalued.
Be that as it may, it seems to me that ET is now an excellent long-term choice for income-seeking investors today, while not all funds have yet managed to put their capital into this cash flow beast.
If the influx of new investors I expect occurs, the current valuation of ET will allow it to rise to 10 times EV/EBITDA, based on historical trends. At a current enterprise value of $104 billion, ET will become ~15% undervalued in this case. Amid its high dividend yield of over 9%, ET looks even more attractive.
Therefore, ET stock is an undervalued "Buy", in my view.
Thanks for reading!
Hold On! Can't find the equity research you've been looking for?
Now you can get access to the latest and highest-quality analysis of recent Wall Street buying and selling ideas with just one subscription to Beyond the Wall Investing! There is a free trial and a special discount of 10% for you. Join us today!
This article was written by

The chief investment analyst in a small family office registered in Singapore, responsible for developing investment ideas in equities, setting parameters for investment portfolio allocation, and analyzing potential venture capital investments.
A generalist in nature, common sense investing approach. BS in Finance. The thesis description can be found in this article.
During the heyday of the IPO market, I developed an AI model [in the R statistical language] that returned an alpha of around 24% over the IPO market's return in 2021. Currently, I focus on medium-term investment ideas based on cycle analysis and fundamental analysis of individual companies and industries.
Get a free 7-day trial +25% off for up to 12 months on TrendSpider with the coupon code: DS25
**Disclaimer: Associated with Oakoff Investments, another Seeking Alpha Contributor
Analyst’s Disclosure: I/we have no stock, option or similar derivative position in any of the companies mentioned, but may initiate a beneficial Long position through a purchase of the stock, or the purchase of call options or similar derivatives in ET over the next 72 hours. I wrote this article myself, and it expresses my own opinions. I am not receiving compensation for it (other than from Seeking Alpha). I have no business relationship with any company whose stock is mentioned in this article.
Seeking Alpha's Disclosure: Past performance is no guarantee of future results. No recommendation or advice is being given as to whether any investment is suitable for a particular investor. Any views or opinions expressed above may not reflect those of Seeking Alpha as a whole. Seeking Alpha is not a licensed securities dealer, broker or US investment adviser or investment bank. Our analysts are third party authors that include both professional investors and individual investors who may not be licensed or certified by any institute or regulatory body.
Recommended For You
Comments (8)

ET has been easy money for 18 months.
Buy long calls or spreads on the dips.
Buy some units for income.
Buy some preferreds for income like a high grade money market.
Today was payday. So was Friday!