August MDA Breakout Stocks Week 35 - 2023: High-Frequency Gainers To Give You An Edge

Summary
- Two new sample Breakout Stocks for Week 35 curated by the MDA model for a 10% short-term upside along with a Dow pick.
- The Momentum Gauges, S&P 500 Gauges, and Weekly Gauges all continue negative after the longest positive signal since March 2021 on the weekly gauges.
- Last week three of the four picks gained over the 10% mark, closing up an average of +9.17% for the week with strong Segment 6 momentum.
- Long-term January portfolios: Piotroski +31.85%, Positive Forensic +18.0%, Mid-year Growth & Dividend +9.03%, and Active ETF up +18.4% YTD.
- Looking for more investing ideas like this one? Get them exclusively at Value & Momentum Breakouts. Learn More »
simonbradfield
Introduction
The Weekly Breakout Forecast continues my doctoral research analysis on MDA breakout selections over more than 8 years. This high frequency breakout subset of the different portfolios types I regularly release has now reached 326 weeks of public selections on Seeking Alpha as part of this ongoing live forward-testing research. The frequency of 10%+ returns in a week is averaging over 4x the broad market averages since testing began. Some article changes are ongoing and my regular premium articles will now follow this schedule.
| MDA Breakout picks (from JD) | Every 2 Weeks |
| Dow 30 stock picks | Every 2 Weeks |
| ETF / ETN picks from MDA model | IG only |
| Bounce/Lag Momentum picks (bonus from Grant) | IG only |
| Market and Momentum Gauge Signals | IG only |
| Growth & Dividend mega cap picks | Monthly |
| Long Term Value Portfolios | Semi-Annually |
2023 Performance of the MDA Algorithm
- Last week three out of four picks gained over the 10% target even as the Negative Momentum Gauge signal continues from Aug 10th.
- All the Week 34 MDA picks gained for an average +9.17% while the S&P 500 had large daily reversals each day this week for net gain of 0.82%
- The count of weekly portfolios with at least one stock gaining over 10% in less than a week has increased to 258 out of 326 trading weeks (79.1%).
- Over the past 1-year buy/hold the S&P 500 is up +4.92%
- Over the past 1-year buy/hold the Nasdaq is up +7.53%
VMBreakouts.com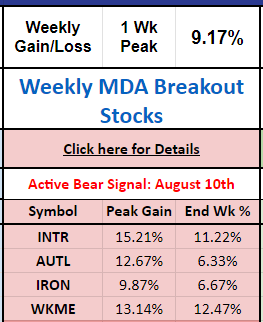
As long term investors know, you can compound $10,000 into $1 million with 10% annual returns in less than 50 years. This model serves to increase the rate of 10% breakouts into 52 weekly intervals instead of years.
Methodology
Using a statistical model of multiple discriminant analysis (MDA), the weekly selections rely on a combination of fundamental, technical, and behavioral variables to identify changes in the momentum cycle. The new MDA charts in development illustrate one of the picks this week, Erasca Inc (ERAS) in a very early breakout signal testing $3/share price resistance. So far none of the prior breakout signals have sustained very long with this biotech stock, but the frequency of green signals are increasing from the lows.
app.VMBreakouts.com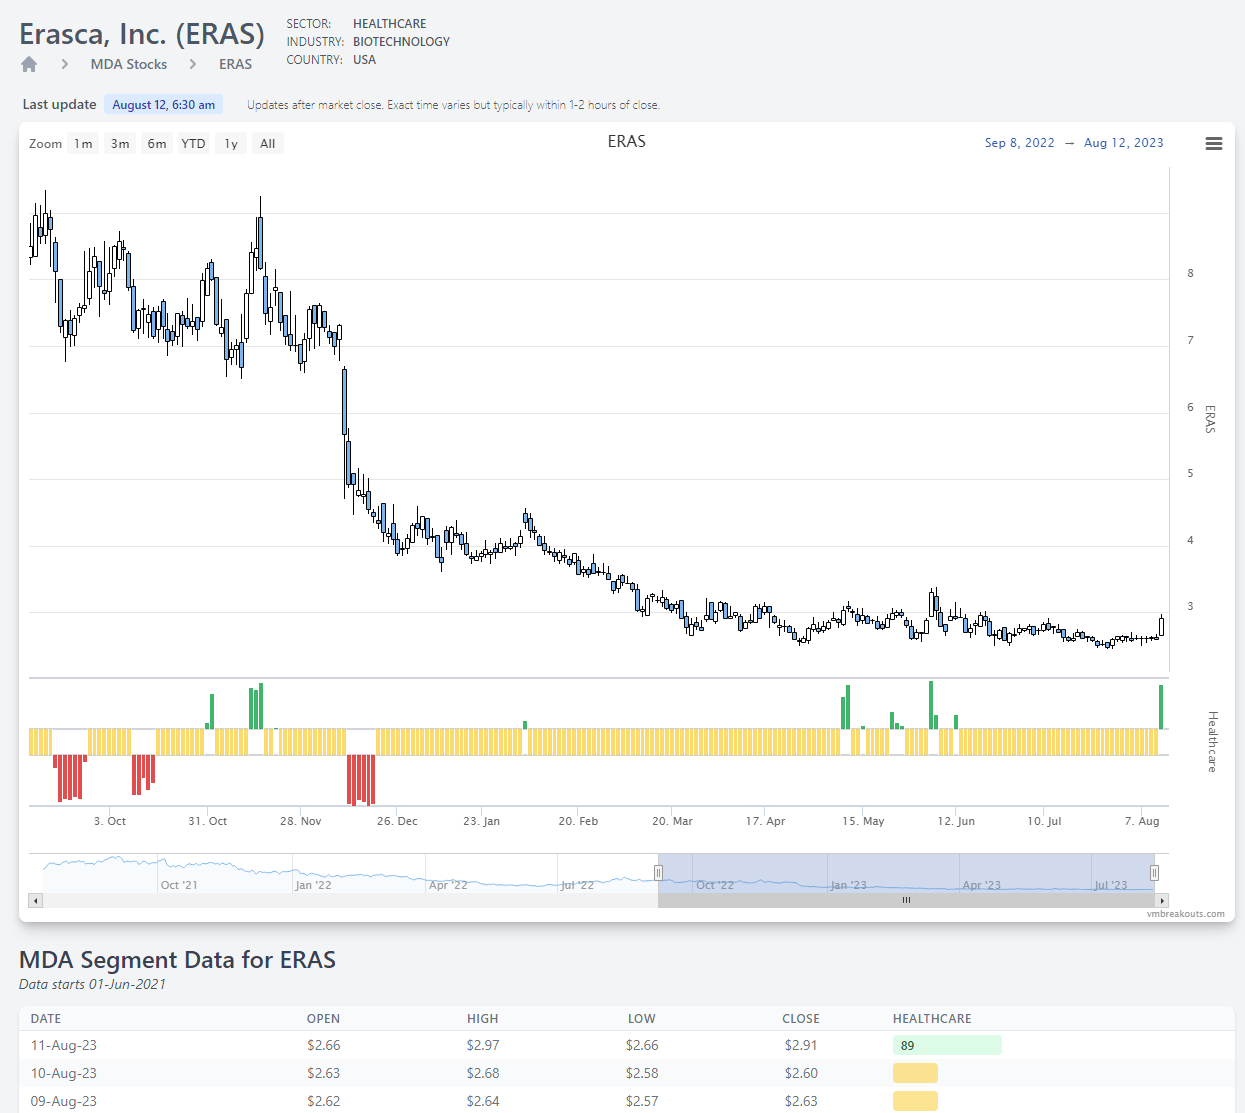
This MDA chart shows the prior breakout signals into Segment 6 positive acceleration (green) for strong gains and how long those conditions lasted. These live MDA charts will soon be available for stocks across the three largest US exchanges.
Prior to the development of these charts, I used seven years of arbitrary 1-week sample periods to measure if the breakout returns were statistically significant and simulate annual returns. Since the live forward testing started in 2017 on Seeking Alpha, more than 450 stocks have gained over 10% in less than the measured week. Now it is possible to move away from 1-week arbitrary measurements to see when the breakout signal started and sell when conditions change. More details on the MDA Breakout methodology are available here.
Currently 87 out of 136 selections (63.9%) have gained over 5% in their arbitrarily measured week this year. These strong results are not adjusted for positive or negative market MG signals which further improve the results. These returns are consistent with prior years' performances even those during Federal Reserve QE stimulus years of 2019 and 2020 over 104 weeks.
VMBreakouts.com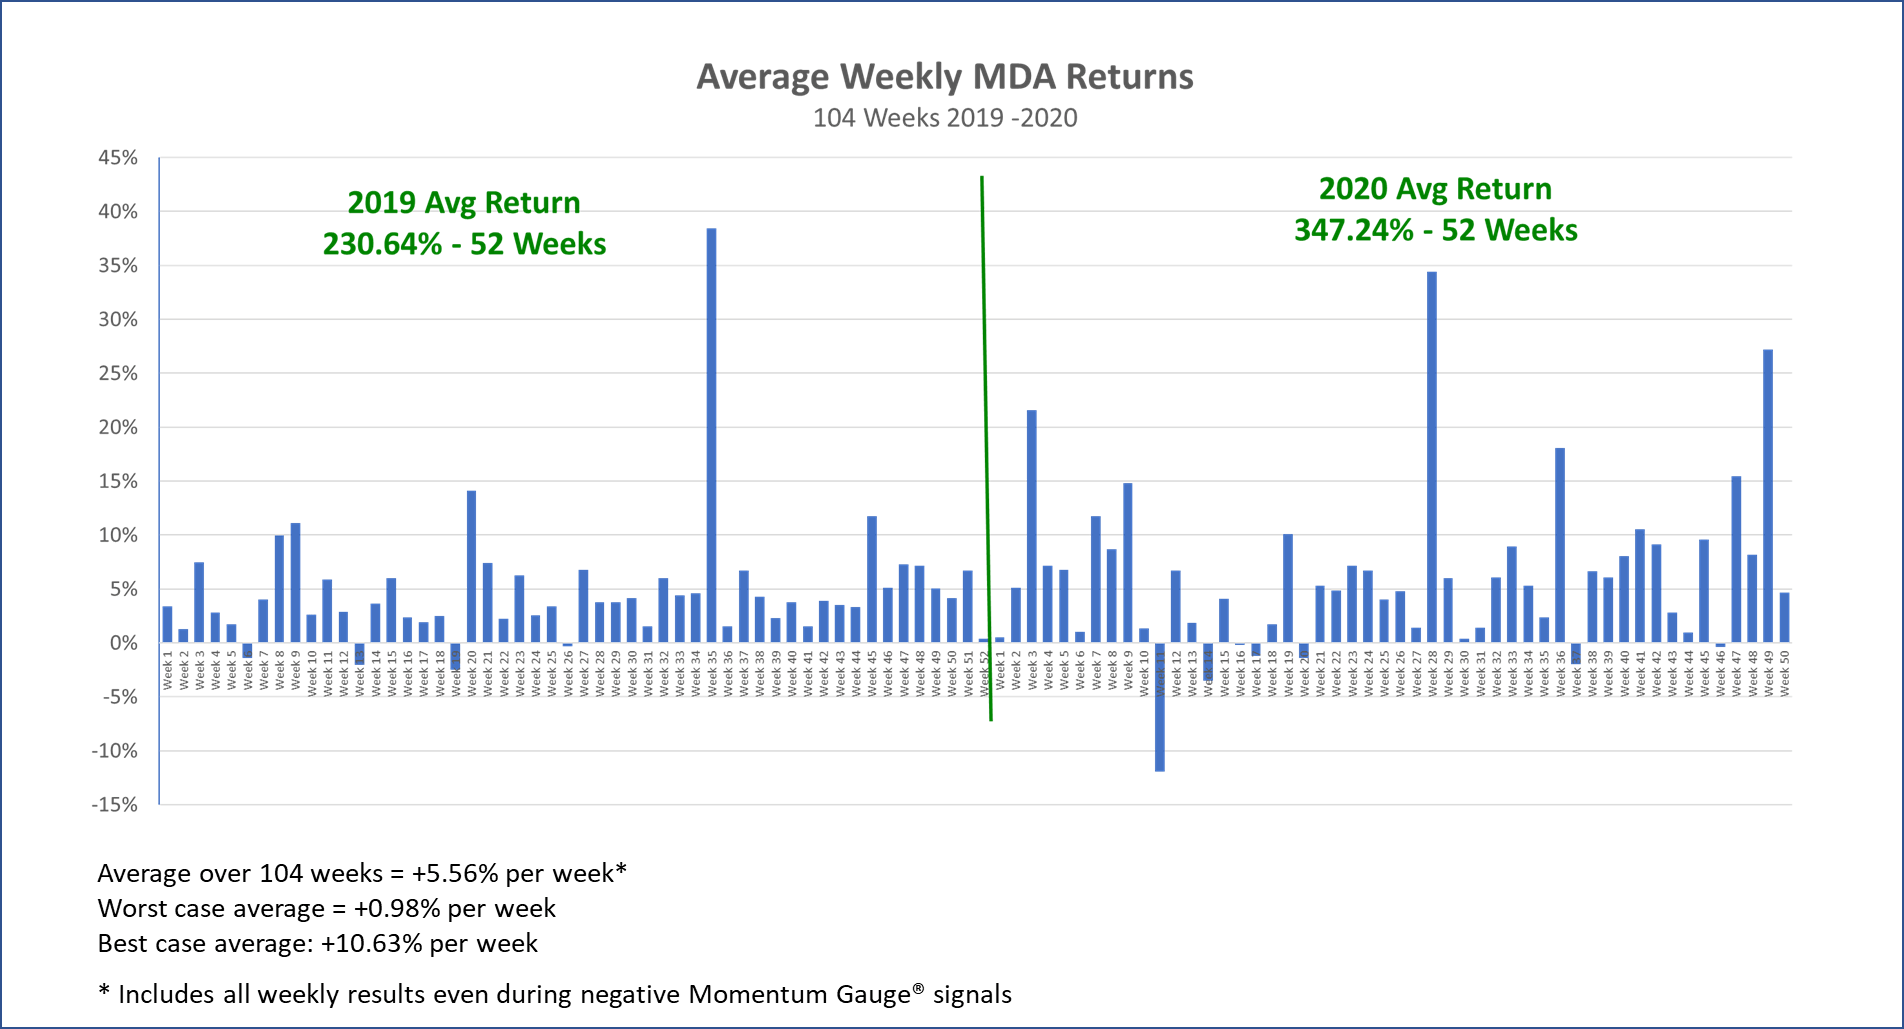
Warning: These stocks are measured from actual release on Friday morning to Friday close. Sample stocks are released publicly over the weekend.
Why do finance companies admit that "timing is everything," but when it comes to investing your money many tell their clients to "just buy/hold and try to ignore the downturns?" I submit most investors would rely on timing signals instead of buy/hold positions for 24 months with no gains, or worse.
If timing helps you gain just 1% a week or avoid major market downturns, you will significantly outperform all the long term market averages.
It is possible to beat the markets by adjusting our trades to the Momentum Gauges and avoiding the most negative weeks while loading up during the most positive signals. The financial industry has incentives to make you to stay in the markets year round and that does not always produce good results.
Momentum Gauges Dashboard for Week 35
The Daily Market and S&P 500 Momentum Gauges continue negative. The Weekly Gauges also continue negative after the longest positive run of 13 weeks since March of 2021.
app.VMBreakouts.com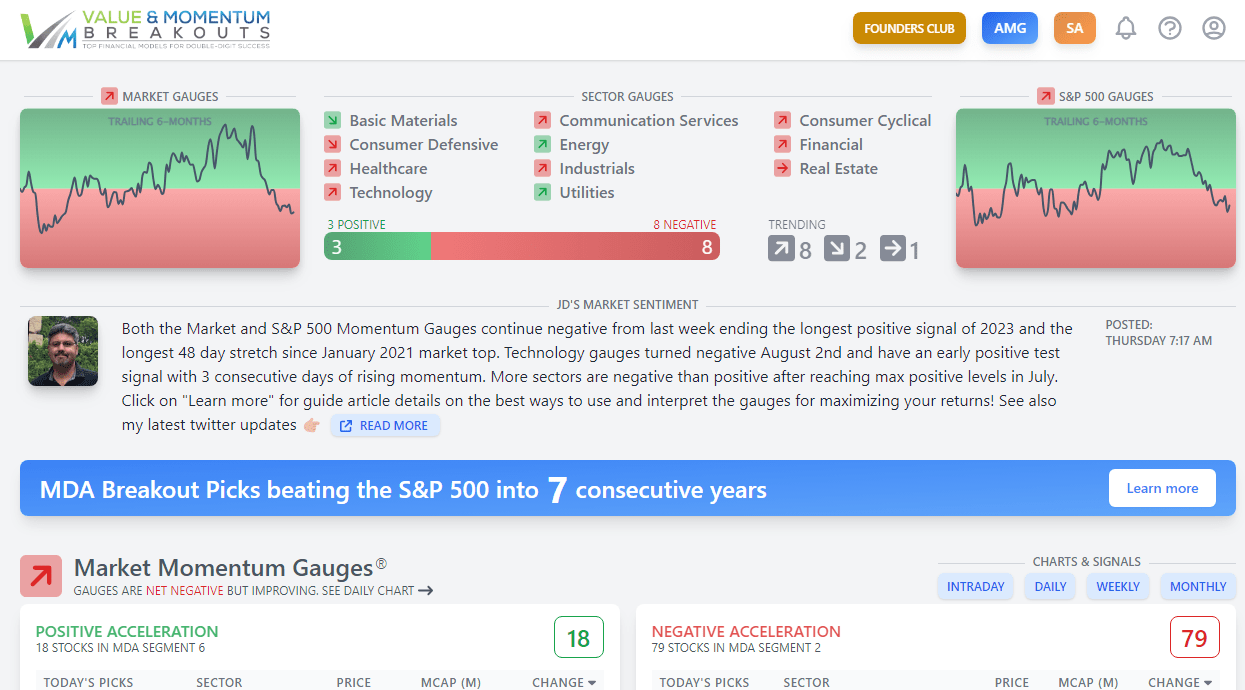
Remember: Market momentum is most important, then sector momentum, then stock MDA characteristics. You can own an excellent stock, but if larger momentum conditions are leading to strong outflows to cash and safety, it is harder for your stock to get a bid up in price.
You can find my long term outlook articles here for 2023 that may carry on even longer than I forecasted as the Fed has stated that inflation could remain above their 2% target into 2025:
- US Debt Downgrade And Apple Breakdown, Major Catalysts For A Cyclical Pullback
- Forecasting The S&P 500 For 2023: Year Of The Fed-Pivot And More Record Volatility
We are entering the August / September cyclical pullback period detailed in my article above. There are strong early indicators of a repeat of the August 2022 negative MG signal. Consider the similarities with bear bounces on iShares Russell 2000 ETF (IWM) to the key $190/share resistance level over the past two years.
twitter.com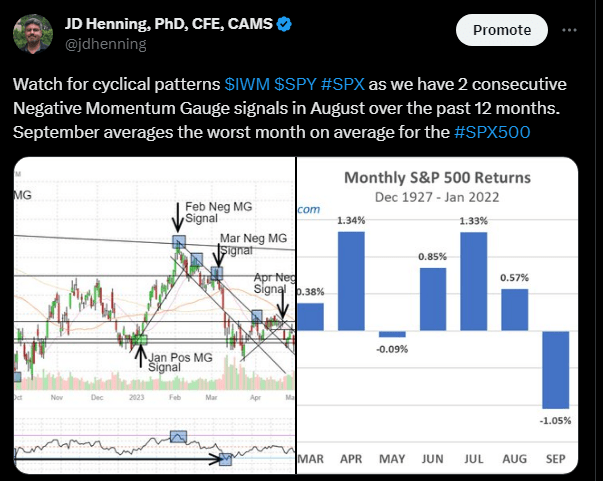
Weekly Breakout Returns
The ongoing competition between the Bounce/Lag Momentum model (from Prof Grant Henning, PhD Statistics) and MDA Breakout picks (from JD Henning, PhD Finance) are shown below with / without using the Momentum Gauge trading signal. The per-week returns equalize the comparison where there were only 16 positive trading weeks last year using the MDA trading signal (negative values below 40).
VMBreakouts.com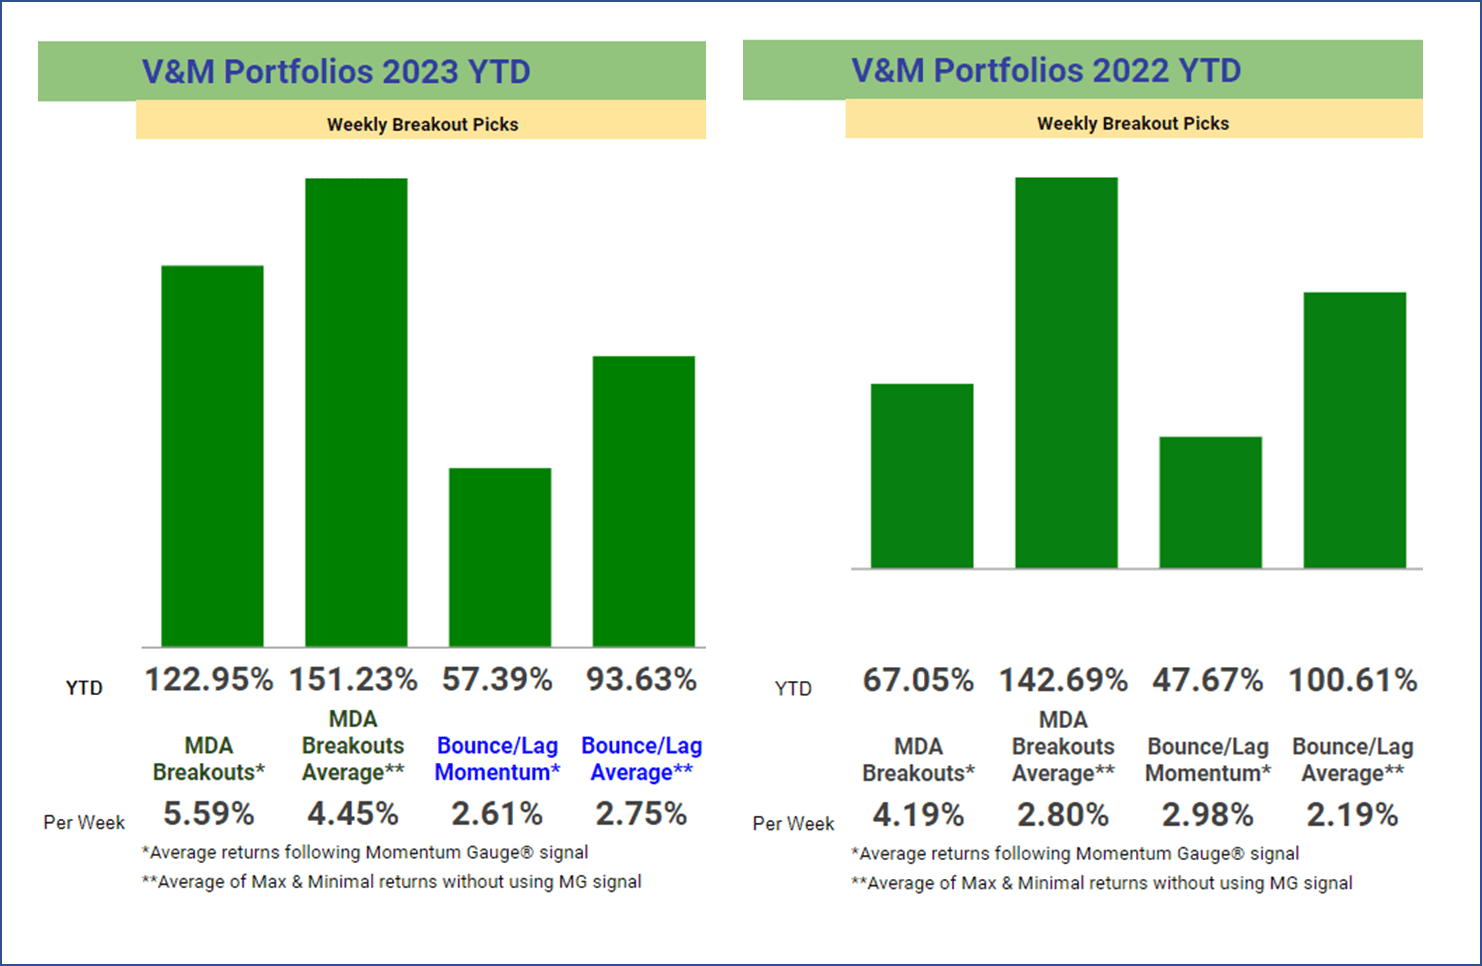
For 2022, the worst market since 2008: 113 MDA picks gained over 5%, 52 picks over 10%, 22 picks over 15%, and 13 picks over 20% in less than week. These are statistically significant high frequency breakout results despite many shortened holiday weeks.
Historical Performance Measurements
The following chart reflects a simulated annual minimal return adding each of 52 weekly portfolios together using worst case weekly returns. This simulation could also be compounded weekly as each portfolio is distinct and selections do not repeat from the prior week. Historical MDA Breakout minimal buy/hold (worst case) returns have a compound average growth rate of 37.1% and cumulative minimum returns of +938.9% from 2017.
VMBreakouts.com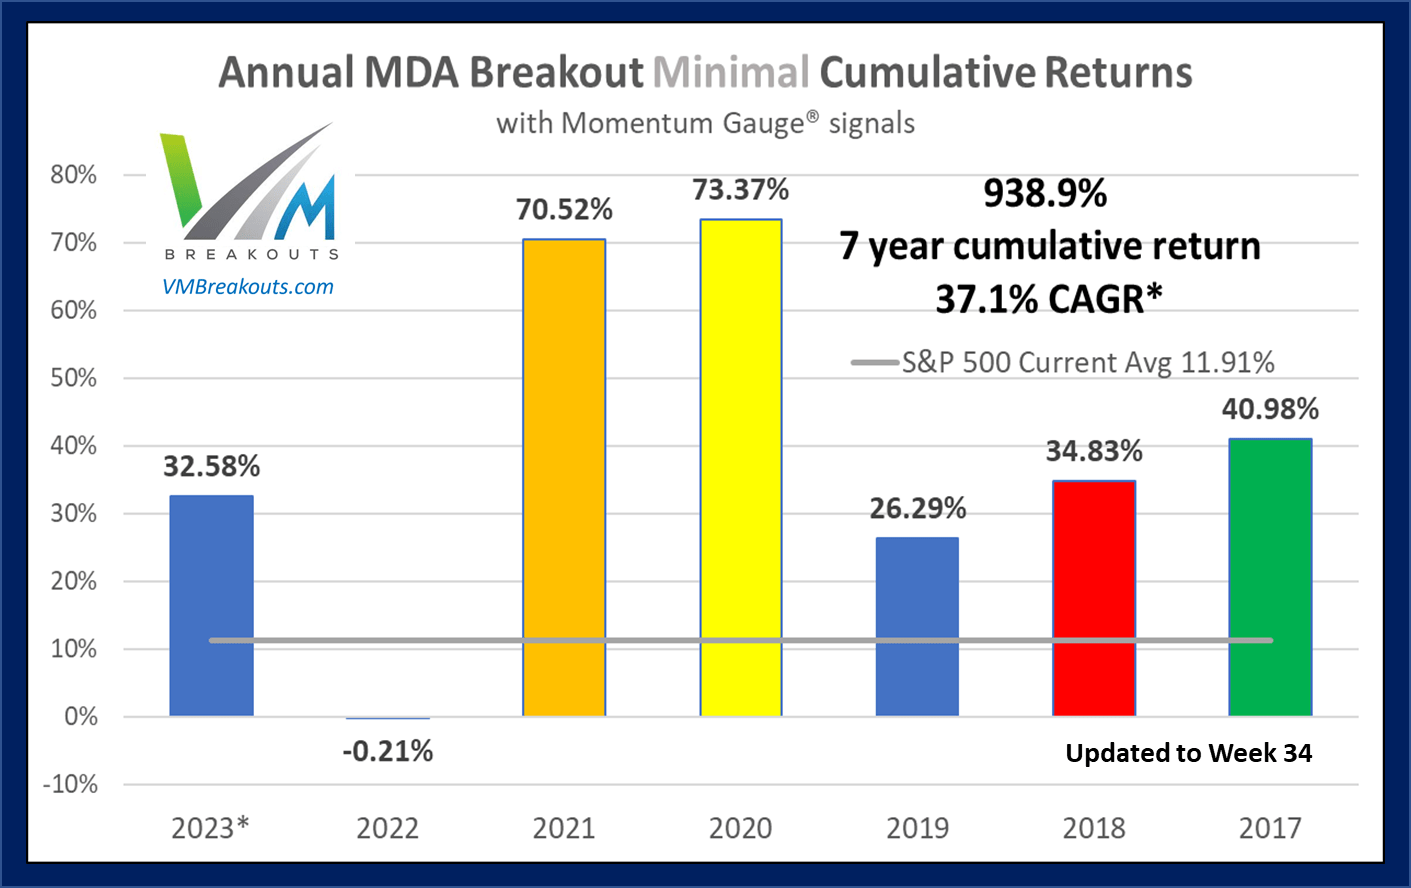
The minimal cumulative returns for 2022 were -0.21%, average cumulative returns were +67.05%, and the best case cumulative returns were +360.25% without compounding.
The Week 35 - 2023 Breakout Stocks for next week are:
These MDA selections are released in advance to our investing group every Friday with current gains shown. Prior selections may be doing well, but for research purposes only new selections are used each week. Documented best results occur when following the gauges.
MDA selections are restricted to stocks above $2/share, $100M market cap, and greater than 100k avg daily volume. Penny stocks well below these minimum levels have been shown to benefit greatly from the model but introduce much more risk and may be distorted by inflows from readers selecting the same micro-cap stocks.
bluebird bio, Inc.
FinViz.com
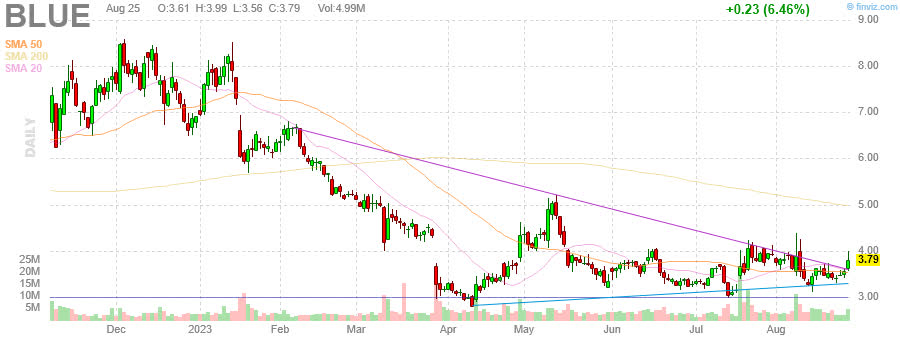
Price Target: $7.00/share (Analyst Consensus + Technical See my FAQ #20)
| Aug-24-23 10:15AM | 1 Beaten-Down Growth Stock You'd Regret Not Buying on the Dip, According to Wall Street Motley Fool |
| Aug-16-23 07:00AM | bluebird bio Confirms That FDA Has Communicated That Advisory Committee Meeting Will Not Be Scheduled for lovo-cel Gene Therapy for Sickle Cell Disease Business Wire |
| Aug-08-23 08:25AM | Bluebird Bio (bluebird bio, Inc. Stock Price Today, Quote & News) Reports Q2 Loss, Misses Revenue Estimates Zacks +8.06% |
| 07:18AM | Bluebird: Q2 Earnings Snapshot AP Finance |
| 07:00AM | bluebird bio Reports Second Quarter 2023 Financial Results and Highlights Operational Progress Business Wire |
| 07:00AM | 2 Magnificent Growth Stocks I'm Buying Hand Over Fist Right Now Motley Fool |
| Aug-05-23 09:40AM | 1 Beaten-Down Stock That Could Soar by 89%, According to Wall Street Motley Fool |
(Source: Company Resources)
bluebird bio, Inc., a biotechnology company, researches, develops, and commercializes gene therapies for severe genetic diseases. Its product candidates for severe genetic diseases include ZYNTEGLO (betibeglogene autotemcel) for the treatment of transfusion-dependent ß-thalassemia; lovotibeglogene autotemcel for the treatment of sickle cell disease; and SKYSONA (elivaldogene autotemcel) to treat cerebral adrenoleukodystrophy.
StockRover.com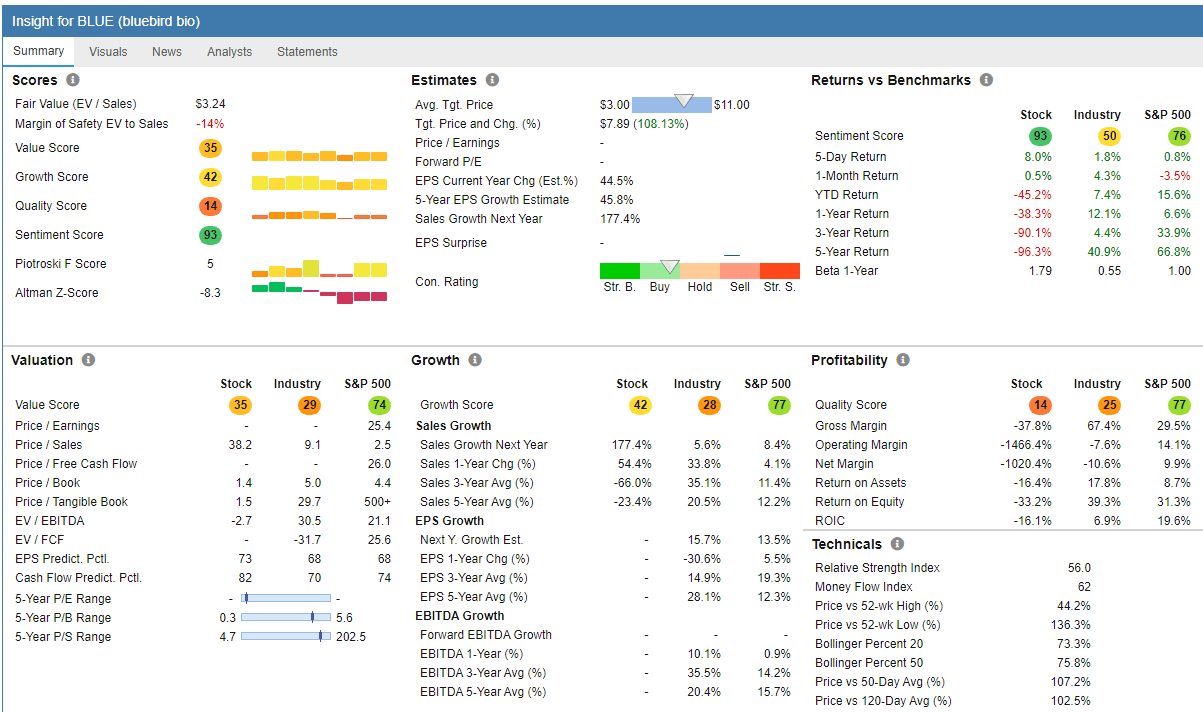
Erasca, Inc.
FinViz.com
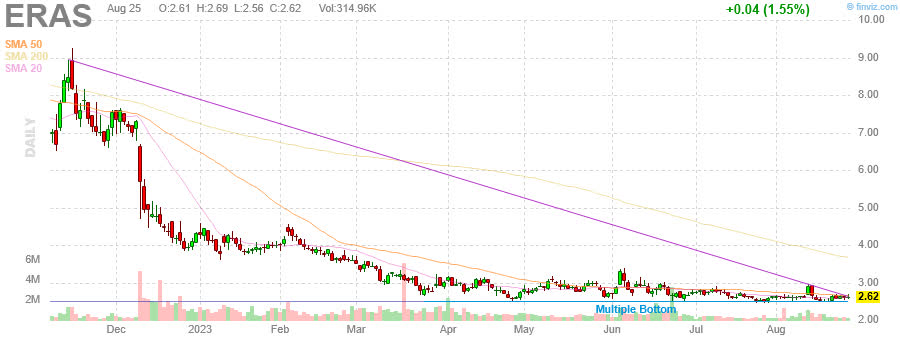
Price Target: $4.00/share (Analyst Consensus + Technical See my FAQ #20)
| Aug-10-23 04:01PM | Erasca Reports Second Quarter 2023 Financial Results and Business Updates GlobeNewswire |
| Jul-12-23 06:35AM | Here's Why We're Not Too Worried About Erasca's Cash Burn Situation Simply Wall St. |
| Jun-22-23 04:01PM | Erasca Granted FDA Orphan Drug Designation for CNS-Penetrant EGFR Inhibitor ERAS-801 for the Treatment of Malignant Glioma GlobeNewswire -7.96% |
| Jun-15-23 06:22AM | Jonathan Lim Spends US$275k On Erasca Stock Simply Wall St. |
| Jun-06-23 10:53AM | Erasca Puts Certain Pipeline Programs On Chopping Block To Focus On Programs With Encouraging Activity Signals Benzinga -8.18% |
| Jun-05-23 04:01PM | Erasca Provides Update on Clinical Program for ERK Inhibitor ERAS-007 and Refines Pipeline GlobeNewswire +14.19% |
(Source: Company Resources)
Erasca, Inc., a clinical-stage biopharmaceutical company, focuses on discovering, developing, and commercializing therapies for patients with RAS/MAPK pathway-driven cancers. The company's lead candidates include ERAS-007, an oral inhibitor of ERK1/2 for the treatment of non-small cell lung cancer, colorectal cancer, and acute myeloid leukemia; and ERAS-601, an oral SHP2 inhibitor for patients with advanced or metastatic solid tumors.
StockRover.com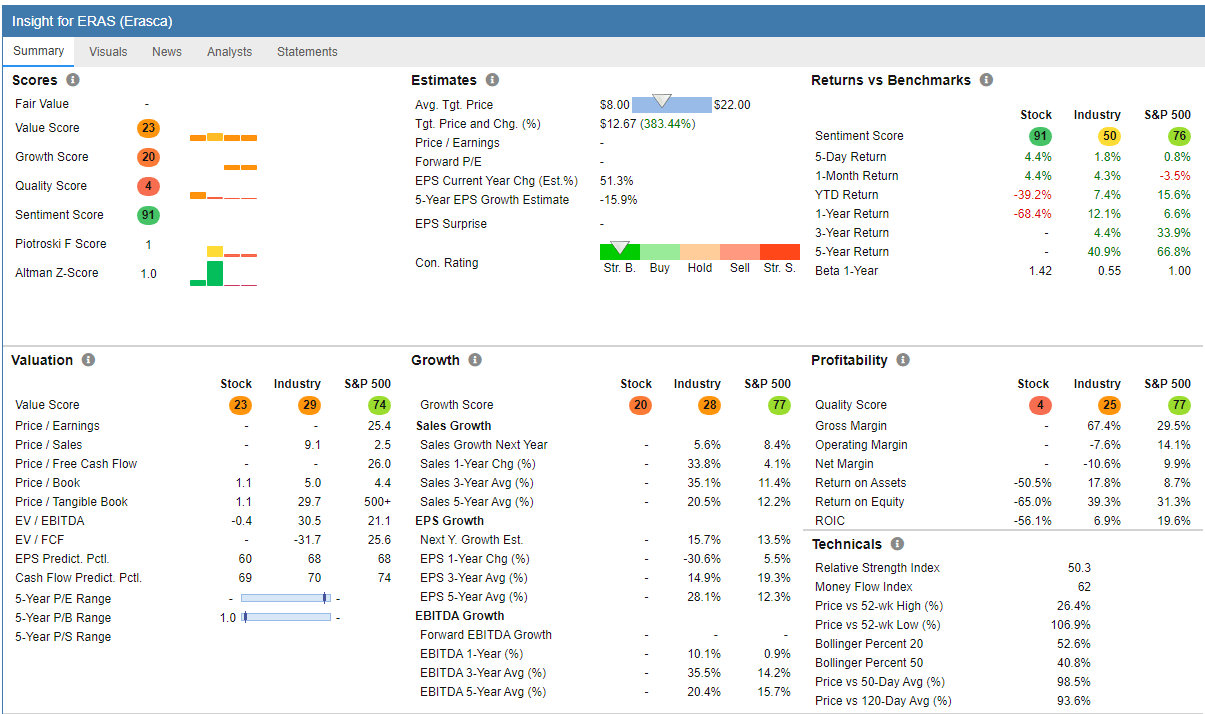
Top Dow 30 Stocks to Watch for Week 35
First, be sure to follow the Momentum Gauges signals for best results. Second, these selections are made without regard to market cap or the below-average volatility typical of mega-cap stocks that may produce good results relative to other Dow 30 stocks. Third, until the June 1st positive MG signal the Dow has been the worst performing major index with negative returns into May.
| Week Picked | Symbol | Company | Return % | Current Price |
| Week 34 | CSCO | Cisco Systems Inc | 1.35% | 55.7 |
| Week 34 | WMT | Walmart Inc | 0.29% | 157.82 |
| Week 33 | CVX | Chevron Corporation | -1.36% | 159.12 |
| Week 33 | CAT | Caterpillar Inc. | -4.07% | 272.56 |
| Week 32 | JNJ | Johnson & Johnson | -1.90% | 167.93 |
| Week 32 | MCD | McDonald's Corp | -2.56% | 284.58 |
| Week 31 | INTC | Intel Corporation | -7.43% | 33.25 |
| Week 31 | DOW | Dow Inc | -2.98% | 53.98 |
| Week 30 | CVX | Chevron Corporation | 0.57% | 159.12 |
| Week 30 | AMGN | Amgen, Inc. | 9.20% | 256.38 |
The Dow pick for next week is:
International Business Machines Corporation (IBM)
IBM offers a high 4.57% dividend with good valuations 14.4x forward earnings and 2.16x sales. Insiders are not selling and institutions are net buyers in the current quarter. Analyst consensus target is $143.75/share with the most recent ratings at $150/share target.
FinViz.com
If you are looking for a much broader selection of large cap breakout stocks, I recommend these long term portfolios. More details on the value stocks and ETF trading models go out in separate articles.
VMBreakouts.com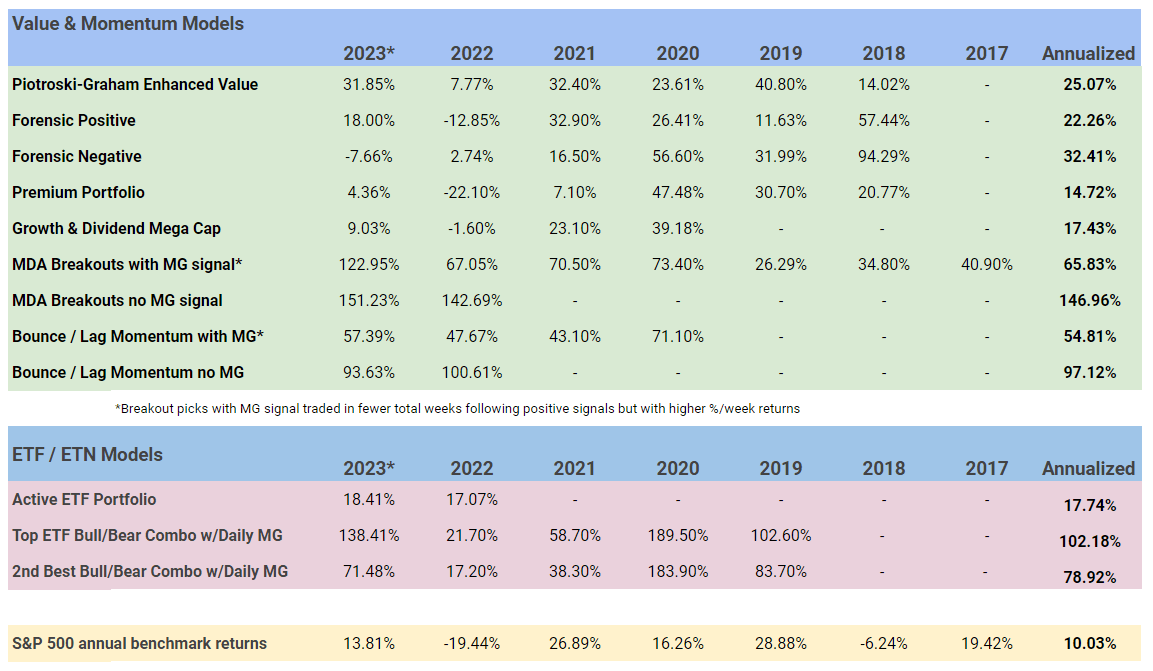
Conclusion
These stock selections continue the live forward-testing of the breakout selection algorithms from my doctoral research with continuous enhancements over prior years. Other portfolio models continue with strong gains and the ETF model changed to bear funds August 10th.
VMBreakouts.com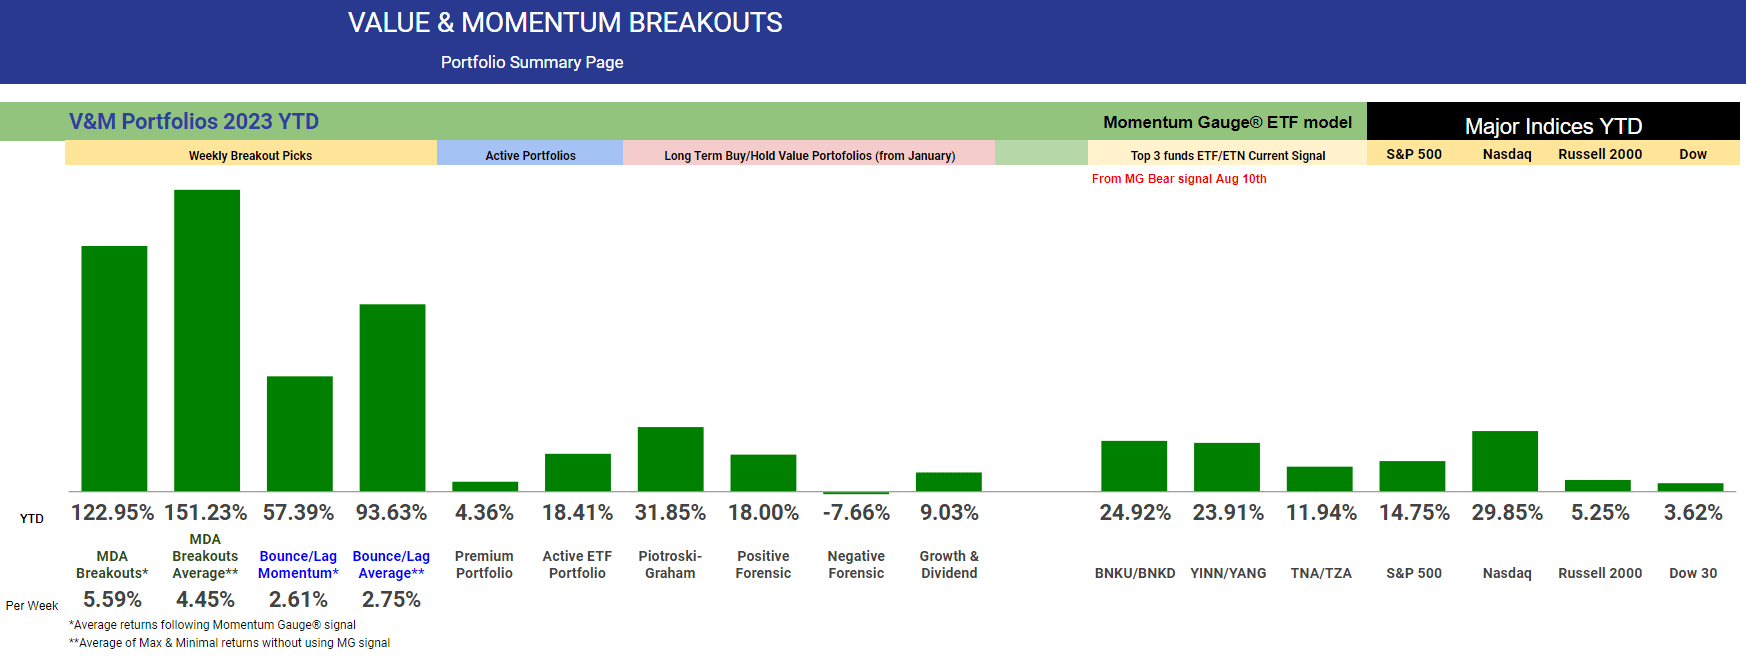
All the very best to you, stay safe and healthy and have a great week of trading!
JD Henning, PhD, MBA, CFE, CAMS
If you are looking for a great community to apply proven financial models with picks ranging from short term breakouts to long term value and forensic selections, please consider joining our 1,200+ outstanding members at Value & Momentum Breakouts
- Subscribe now and learn why members are hooked on the Momentum Gauge® signals!
- You can find any type of portfolio to fit your style with proven results.
- Be sure to read why we have so many positive member reviews!
- Now into our 7th year, we have outperformed the S&P 500 every single year!
See what members are saying now - Click HERE
This article was written by

Welcome! I am a Finance PhD, MBA, investment adviser, fraud examiner and certified anti-money laundering specialist with more than 30 years trading and investing stocks and other securities. I'm the founder of Value & Momentum Breakouts.
***
I'm JD Henning, the founder of Value & Momentum Breakouts. I've spent decades capturing many of the best ways to consistently beat the markets. I've earned degrees researching markets, and even more importantly, I've spent the time myself as a trader and investor. I am one of those unusual multi-millionaire, PhD's in finance, former Coast Guard officer with a bunch of certifications ranging from anti-money laundering specialist, investment adviser, to fraud examiner... who genuinely enjoys helping others do well in the markets. I'm bringing the fruits of my experience and research to this service. I am highly accessible to members to answer questions and give guidance.
***
It's been quite the start of the year for investors. My guess is, after a decade of good times in the market, you’re here looking for some guidance in how to navigate these volatile markets and the uncertainty of the coronavirus and inflationary conditions. You’re in the right place. For the past 7 years I’ve made my trading systems public and helped thousands of my subscribers navigate and profit from every market downturn and breakout. Please be sure to read the reviews of my service from actual members!
***
Value & Momentum Breakouts doesn't stop with the Momentum Gauges® and the Bull/Bear ETF strategy. The service is designed for investors who appreciate having easy access to quick picks from many top quantitative financial models across different types of investing strategies. Portfolios and selections cover all types of investments:
***
Commodity and Volatility fund trading
Cryptocurrency chart analysis
Long term high-dividend growth stocks
Short term high-frequency breakout stocks
Forensic analysis value stocks
Value enhanced long term growth picks
ETF sector and bull/bear combination trades
Dow mega cap breakout picks
Sector and Index Momentum Gauges® for market timing
***
I share my expertise by generating frequent Value & Momentum Breakout stock portfolios from the different financial algorithms across peer-reviewed financial literature.
***
Try a 2-Week FREE trial and see all the value for yourself.
Analyst’s Disclosure: I/we have no stock, option or similar derivative position in any of the companies mentioned, and no plans to initiate any such positions within the next 72 hours. I wrote this article myself, and it expresses my own opinions. I am not receiving compensation for it (other than from Seeking Alpha). I have no business relationship with any company whose stock is mentioned in this article.
These returns have consistently outperformed the benchmark indices for the past 7 years since live forward testing began. Documented research shows that the best results most often occur when the Momentum Gauges are positive indicating stronger net inflows and more positive investor sentiment.
Seeking Alpha's Disclosure: Past performance is no guarantee of future results. No recommendation or advice is being given as to whether any investment is suitable for a particular investor. Any views or opinions expressed above may not reflect those of Seeking Alpha as a whole. Seeking Alpha is not a licensed securities dealer, broker or US investment adviser or investment bank. Our analysts are third party authors that include both professional investors and individual investors who may not be licensed or certified by any institute or regulatory body.