QDF: Attractive Value And Quality, Average Performance

Summary
- FlexShares Quality Dividend Index Fund ETF holds 146 dividend stocks selected with a proprietary quality score.
- Its sector breakdown is close to the S&P 500, but valuation and quality metrics are much better.
- QDF has beaten a number of dividend ETFs in the last 12 months, but performance since inception is underwhelming.
- Quantitative Risk & Value members get exclusive access to our real-world portfolio. See all our investments here »
deepblue4you
QDF strategy and portfolio
FlexShares Quality Dividend Index Fund ETF (NYSEARCA:QDF) started investing operations on 12/14/2012 and tracks the Northern Trust Quality Dividend Index. It has 150 holdings, a distribution yield of 2.74% and an expense ratio of 0.37%. Distributions are paid quarterly.
As described in the prospectus by FlexShares, eligible stocks must be in the Northern Trust 1250 Index, pay a dividend and not be in the lowest quintile regarding a proprietary quality score. Then,…
The Index Provider then uses an optimization process to select and weight eligible securities in order to (A) maximize the overall quality score relative to the Parent Index; (B) attain an aggregate dividend yield in excess of the Parent Index; and (C) achieve the desired beta target.
The turnover rate in the most recent fiscal year was 40%. The fund is exclusively invested in US companies, mostly in the large capitalization segment (about 68% of asset value). The sector breakdown is close to the large cap benchmark S&P 500 (SP500), as reported in the next chart. Technology is the heaviest sector with 29.4% of asset value. Compared to SPY, QDF significantly overweights industrials, real estate and materials. It underweights mostly communication services.
Sector breakdown (chart: author; data: FlexShares, SSGA)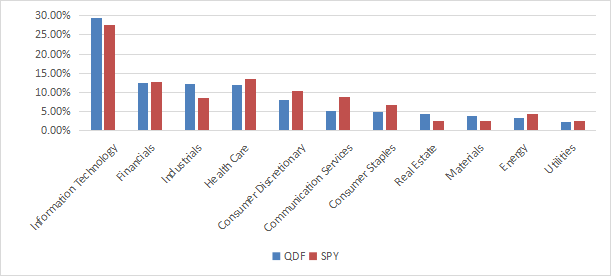
The top 10 holdings, listed in the next table with weights and fundamental ratios, have an aggregate weight of 34.7%. The portfolio is concentrated, with quite a high exposure to the two heaviest constituents: Apple and Microsoft. Risks related to other individual companies are moderate.
Ticker | Name | Weight | EPS growth % ttm | P/E ttm | P/E fwd | Yield% |
Apple Inc. | 9.11% | -1.68 | 30.02 | 29.50 | 0.54 | |
Microsoft Corp. | 5.58% | 0.42 | 33.35 | 29.40 | 0.84 | |
Broadcom Inc. | 3.81% | 56.85 | 26.92 | 20.26 | 2.16 | |
Procter & Gamble Co. | 3.15% | 1.65 | 26.03 | 23.98 | 2.45 | |
Cisco Systems, Inc. | 2.70% | 9.02 | 18.12 | 13.71 | 2.80 | |
Comcast Corp. | 2.38% | -48.53 | 28.84 | 12.01 | 2.55 | |
Accenture plc | 2.17% | 8.87 | 28.40 | 27.46 | 1.41 | |
AbbVie Inc. | 2.14% | -31.10 | 30.13 | 13.28 | 4.04 | |
NVIDIA Corp. | 1.96% | 35.88 | 111.06 | 43.43 | 0.03 | |
The Home Depot, Inc. | 1.74% | -1.61 | 20.16 | 21.25 | 2.59 |
Ratios from Portfolio123.
QDF is much cheaper than the S&P 500 regarding valuation ratios, except price-to-book, as reported in the next table.
QDF | SPY | |
Price/Earnings TTM | 16.84 | 23.32 |
Price/Book | 4 | 4.1 |
Price/Sales | 2.04 | 2.62 |
Price/Cash Flow | 12.12 | 16.37 |
Source: Fidelity.
Performance
QDF has underperformed SPY by about 2 percentage points in annualized return since 1/1/2013. Risk measured in drawdown and standard deviation of monthly returns (“volatility” in the next table) is similar to the broad index. However, QDF beats a dividend benchmark, the SPDR S&P Dividend ETF (SDY).
Total Return | Annual.Return | Drawdown | Sharpe ratio | Volatility | |
QDF | 200.23% | 10.87% | -36.67% | 0.71 | 14.90% |
SPY | 265.43% | 12.94% | -33.72% | 0.86 | 14.68% |
SDY | 167.28% | 9.67% | -36.70% | 0.67 | 14.17% |
Data calculated with Portfolio123.
The next chart compares 10-year total returns of QDF, SPY, SDY and four other U.S. large cap dividend funds:
- Schwab U.S. Dividend Equity ETF (SCHD)
- iShares Select Dividend ETF (DVY)
- First Trust Value Line Dividend Index Fund (FVD)
- First Trust Morningstar Dividend Leaders Index Fund (FDL).
QDF is closer to the bottom of the pack. All the dividend funds of this list have been lagging SPY, and SCHD is the best one among them.
QDF vs SPY and competitors, 10-year return (Seeking Alpha)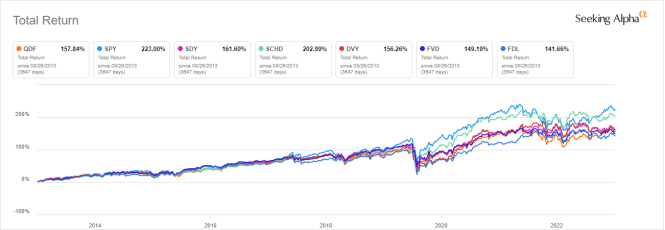
However, in the last 12 months QDF is almost on par with the S&P 500, and significantly ahead of its competitors.
QDF vs SPY and competitors, 12-month return (Seeking Alpha)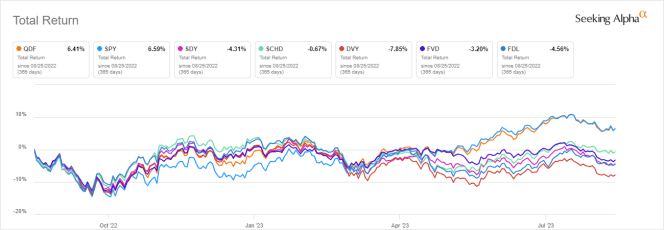
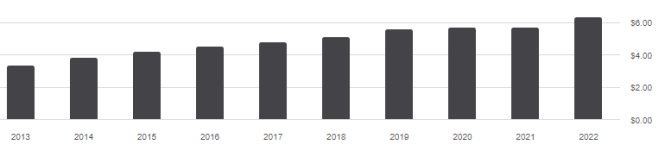
The annual sum of distributions has increased from $0.69 per share in 2013 to $1.29 in 2022. It is an 87% growth in 9 years, beating by far the cumulative inflation: about 27%, based on CPI. Nonetheless, it is shortly behind the large cap benchmark SPY (88.7%). Moreover, the distribution trend has been uneven. In fact, QDF dividends have been decreasing since 2018, with a timid bounce in 2022. SPY distribution trend looks much better (see next charts).
QDF distribution history (Seeking Alpha) SPY distribution history (Seeking Alpha)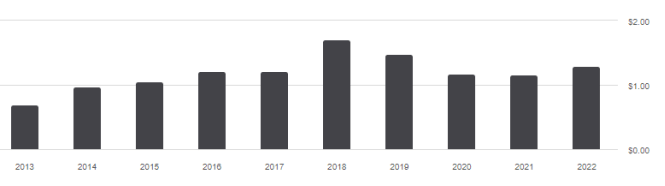
In previous articles, I have shown how three factors may help cut the risk in a dividend portfolio: Return on Assets, Piotroski F-score, and Altman Z-score.
The next table compares QDF since 1/1/2013 with a subset of the S&P 500: stocks with an above-average dividend yield, an above-average ROA, a good Altman Z-score, a good Piotroski F-score and a sustainable payout ratio. The subset is rebalanced annually to make it comparable to a passive index.
Total Return | Annual.Return | Drawdown | Sharpe ratio | Volatility | |
QDF | 200.23% | 10.87% | -36.67% | 0.71 | 14.90% |
Dividend quality subset | 289.85% | 13.62% | -34.96% | 0.88 | 15.03% |
Past performance is not a guarantee of future returns. Data Source: Portfolio123.
QDF lags the dividend quality subset by 2.7 percentage points in annualized return. A note of caution: ETF performance is real and this subset is simulated. My core portfolio holds 14 stocks selected in this subset (more info at the end of this post).
Scanning quality
QDF holds 146 stocks, of which 8 are risky regarding my metrics. These are stocks with at least two red flags among: bad Piotroski score, negative ROA, unsustainable payout ratio, bad or dubious Altman Z-score, excluding financials and real estate, where these metrics are unreliable. Risky stocks weigh 3.4% of asset value, which is an excellent point.
According to my calculations reported in the next table, aggregate quality metrics are higher than for the S&P500. They point to a portfolio quality significantly superior to the benchmark. In particular, the return on assets is very good.
QDF | SPY | |
Atman Z-score | 5.52 | 3.51 |
Piotroski F-score | 6.14 | 5.68 |
ROA % TTM | 12.35 | 7.1 |
Takeaway
FlexShares Quality Dividend Index Fund ETF has a portfolio of 146 dividend stocks selected with a proprietary quality score. Its sector breakdown is close to the S&P 500, but valuation and quality metrics are much better. QDF has outperformed a number of dividend ETFs in the last 12 months, but historical performance measured in return and dividend growth is underwhelming.
Quantitative Risk & Value (QRV) features data-driven strategies in stocks and closed-end funds outperforming their benchmarks since inception. Get started with a two-week free trial now.

This article was written by

Step up your investing experience: try Quantitative Risk & Value for free now (limited offer).
I am an individual investor and an IT professional, not a finance professional. My writings are data analysis and opinions, not investment advice. They may contain inaccurate information, despite all the effort I put in them. Readers are responsible for all consequences of using information included in my work, and are encouraged to do their own research from various sources.
Analyst’s Disclosure: I/we have a beneficial long position in the shares of CSCO either through stock ownership, options, or other derivatives. I wrote this article myself, and it expresses my own opinions. I am not receiving compensation for it (other than from Seeking Alpha). I have no business relationship with any company whose stock is mentioned in this article.
Seeking Alpha's Disclosure: Past performance is no guarantee of future results. No recommendation or advice is being given as to whether any investment is suitable for a particular investor. Any views or opinions expressed above may not reflect those of Seeking Alpha as a whole. Seeking Alpha is not a licensed securities dealer, broker or US investment adviser or investment bank. Our analysts are third party authors that include both professional investors and individual investors who may not be licensed or certified by any institute or regulatory body.