R1 RCM: Attractively Priced, Capital Produces $0.90/Share In Earnings, Reiterate Buy

Summary
- R1 RCM Inc. continues to offer long-term value for investors, with ongoing gains in contract balances and revenues.
- Recent acquisitions are starting to contribute to profitability, supporting the company's differentiated assets in revenue cycle management.
- The company's Q2 FY'23 numbers show strong growth in revenue and earnings, with revised guidance indicating further growth in the future.
- Net-net, reiterate buy.
naphtalina/iStock via Getty Images
Investment Briefing
The equity stock of R1 RCM Inc. (NASDAQ:RCM) continues to offer long-term value for investors in my informed opinion. The company's key growth statistics continue shifting higher, evidenced by ongoing gains in contract balances and revenues tied to the same. Recent acquisitions have also begun to pull through to profitability as well.
Following the June RCM publication, the company's Q2 FY'23 numbers support these suppositions, along with the earnings growth obtained from its capital base. Around $1.9Bn in capital produces $377mm in trailing earnings, evidence of the company's differentiated assets that help healthcare providers improve operating margins and free up cash flow. This is known as revenue cycle management ("RcM"), and involves components of labour, software, and service providers. For a deep dive into RcM and the underlying market, see the previous 3 RCM publications from this channel (newest to oldest):
- Value Proposition Is Only More Attractive Now (Buy)
- Cloudmed Already Paying Dividends, Look For Double-Digit Growth In FY23 (Buy)
- Reversal Rally Well Supported In The Data (Buy)
Net-net, RCM continues to present as a buy, with attractive economics, exceptional earnings power, profitable core assets, and valuation upside. Reiterate buy.
Figure 1.
Data: Updata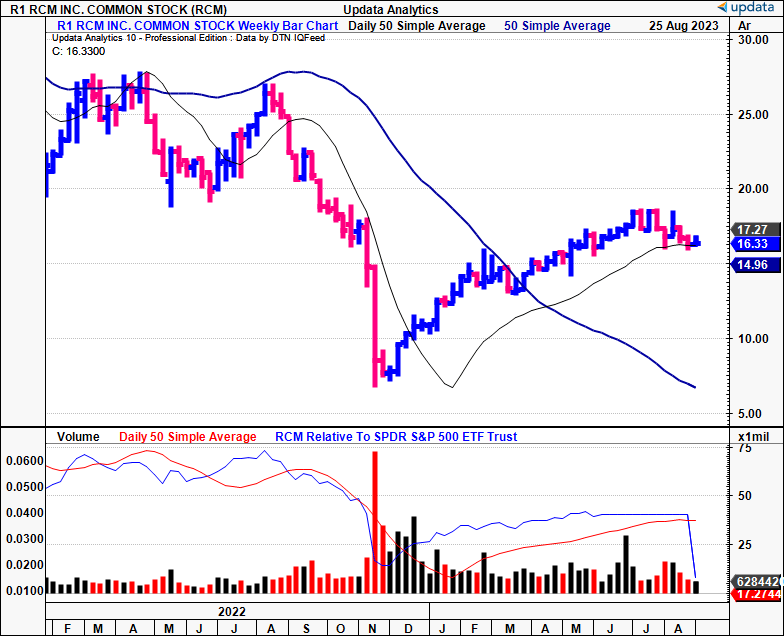
Critical updates to investment debate—Q2 numbers, economic profits, valuation
1. Q2 FY'23 insights
- Revenue and cost disaggregation
RCM booked Q2 revenues of $560.7mm, up 42% YoY, on adj. EBITDA of $142.9mm, growth of 64% YoY. Both numbers were ahead of internal projections. Critically, growth was underscored by the $11.6mm increase in reserves to address credit losses tied to one of its physician customers. The reserve was initiated in Q3 last year on about $10mm.
In July of this year, the customer announced plans to cease operations by the end of the month. Consequently, RCM elevated its reserves to ensure complete coverage for all the outstanding dues tied to this account. It should be noted that RCM has more than enough reserves to cover outstanding balances in the receivables account, thereby mitigating any further exposure to this customer's account.
Impacts from the reorganized set of accounts is as follows:
- Around $15mm headwind to FY'23 revenues. This annualized to ~$30mm, aligning with turnover booked from the customer.
- The account yielded profit margins in the low 30% range, yet won't be overly noticed. Further, the revenue reduction will be realized in H2 of this year only.
Back to the sales clip, the 42% YoY growth was underlined by contributions from the Cloudmed acquisition, up 20%. As a reminder, it was completed in Q2 FY'22. Management expects 20% growth YoY in Cloudmed by yearend as well. Stripping the Cloudmed attributions from the top-line, revenue growth stands was 13% YoY—hence I'd estimate the revenue accretion to be 29 percentage points, thus a successful move so far in my view. Revenue gains were also influenced by new end-to-end ("E2E") customer acquisitions obtained across FY'22, with the pull-through on these booked in H1 FY'23. Modular sales stood out with a $172.1mm print for the quarter.
Net operating fees were up ~12% YoY and pulled in to $39.5mm. Not unexpected given the new business wins and integration of recent acquisitions in my opinion. Regarding cost management—critical in RCM's services—cost of services were up ~$85mm YoY to $364.5mm. Again, you can tie the increase back to Cloudmed and its corresponding customer acquisition costs. These will likely recur over the next year or so in my view, but should level out into FY'24/'25 with synergies realized throughout the P&L on full integration.
- Cash flows, capital spending and guidance
Q2 allocations to CapEx were $25mm ($100mm annualized) and it also diverted c.$12mm towards its debt principle. This brought the debt balance to $1.65Bn by the quarter's end, with net leverage to ~2.8x trailing adj. EBITDA. It brought in $57.5mm in operating cash flow, its highest quarterly OCF in the last 18 months. The firm's OCF is most sensitive to changes in accounts receivable, but I'd expect persistent negative changes to AR as the firm books higher revenues forward amid its current growth schedule, that is increasing at pace.
Figure 2 outlines the company's growth in contract balances and corresponding revenues on an annualized basis from 2017 to the TTM. FY'23 estimates are also shown. Baking in the FY'23 projections, the firm will have compounded new contract balances at 34.5% geometrically each year since 2017, with revenues growing at a similar clip of ~31%. By all measures discussed today, these trends can certainly continue for the years to come.
Figure 2.
BIG Insights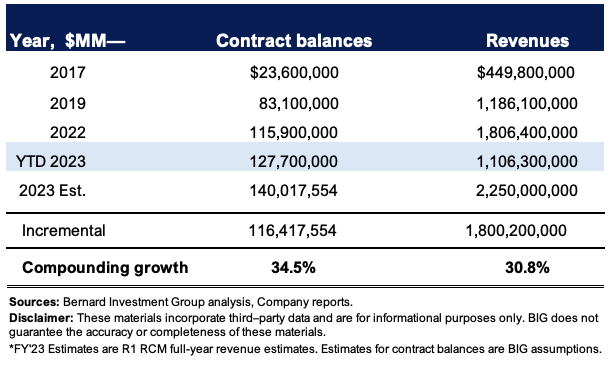
In fact, RCM revised up guidance on the call. The recalibrated guidance now calls for revenue of $2.25Bn—$2.275Bn, 24.5% YoY growth at the top. It looked to adj. EBITDA of $600mm to $615mm on this. This revised projection takes into account 3 critical factors:
- (Regarding the physician customer's operations) the phased decline in the is projected to impact revenue by ~$15mm or ~70bps in H2.
- The timing of new E2E business acquisitions is expected to impact H2 sales by around $25mm. Revenue from this new business will be recognised in FY'24.
- Related to point (2) above, the timing of various employee and vendor transactions tied to the new customer wins is likely to impact adj. EBITDA in 2023. This could be a good thing because they'll be dealt with this year, and thus more income will fall to the bottom line in FY'24 as a result.
Net-net, another strong quarter from RCM, with minor headwinds dealt with swiftly, and management's transparency on all the matters is greatly appreciated in my view.
2. Economic growth levers adding value for shareholders
RCM's core assets are differentiated and produce high earnings every rolling 12 months on each pass. These primarily include its RcM offerings, additional software and licensing.
Figure 3 reconciles the capital RCM's deployed into the business to the earnings ("earnings") produced on this from 2015 to the last 12 months. Accounting goodwill is excluded from the calculus. $1.92Bn in capital at risk produces $377mm, an attractive 19% trailing return on investment. This is down from recent years, but critically, the absolute numbers are much, much higher. Earnings have grown from $305mm in 2016 to $377m in the TTM, although they've been volatile. It is the last 4 years that I'm most interested in, and they've grown from $94mm to $377mm. As such, the firm invested an additional $1.58Bn into the business, producing an additional $283mm in earnings, an 18% return on incremental capital investment.
Figure 3. Note: Various software assets are separated into "PP&E" and "Intangibles" on each period, not shown individually.
BIG Insights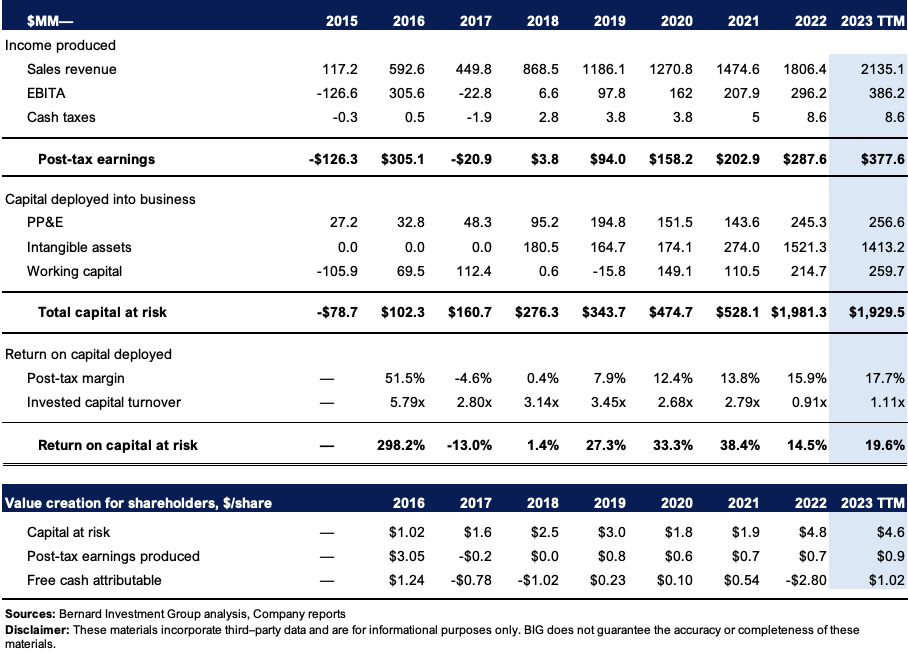
The economics on this capital allocation framework has created tremendously attractive shareholder value in my opinion. In per-share terms, the firm has $4.60/share in capital deployed, producing $0.90 in earnings. That's ~$0.20 for every $1 invested, as mentioned earlier. This is up from $0.60/share in earnings in 2020 [Figure 4]. Hence, the recent acquisitions—net of goodwill—have been accretive to shareholder value.
Critically—and perhaps, interestingly—the company's profitability is driven by capital efficiency and invested capital turnover. This suggests it has production advantages and can price its offerings below industry averages. It makes sense, given the firm's differentiated assets (software, generating subscription revenue, and licensing) produce the profits. It is also a relatively light asset model, with minimal reinvestment into additional maintenance/growth capital, or working capital. Impressively, the post-tax margin has crept up from 13.8% in 2021 and now registers 17.7% in the TTM. Should it ratchet higher, I'd be calling for RCM to produce $400–$410mm post-tax (18% margin) and for this to result in earnings of $0.975/share.
Figure 4.
BIG Insights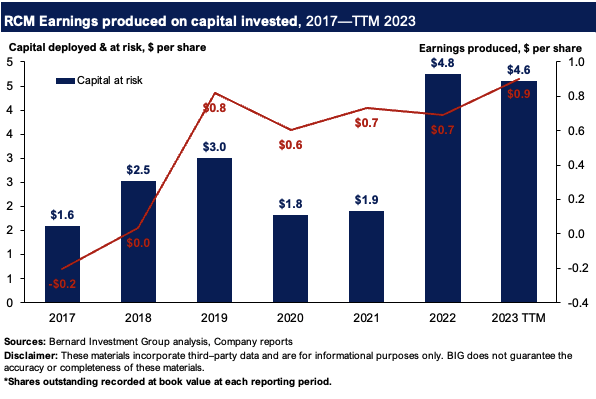
3. Valuation
The stock sells at 14x forward EBITDA, which, based on the expectations, gets you to a $6.84Bn market cap as I write. The market expects it to print ~$488mm in adj. EBITDA at this multiple (6,840/14 = $488.6). At a maintenance CapEx (roughly in line with depreciation) of $63mm this gets you to $425mm pre-tax, allow ~$5–$10mm in cash taxes and you get to my estimates of ~$400–$410mm in earnings post-tax outlined earlier. This creates a dilemma. The similarity in my own expectations to the market's that is. Is there reason to foresee RCM to sell higher if the expectations are already priced in?
By the calculus, for it to do another 19% in ROIC you'd need it to have ~$2.15–$2.2Bn in capital deployed at this rate of return ($2,150x0.19 = $408.5mm). Presuming it can in fact do this, the $2.15Bn would be an investment of $221mm, 54% reinvestment of earnings, to produce an additional $31mm in earnings, hence a 14% return on new capital.
A firm can compound its intrinsic value at the function of its ROIC and the amount it reinvests at these rates. It sells at $6.84Bn market value as I write, and thus you'd get to intrinsic value compounding at a growth rate of 10.3% by yearend applying this calculus at the 19% ROIC discussed earlier. This equates to $7.5Bn by H2 FY'23, or $18/share.
The 19% ROIC and 14% incremental returns are also above the long-term market return on capital of ~12%. This implies the company will create shareholder value above the opportunity cost of capital. Hence, this supports a buy rating in my view, implying RCM is undervalued at the time of writing.
Supporting this view, you can see the conversion to economic earnings, those produced above the cost of capital (12% here) versus the reported earnings each period. It captures the earnings produced from RCM's invested capital, and measures those produced above the cost of capital, in dollar terms. The economic numbers are notably higher, and in multiples higher too. This is critical evidence that backs the supposition RCM is well primed to deliver ongoing value for its shareholders over the long-term.
Figure 5.
BIG Insights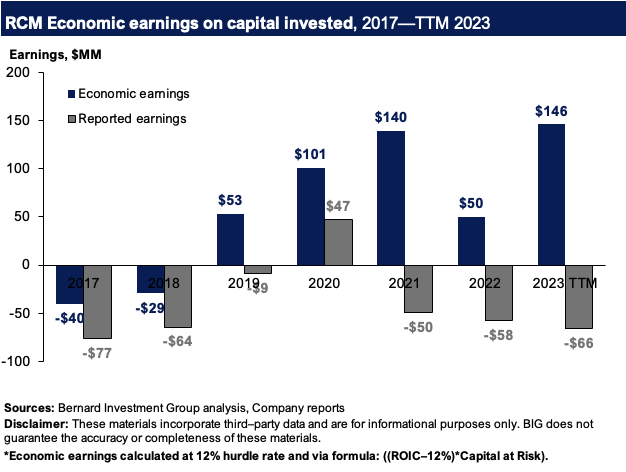
Conclusion
RCM continues to illustrate its growth economics as we roll through each quarter of 2023. Critically, its core business metrics are ratcheting higher, evidenced by the continued growth in contract balances and top-line growth. Even more critical to the buy thesis is how it is recycling surplus capital into creating new business growth and thus, shareholder value over the long term. The $1.9Bn in capital put at risk in the business produces 19% return on investment, above the required rate of return of ~12%. Together, these points corroborate a buy rating in my opinion. Net-net, reiterate buy.
This article was written by

Analyst’s Disclosure: I/we have a beneficial long position in the shares of RCM either through stock ownership, options, or other derivatives. I wrote this article myself, and it expresses my own opinions. I am not receiving compensation for it (other than from Seeking Alpha). I have no business relationship with any company whose stock is mentioned in this article.
Seeking Alpha's Disclosure: Past performance is no guarantee of future results. No recommendation or advice is being given as to whether any investment is suitable for a particular investor. Any views or opinions expressed above may not reflect those of Seeking Alpha as a whole. Seeking Alpha is not a licensed securities dealer, broker or US investment adviser or investment bank. Our analysts are third party authors that include both professional investors and individual investors who may not be licensed or certified by any institute or regulatory body.