Semtech: Acquisition Of Sierra Too Expensive

Summary
- Semtech Corporation's revenue is projected to increase by 106% to $1.56 billion in 2023 due to the acquisition of Sierra Wireless.
- The integration of products and technologies between Semtech and Sierra Wireless could create additional opportunities for revenue synergies.
- Our financial analysis suggests that the acquisition may not be financially favorable for SMTC unless higher cost or revenue synergies are achieved.
EuToch
In this assessment of Semtech Corporation (NASDAQ:SMTC), we delve into the company's post-acquisition state after it merged with Sierra Wireless in January 2022 for a sum of $1.2 bln. Our analysis comprises several key aspects. Firstly, we meticulously broke down the revenue structure of both individual entities and provided a comprehensive overview of their respective segments. This allowed us to lay the groundwork for estimating the additional revenue influx resulting from the integration of Sierra Wireless into Semtech's operations for the 2023 fiscal year.
Furthermore, we examined the integration of products within the company after the acquisition. We aimed to ascertain whether this integration could yield meaningful synergies that would propel the company's growth and operational efficiency. A crucial part of our analysis involved an in-depth evaluation of the combined company's profitability. Through this, we projected the amalgamated entity's profit margins, taking into account the impact of the acquisition. This provided insights into the financial implications of the merger.
Lastly, we conducted a rigorous assessment to determine the viability of the deal for Semtech. By applying a discount rate to factor in synergies, we calculated the net present value in relation to the acquisition expenditure. This enabled us to make an informed judgment on whether the acquisition was a prudent move for Semtech in terms of its financial prospects.
Acquisition Boosts Revenue Growth
Semtech Segment Breakdown ($ 000's) (FY) | 2020 | 2021 | 2022 | 2023 | 2024F | 2025F | 2026F | 2027F | 2028F |
Signal Integrity Products Group | 222,846 | 255,640 | 291,114 | 304,124 | 314,610 | 325,457 | 336,678 | 348,286 | 360,294 |
Growth % | -19% | 15% | 14% | 4% | 3% | 3% | 3% | 3% | 3% |
Advanced Protection and Sensing Products Group | 157,212 | 243,085 | 306,932 | 236,890 | 263,194 | 292,419 | 324,889 | 360,964 | 401,045 |
Growth % | -14% | 55% | 26% | -23% | 11% | 11% | 11% | 11% | 11% |
IoT System Products Group | 167,454 | 96,392 | 142,812 | 210,326 | 231,809 | 255,487 | 281,583 | 310,344 | 342,043 |
Growth % | -12% | -42% | 48% | 47% | 10% | 10% | 10% | 10% | 10% |
IoT Connected Services Group | 0 | 0 | 0 | 5,193 | 5,505 | 5,835 | 6,185 | 6,556 | 6,949 |
Growth % | 6% | 6% | 6% | 6% | 6% | ||||
Total Semtech | 547,512 | 595,117 | 740,858 | 756,533 | 815,117 | 879,197 | 949,334 | 1,026,150 | 1,110,332 |
Growth % | -13% | 9% | 24% | 2% | 8% | 8% | 8% | 8% | 8% |
Source: Company Data, Khaveen Investments
Sierra Segment Breakdown ($' 000s) | 2019 | 2020 | 2021 | 2022 | 2023F | 2024F | 2025F | 2026F | 2027F |
IoT services | 377,808 | 306,917 | 323,075 | 524,897 | 590,516 | 664,339 | 747,390 | 840,823 | 945,937 |
Growth % | 1% | -19% | 5% | 62% | 13% | 13% | 13% | 13% | 13% |
Embedded Broadband | 335,705 | 141,671 | 150,134 | 177,721 | 153,970 | 133,394 | 115,567 | 100,122 | 86,742 |
Growth % | -20% | -58% | 6% | 18% | -13% | -13% | -13% | -13% | -13% |
Total Sierra Wireless | 713,513 | 448,588 | 473,209 | 702,619 | 744,487 | 797,732 | 862,956 | 940,945 | 1,032,679 |
Growth % | -10% | -37% | 5% | 48% | 6% | 7% | 8% | 9% | 10% |
Source: Company Data, Khaveen Investments
Based on the table above, Semtech's revenue grew at an average of 6% in the past 4 years. The company has 4 segments. Its Advanced Protection and Sensing Products Group (31% of revenue) which includes "high-performance protection devices" grew at the highest average of 11% followed by the IoT System Products Group (28% of revenue) which "specialized radio frequency products" including LoRa devices grew at an average of 10% as growth accelerated in 2022. We forecasted Semtech's revenues based on its past 4-year average revenue growth for each segment and derived a 5-year forward average of 8% for the total Semtech revenue without Sierra Wireless.
Whereas for Sierra Wireless, we prorated its Q1 to Q3 2022 results to derive the full-year revenues. The company's 4-year average revenue growth was lower at 2% and its segments consist of IoT services segment which based on its annual report includes "recurring connectivity services, cellular modules and gateways, and a cloud platform" with an average growth of 13% as well as its Embedded Broadband segment which includes "high-speed cellular embedded modules" and has an average growth of -13%. Similarly, with Semtech, we forecasted the company's revenues based on its past 4-year average revenue growth for each segment, which translates to a 5-year forward average of 8%.
Revenue of Combined Company ($ mln) ('CY') | 2022 | 2023F | 2024F | 2025F | 2026F | 2027F |
Semtech | 757 | 815 | 879 | 949 | 1,026 | 1,110 |
Growth % | 2.1% | 7.7% | 7.9% | 8.0% | 8.1% | 8.2% |
Sierra Wireless | 744 | 798 | 863 | 941 | 1,033 | |
Growth % | 6.0% | 7.2% | 8.2% | 9.0% | 9.7% | |
Total Combined Company Revenue | 757 | 1,560 | 1,677 | 1,812 | 1,967 | 2,143 |
Growth % | 2.1% | 106.2% | 7.5% | 8.1% | 8.5% | 8.9% |
Source: Company Data, Khaveen Investments
In the table above, we compiled our forecasted revenues for Semtech and Sierra Wireless as a combined company. We calculated its revenue growth of 106.2% to $1.56 bln compared to $757 mln from the previous year due to the revenue contribution from Sierra Wireless. This would represent Sierra Wireless representing 48% of revenue for the combined company in 2023.
Counterpoint Research, Khaveen Investments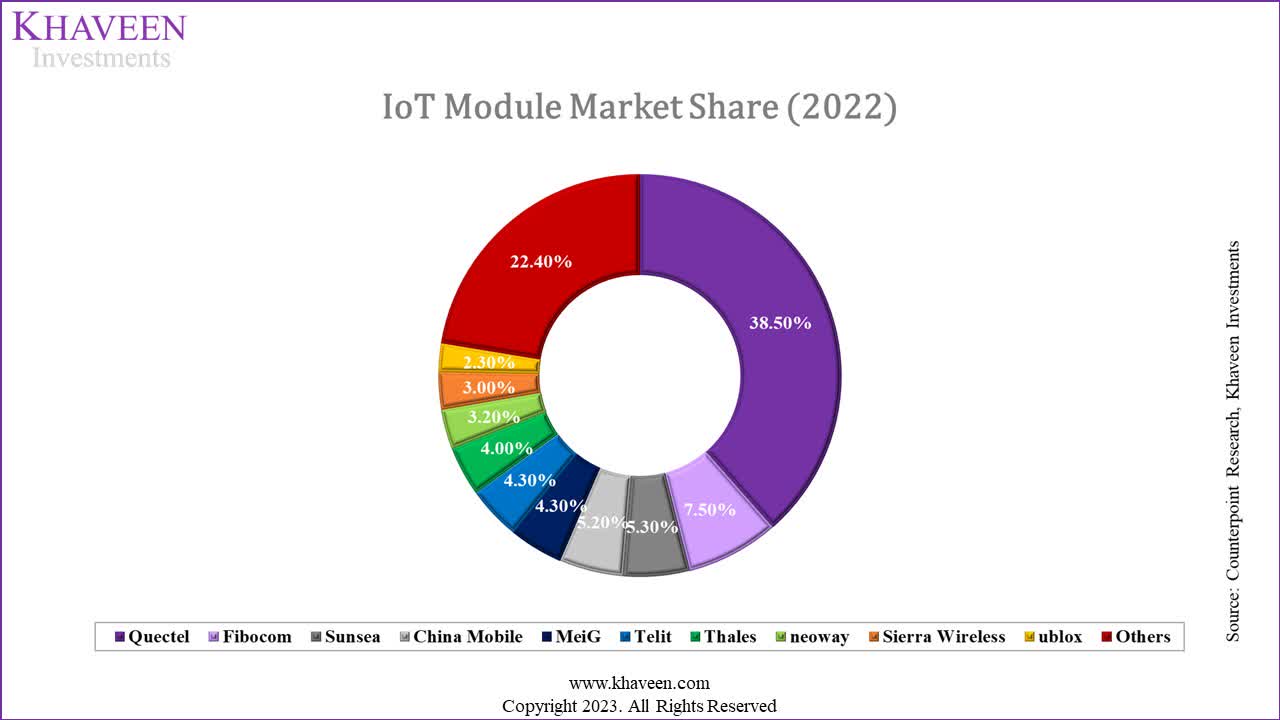
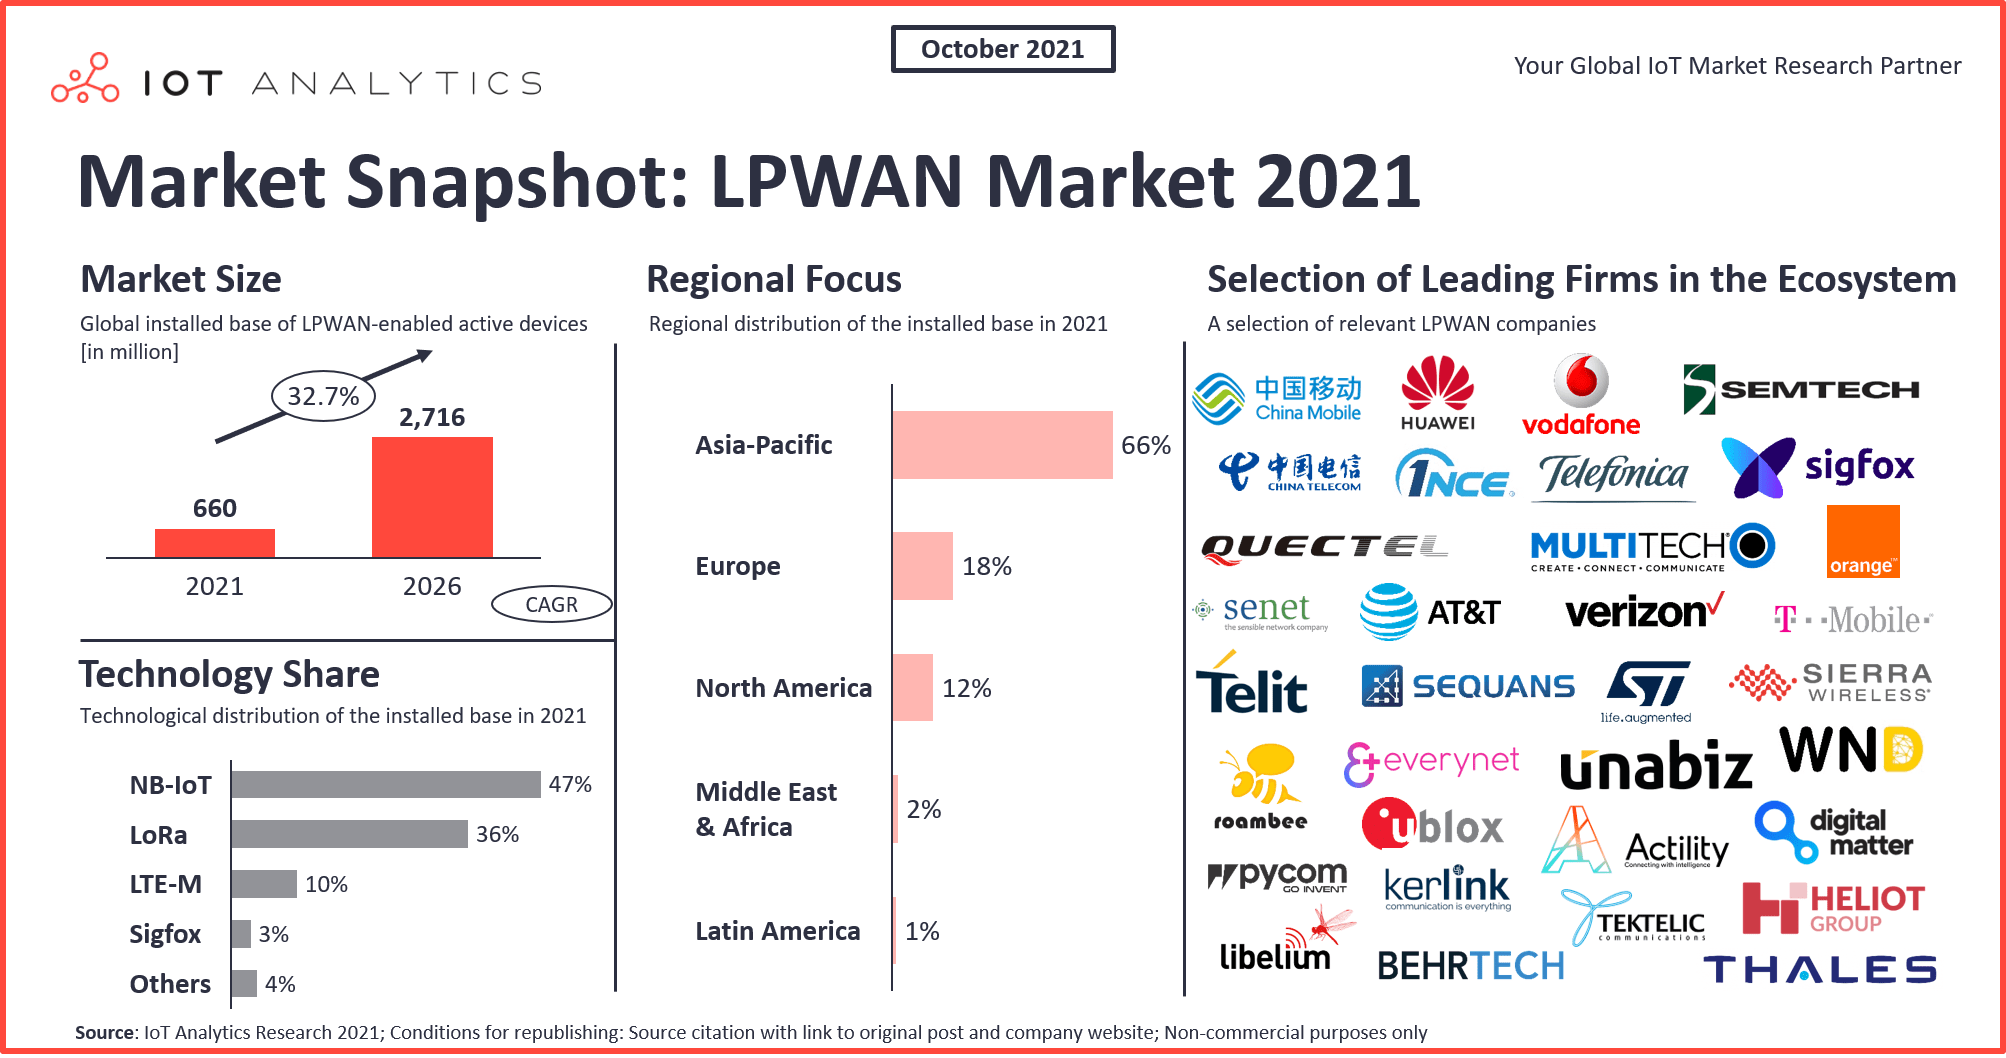
According to Counterpoint Research, Sierra Wireless was in 9th place in 2022 in the global cellular IoT module market with a share of 3% of the total market shipments. The company competes against larger players such as Quectel, Fibocom, Meig, China Mobile (CHL), Sunsea, Telit (OTC:TTCNF), Thales (OTCPK:THLEF) and Neoway. IoT modules are components that are integrated with devices to enable wireless connectivity between the device and internet networks. These modules come in various types of connectivity technologies called Low-power WAN (LPWAN) with the top 3 comprised of:
- LTE-M (10% of the market): LTE-M is a low-power cellular technology within LTE, emphasizing energy efficiency and longer range over high data rates. LTE Cat-M1, a variant, conserves network bandwidth, integrating cellular, Wi-Fi, Bluetooth, and GPS for compact internet connectivity.
- NB-IoT (47%): Narrow bandwidth compared to LTE-M and lower power consumption compared to LTE-M but with slower speeds.
- LoRa (36%: These networks are preferable due to their low power needs versus WiFi and other cellular tech. Semtech specializes in LoRa transceivers, vital for IoT sensor connectivity to LoRa networks. The company also co-founded the LoRa Alliance, a non-profit promoting LPWAN standardization and the LoRaWAN open standard worldwide. However, ABI Research forecasted LoRa to become the leading network accounting for over 50% of LPWAN connections by 2026.
In comparison with LPWAN, other connectivity technologies come under WAN including cellular 5G for mobile connectivity. These chips are made by RF front-end companies such as Qualcomm (QCOM), Broadcom (AVGO), Skyworks (SWKS) and Qorvo (QRVO).
Overall, we estimate the combined company's revenue to increase by 106% to $1.56 bln compared to $757 mln for Semtech in 2022 due to the revenue contribution from Sierra Wireless. While the company's management did not specify a revenue synergy target, it highlighted combining LoRa and cellular tech for IoT solutions and integrating the advantages of both technologies, such as low-power, long-range communication from LoRa and high-speed data from cellular networks. The integrated solutions aim to expand IoT use cases, offering choice and flexibility in connectivity, thus we believe could provide opportunities for revenue synergies.
Margins Impact Negatively from Unprofitable Acquisition
Semtech | 2018 | 2019 | 2020 | 2021 | 2022 | Average |
Gross Margins | 60.1% | 61.5% | 61.1% | 62.9% | 64.0% | 61.9% |
Net Margin | 11.1% | 5.8% | 10.1% | 17.0% | 8.1% | 10.4% |
Sierra Wireless | 2018 | 2019 | 2020 | 2021 | 2022 | Average |
Gross Margins | 33.3% | 30.8% | 35.4% | 22.8% | 33.4% | 31.2% |
Net Margin | -3.1% | -9.9% | -11.0% | -17.0% | -2.6% | -8.7% |
Source: Company Data, Khaveen Investments
Semtech's gross margins and net margins were fairly stable with an average of 61.9% and 10.4% respectively in the past 5 years. Moreover, Sierra Wireless gross margins were fairly stable with an average of 31.2% but net margins were negative in all 5 years with an average of -8.7%. Overall, Semtech has superior profitability as compared to Sierra Wireless with its gross margins twice as high as Sierra Wireless as well as having positive net margins.
Combined Company ($ mln) | 2023F | 2024F | 2025F | 2026F | 2027F |
Semtech Revenue | 815 | 879 | 949 | 1,026 | 1,110 |
Sierra Wireless Revenue | 744 | 798 | 863 | 941 | 1,033 |
Total Revenues | 1,560 | 1,677 | 1,812 | 1,967 | 2,143 |
Semtech Gross Margins | 61.9% | 61.9% | 61.9% | 61.9% | 61.9% |
Sierra Wireless Gross Margins | 31.2% | 31.2% | 31.2% | 31.2% | 31.2% |
Combined Company Gross Margins Excluding Synergies | 47.2% | 47.3% | 47.3% | 47.2% | 47.1% |
Cost Synergies | 50 | 50 | 50 | 50 | 50 |
Cost Synergies % of Revenue | 3.21% | 2.98% | 2.76% | 2.54% | 2.33% |
Combined Company Gross Margins After Synergies | 50.4% | 50.3% | 50.0% | 49.7% | 49.4% |
Semtech Net Margins | 10.4% | 10.4% | 10.4% | 10.4% | 10.4% |
Sierra Wireless Net Margins | -8.7% | -8.7% | -8.7% | -8.7% | -8.7% |
Combined Company Net Margins Excluding Synergies | 1.3% | 1.3% | 1.3% | 1.3% | 1.2% |
Combined Company Net Margins After Synergies | 4.5% | 4.3% | 4.1% | 3.8% | 3.5% |
Source: Company Data, Khaveen Investments
We estimated the company's gross and net margins each based on their past 5-year average and calculated the combined gross and net margins. Based on the table, we see Semtech's gross margins decreasing from 61.9% on average to 47.2% combined (excluding synergies) due to the lower gross margins of Sierra Wireless (31.2%). Regarding net margins, we calculated the combined margin for the company at 1.8% due to the negative profitability of Sierra Wireless.
However, according to management, the company previously expected the combined company...
...to generate US$40 million of run rate operational synergies within 12-18 months post close".
However, the company stated in its previous earnings transcript that it expected...
...to achieve about $50 million of annualized operating expense synergies by the end of the fiscal year
This is higher compared to the $40 mln initially. Furthermore, in its recent earnings briefing, management stated that its synergies were ahead of expectations.
We also posted non-GAAP earnings per share of $0.02, driven by lower OpEx as synergies were ahead of expectations. - Mohan Maheswaran, CEO
Based on this, we estimated the combined company's net margins including synergies of $50 mln, in which we obtained a 5-year forward average combined net margin of 4% which is higher than the combined average net margin of 1.3% we derived excluding synergies.
Acquisition Overpriced
In this section, we examine whether the acquisition of Sierra Wireless is worth it for Sentech. To do this, we calculated our estimate of the company's increased profit due to the acquisition from the previous point. In the previous section, we assumed that its profit would increase by $50 mln based on the annualized cost synergies as stated by management.
Incremental Profit or Revenue Synergies Required ($ mln) | 2023 | 2024 | 2025 | 2026 | 2027 |
Combined Net Profit before Synergies | 20 | 22 | 24 | 25 | 26 |
Combined Net Profit after Synergies | 70 | 72 | 74 | 75 | 76 |
Cost Synergies | 50 | 50 | 50 | 50 | 50 |
Cost Synergies Required For Deal to Be Accretive | 277 | 277 | 277 | 277 | 277 |
Combined Revenue Without Synergies | 1,560 | 1,677 | 1,812 | 1,967 | 2,143 |
Combined Revenues Required For Deal to Accretive | 1,857 | 1,976 | 2,114 | 2,271 | 2,450 |
Source: Company Data, Khaveen Investments
Based on the company's WACC which we used as its discount rate, we discounted its annualized incremental profit of $50 mln by the discount rate of 8.1%. We obtained a present value of $199 mln based on its incremental profit. This is substantially lower than the acquisition cost of $1.2 bln. Thus, we believe the company overpaid for the acquisition by $1 bln.
We then calculated how much incremental profit would be required for the deal to be worth it based on the $1.2 bln acquisition cost and determined the cost synergies needed would be $277 mln which is $252 mln higher than the current estimated incremental profit of $50 mln that management expects.
The alternative would be for the company to derive additional revenue synergies of $252 mln per year. This would represent 16.2% of 2023 total combined revenue or an additional CAGR of 9.5% the combined company would need to increase its growth rate by, which we believe is too high of a target to achieve given its combined growth at a forward average of only 8.3% (excluding 2023).
Risk: Declining IoT Market Share
Counterpoint Research, Khaveen Investments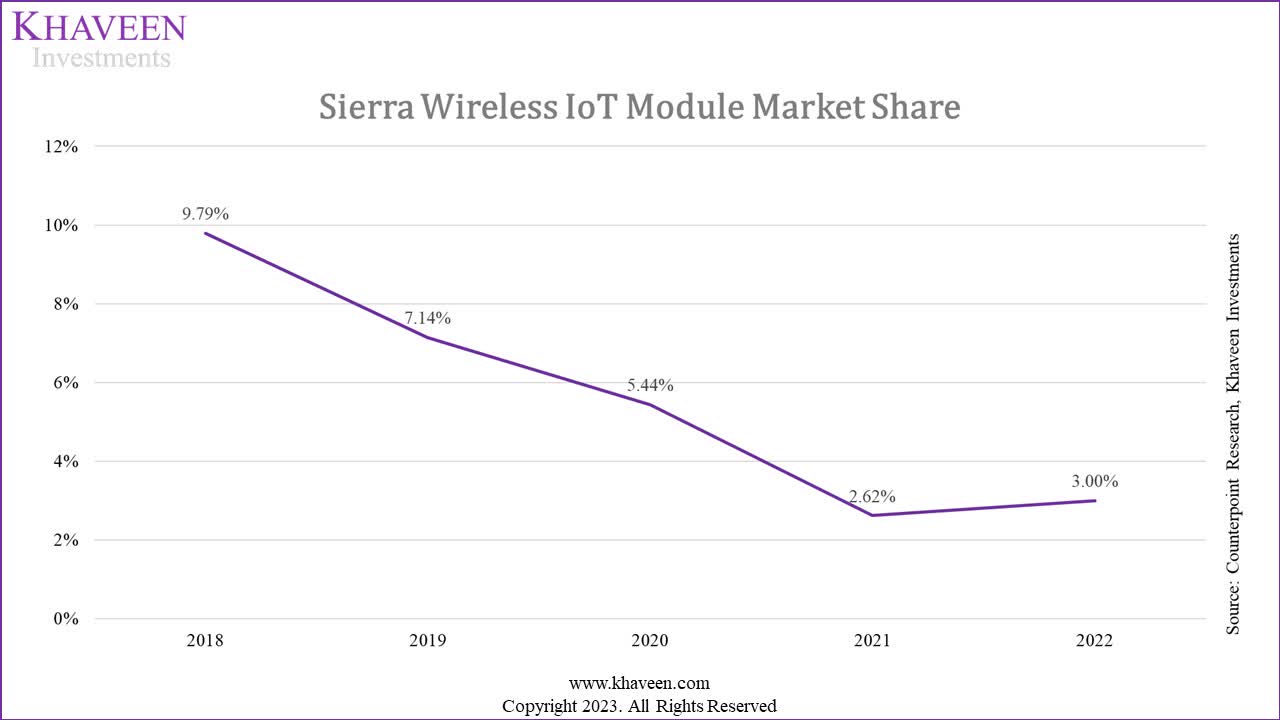
We believe one of the risks for the company is the declining share trend of Sierra Wireless. Based on Counterpoint Research, the company's share in the IoT module has declined in the past 5 years. According to Future Market Insights, the global cellular IoT module market was projected to grow at a CAGR of 23.4% but the company's past 4-year revenue growth was only 2%. Although it had increased in 2022, the company's share is still below its 2020 level and could pose a threat for the companies to realize significant revenue synergies.
Verdict
In conclusion, we anticipate that the combined company's revenue will experience a substantial 106% increase to $1.56 billion compared to Semtech's $757 mln in 2022 attributed to the inclusion of Sierra Wireless. While not indicated by management, we believe the integration of LoRa and cellular technologies for IoT solutions could create opportunities for revenue synergies. However, we estimated Semtech's gross margins to decrease from 61.9% to 47.2% due to Sierra Wireless's lower margins and the combined net margin is projected to be only 1.8%, influenced by Sierra Wireless's negative profitability.
Turning our evaluation of the acquisition's worthiness of Sierra Wireless, our analysis suggests that the acquisition might not be financially favorable. Despite an estimated incremental profit increase of $50 mln due to annualized cost synergies, we believe the company overpaid for the acquisition by $1 bln by discounting the incremental profit with its WACC. In order for the deal to be worthwhile, we calculated its incremental profit required would be an average of $302 mln per year to make the deal worth it or derive revenue synergies of $252 mln per year. Achieving these revenue synergies would represent 16.2% of the total combined revenue or necessitate an additional CAGR of 9.5%, which we believe could be ambitious given our forecasted CAGR of 8.3%. In summary, while the integration of Sierra Wireless offers potential for revenue synergies, we believe the financial evaluation highlights challenges in making the acquisition worthwhile.
Overall, we rate the company as a Hold based on the low range of analyst price target of $28 with an upside of 7% considering the company has a forward PE ratio of 63.66x which is more than double the sector median.
This article was written by

Analyst’s Disclosure: I/we have no stock, option or similar derivative position in any of the companies mentioned, but may initiate a beneficial Long position through a purchase of the stock, or the purchase of call options or similar derivatives in SMTC over the next 72 hours. I wrote this article myself, and it expresses my own opinions. I am not receiving compensation for it (other than from Seeking Alpha). I have no business relationship with any company whose stock is mentioned in this article.
No information in this publication is intended as investment, tax, accounting, or legal advice, or as an offer/solicitation to sell or buy. Material provided in this publication is for educational purposes only, and was prepared from sources and data believed to be reliable, but we do not guarantee its accuracy or completeness.
Seeking Alpha's Disclosure: Past performance is no guarantee of future results. No recommendation or advice is being given as to whether any investment is suitable for a particular investor. Any views or opinions expressed above may not reflect those of Seeking Alpha as a whole. Seeking Alpha is not a licensed securities dealer, broker or US investment adviser or investment bank. Our analysts are third party authors that include both professional investors and individual investors who may not be licensed or certified by any institute or regulatory body.