First Eagle Credit Opportunities Fund Q2 2023 Commentary

Summary
- First Eagle Investments is an independent, privately owned asset management firm dedicated to serving the needs of individuals and institutions worldwide as well as the financial professionals that advise them.
- With March’s bank failures seemingly contained, markets during the second quarter refocused their attention on the hawkish rhetoric coming from the Federal Reserve.
- New-loan issuance continued to be sluggish in the second quarter thanks to pronounced volatility and the high cost of capital.
- Uncertainty continues to be the primary driver of activity in the leveraged credit markets.
Daenin Arnee
Market Overview
With March's bank failures seemingly contained, markets during the second quarter refocused their attention on the hawkish rhetoric coming from the Federal Reserve.
The resulting rise in interest rates, combined with a dearth of new-loan supply, continued to be supportive of the leveraged loan market, which is on track for its best year since the global financial crisis. The Credit Suisse Leveraged Loan Index delivered a total return of 3.1% for the quarter, while the Bloomberg U.S. Corporate High Yield Index was up 1.7% and the Bloomberg U.S. Aggregate Bond Index fell -0.8%.1
As it was last quarter, uncertainty was the primary driver of second quarter activity in the leveraged credit markets. Without greater certainty around a range of issues - monetary policy and the tug of war between recession and inflation perhaps chief among them - it's difficult to see a significant rebound in transaction volume, and still-tight spreads suggests to us that the incremental reward for additional risk is not terribly compelling.
Higher Cost of Capital Continues to Weigh on Credit Fundamentals
It increasingly has been a tale of two markets in the US, as signals coming from the equity and fixed income markets appear to have fallen further out of sync. Given strong year-to-date returns and volatility at pre-Covid levels, equities appear to be pricing in a soft landing for the economy as the Federal Reserve continues to wage war against inflation. Fixed income markets, however, are flashing warning signs. The yield on two-year Treasuries backed up during the quarter to the 5% level that preceded March's bank failures, further inverting the yield curve, while measures of interest rate volatility remained elevated.2
While fixed income markets generally had seemed to coalesce around the "higher for longer" narrative toward the end of the first quarter, mid-March's bank failures called into question the Fed's willingness to follow through on this strategy amid such evidence of systemic fragility, pulling rates lower across the curve. While this notion dominated market action for the next several weeks, rate sentiment began to shift with the Fed's May 3 policy meeting. Though the 25 basis point increase, which brought the federal funds rate target to 5-5.25%, was dubbed by some as a "dovish hike" given the messaging that accompanied it, rhetoric from Fed governors in the days and weeks that followed made it clear there was still work to be done in the fight against inflation.
This was amplified at the central bank's mid-June meeting; though the fed funds rate was left untouched, many considered this a "hawkish pause" in light of Powell's comments and the introduction of a new dot plot showing rates peaking at 5.6% later this year. Indeed, minutes released a few weeks later revealed that a "strong majority…expect that it will be appropriate to raise interest rates two or more times by the end of the year," per Chair Powell. Additional hikes would not come as a surprise; while headline inflation has improved markedly on the back of falling energy and food costs, core inflation remains sticky, reflecting resilient economic activity and a still-strong labor market.
As a result of these shifting narratives, rates have more or less made a round trip over the past four months, with both two-year and ten-year US Treasuries retracing their pre-bank failure levels. In addition to being pricey, capital is being rationed in certain parts of the system, and bank-lending standards have tightened to levels consistent with recession. 3Higher debt servicing and refinancing costs across the loan complex show few signs of easing in the near term, and are likely to be a headwind to free cash flow, interest coverage, and other issuer fundamentals.4
Loan defaults by volume - a backward-looking indicator - have climbed nearly 100 basis points year-to-date and at 1.71% are now within striking distance of the 10-year average of 1.86%. By issuer count, defaults are already running above average. The distress ratio - a forward-looking indicator that reflects loans trading for less than 80 cents on the dollar - eased during the quarter, thanks in part to defaulted loans falling out of the measurement cohort; at 6%, however, the ratio remains well above its five-year average near 3.8%.5 Certain sectors of the market may be particularly vulnerable to default and distress; health care continues to be challenged by high labor costs, for example, while highly levered credits in technology and software are getting hit hard by the higher cost of capital.
Rating agencies, meanwhile, maintained their pessimistic outlook for credit performance going forward, and downgrades outpaced upgrades in June for the 13th consecutive month.6 Lower ratings tend to curb the demand for loans, and a bias toward downgrades typically results in greater price volatility, less new issuance, and more refinancing challenges.
Demand Was Weak, but Enough to Buoy Loan Prices amid a Dearth of Supply
New-loan issuance continued to be sluggish in the second quarter thanks to pronounced volatility and the high cost of capital; the $100 billion issued represents the slowest first half since 2010 and is off 40% from the first six months of last year. Par amount outstanding in the Morningstar LSTA US Leveraged Loan Index contracted by $12 billion, or 0.9%, in the first half of 2023, and secondary market liquidity remained unsurprisingly tight as a result.7
A rebound in equity prices and the uncertain trajectory of the economy have weighed on M&A activity, and the lack of volume has deprived lenders of a key source of capital demand. What new issuance did occur in 2023 was dominated by refinancings and amend-and-extend deals. On the bright side, we believe this has further improved what already was a quite manageable near-term loan maturity wall; the value of loans maturing in 2024 was cut in half while 2025 maturities declined by a quarter. Notably, however, the loans that are coming due in those two years are primarily rated B- or below, a cohort that may face challenges securing finance in what is likely to be a tight borrowing market.8
The lack of collateralized loan obligation (CLO) formation has been a key factor in the tepid demand for loans. With loan prices high and financing expensive, the economics of these structures - particularly in the riskier tranches - is not compelling for investors. Another CLO-related source of near-term consternation for loan demand and liquidity is the unusually large percentage of outstanding CLOs exiting their reinvestment periods between now and year-end. CLOs are structured to have finite lives, and there are guidelines in place that dictate what managers can and cannot buy during the various stages of a CLO's lifecycle. The closing of a CLO transaction is followed by a two to five-year reinvestment period during which the manager may buy or sell loans with few restrictions beyond compliance with deal covenants. The reinvestment period is followed by the amortization period during which cash flows from the CLO portfolio are returned to debt holders in order of priority, followed by the distribution of any remaining proceeds to equity investors. Once a CLO is in amortization, managers are highly constrained in their ability to trade. While fewer than 10% of CLOs typically go out of reinvestment and into amortization during any given quarter, about 40% of the CLO market will do so by the end of 2023.9
The pace of activity in the middle market direct lending space was also sluggish. It's worth noting, however, the private lenders have provided financing for more non-leveraged buyout (LBO) deals - which may include refinancings, add-ons and other M&A activity, and dividends - than the syndicated loan market for the past five quarters. And while private lenders have outpaced syndicated markets in LBO financing for some time, they more recently have begun to underwrite the very large loans that historically would have been the province of the syndicated market. 10 An uptick in M&A activity could provide interesting opportunities for private lenders and their massive amounts of dry powder.
More of the Same
Uncertainty continues to be the primary driver of activity in the leveraged credit markets. Without greater certainty around a range of issues - monetary policy and the tug of war between recession and inflation perhaps chief among them - it's difficult to see a significant rebound in transaction volume. The minimal reaction of spreads to these conditions suggest to us that the incremental reward for additional risk is not terribly compelling.
We have been de-risking the portfolio in various ways over recent quarters and continue to do so such that we can maintain the optionality to take advantage of potential opportunities as they emerge. We're biased toward liquidity, which means we're buying more broadly syndicated loans and less direct lending and focusing on higher-quality paper. We have continued to be thoughtful about loan structuring, which we believe provides an added measure of downside mitigation, and have sought to incorporate at least one financial covenant and/or liquidity test in all of our directly originated loans. We expect to remain defensively positioned until we have greater clarity.
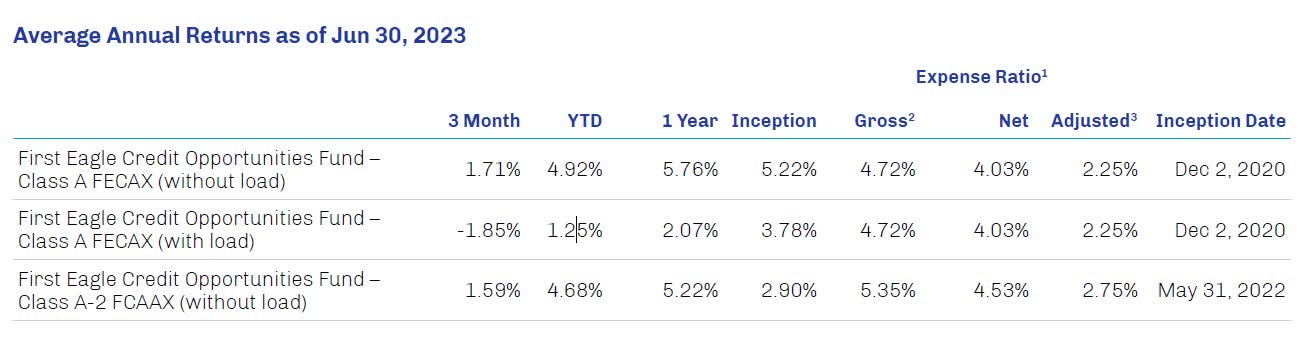
| The performance data quoted herein represent past performance and do not guarantee future results. Market volatility can dramatically impact the Fund's short-term performance. Current performance may be lower or higher than figures shown. The investment return and principal value will fluctuate so that an investor's shares, when redeemed, may be worth more or less than their original cost. Past performance data through the most recent month-end are available at www.firsteagle.com or by calling 800-334-2143. "With load" performance for Class A shares gives effect to the deduction of the maximum sales charge of 3.50%. 1The annual expense ratio is based on expenses incurred by the Fund, so that the total annual operating expenses (excluding interest, taxes, brokerage commissions, acquired fund fees and expenses, dividend and interest expenses relating to short sales, and extraordinary expenses, if any) (''annual operating expenses'') of the Class A and Class I shareholders are limited to 2.25% and 2.00%, respectively, of average net assets. This undertaking lasts until April 30, 2024 and may not be terminated during its term without the consent of the Board of Trustees. The Fund has agreed that each of Class A and Class I will repay FEIM for fees and expenses waived or reimbursed for the class provided that repayment does not cause annual operating expenses (after the repayment is taken into account) to exceed either: (1) 2.25% and 2.00% of the class' average net assets, respectively; or (2) if applicable, the then-current expense limitations. Any such repayment must be made within three years after the date in which the Fund incurred the fee and/or expense. Additionally, FEIM paid the Fund's organizational and offering costs until effectiveness of the Fund's registration statement and such costs are not being recouped by FEIM. The "Total Annual Operating Expenses After Fee Waiver and/or Expense Reimbursement" includes an estimate of interest payments the Fund expects to incur in connection with its use of leverage of 0.81%, which are excluded from the expense waiver. 2The Gross Expense Ratio includes an estimate of interest payments the Fund expects to incur in connection with its use of leverage of 1.56% and Acquired Fund Fees and Expenses (''AFFE''), which are fees and expenses incurred by the Fund in connection with its investments in other investment companies, which are excluded from the expense waiver. 3The Adjusted Expense Ratio of 2.00% for Class I and 2.25% for Class A excludes certain investment expenses, such as interest expense from borrowings and repurchase agreements and dividend expense from investments on short sales, incurred directly by the Fund or indirectly through the Fund's investments in underlying First Eagle Funds (if applicable), none of which are paid to First Eagle. The information is not intended to provide and should not be relied on for accounting or tax advice. Any tax information presented is not intended to constitute an analysis of all tax considerations. The information is not intended to provide and should not be relied on for accounting or tax advice. Any tax information presented is not intended to constitute an analysis of all tax considerations. Class A Shares. The minimum initial investment for Class A Shares is $2,500 per account. The minimum subsequent investment amount for Class A Shares is $100. Class I Shares. The minimum initial investment for Class I Shares is $1 million per account. There is no minimum subsequent investment amount for Class I Shares. The initial investment minimums may be modified for certain financial firms that submit orders on behalf of their customers. The Fund or the Distributor may lower or waive the minimum initial investment for certain classes of shares or categories of investors at their discretion. The minimum initial investment may also be modified for current officers, trustees, directors, and employees of the Fund, First Eagle, the Adviser, the Subadviser, the Distributor, certain other subsidiaries of First Eagle, The Blackstone Group Inc., Corsair Capital LLC, employees of certain firms providing services to the Fund (such as the custodian and the shareholder servicing agent), and to the immediate family members of any such persons or to any trust, pension, profit-sharing or other benefit plan for only such persons. Please see the Statement of Additional Information for details. The Credit Opportunities Fund is an Interval Fund, a type of fund that, in order to provide liquidity to shareholders, has adopted a fundamental investment policy to make quarterly offers to repurchase between 5% and 25% of its outstanding Common Shares at net asset value ("NAV"). Subject to applicable law and approval of the Board of Trustees for each quarterly repurchase offer, the Fund currently expects to offer to repurchase 5% of the Fund's outstanding Common Shares at NAV on a quarterly basis. The Credit Opportunities Fund's Common Shares are not listed for trading on any national securities exchange, have no trading market, and no market is expected to develop. Diversification does not guarantee investment returns and does not eliminate the risk of loss. A collateralized loan obligation (CLO) is a single security backed by a pool of debt. Duration is a measure of the sensitivity of the price of a bond or other debt instrument to a change in interest rates. The federal funds rate is the interest rate at which depository institutions (banks and credit unions) lend reserve balances to other depository institutions overnight on an uncollateralized basis. Reserve balances are amounts held at the Federal Reserve to maintain depository institutions' reserve requirements. Institutions with surplus balances in their accounts lend those balances to institutions in need of larger balances. A leveraged buyout (LBO) is the acquisition of another company using a significant amount of borrowed money (bonds or loans) to meet the cost of acquisition. |
| Risk Disclosures All investments involve the risk of loss of principal. An investment in the First Eagle Credit Opportunities Fund (the "Fund") involves a number of significant risks. Below is a summary of some of the principal risks of investing in the Fund. Before you invest, you should be aware of various risks, including those described below. For a more complete discussion of the risks of investing in the Fund, see the Fund's prospectus under the heading, "Principal Risks of the Fund." There are risks associated with investing in securities of foreign countries, such as erratic market conditions, economic and political instability, and fluctuations in currency exchange rates. These risks may be more pronounced with respect to investments in emerging markets. Strategies whose investments are concentrated in a specific industry or sector may be subject to a higher degree of risk than funds whose investments are diversified and may not be suitable for all investors. Investments in loans potentially expose the Fund to the credit risk of the underlying borrower, and in certain cases, of the financial institution. The Fund's ability to receive payments in connection with the loan depends primarily on the financial condition of the borrower. Even investments in secured loans present risk, as there is no assurance that the collateral securing the loan will be sufficient to satisfy the loan obligation. The market for certain loans is expected to be illiquid and the Fund may have difficulty selling them. In addition, loans often have contractual restrictions on resale, which can delay the sale and adversely impact the sale price. Below investment grade securities or comparable unrated instruments may be subject to greater risks than securities or instruments that have higher credit ratings, including a higher risk of default, and the Fund might have difficulty selling them promptly at an acceptable price. Investments in debt securities and other obligations of companies that are experiencing significant financial or business distress involve a substantial degree of risk, including a material risk that the issuer will default on the obligations or enter bankruptcy. The level of analytical sophistication, both financial and legal, necessary for successful investment in distressed assets is unusually high. There is no assurance that First Eagle Alternative Credit will correctly evaluate the value of the assets collateralizing the Fund's investments or the prospects for a successful reorganization or similar action in respect of any company. Investors may not have access to all share classes at certain financial intermediaries. Please consult your financial professional for more information. Investors should consider Common Shares of the Fund to be an illiquid investment. There is no guarantee that investors will be able to sell the Common Shares at any given time or in the quantity the investor desires. An investment in the Credit Opportunities Fund is not suitable for investors who need certainty about their ability to access all of the money they invest in the short term. One cannot invest directly in an index. Indices do not incur management fees or other operating expenses. Credit Suisse Leveraged Loan Index measures the performance of investable universe of the USD-denominated leveraged loan market. The index inception is January 1992. The index frequency is daily, weekly, and monthly. The Bloomberg US Aggregate Bond Index is an unmanaged broad-based benchmark that measures the investment grade, U.S. dollar-denominated, fixed-rate taxable bond market, including Treasuries, government-related and corporate securities, MBS (agency fixed-rate and hybrid ARM pass-throughs), ABS, and CMBS and is not available for purchase. The Bloomberg US Corporate High Yield Bond Index measures the USD-denominated, high-yield, fixed-rate corporate bond market. Securities are classified as high yield if the middle rating of Moody's, Fitch, and S&P is Ba1/BB+/BB+ or below and is composed of fixed-rate, publicly issued, non-investment grade debt, is unmanaged, with dividends reinvested, and is not available for purchase. The index includes both corporate and non-corporate sectors. The corporate sectors are Industrial, Utility, and Finance, which include both US and non-US corporations. Morningstar LSTA US Leveraged Loan Index is a market-value weighted index that measures the performance of the US leveraged loan market. This commentary represents the opinion of the First Eagle Credit Opportunities Fund portfolio managers as of 30-Jun-2023 and is subject to change based on market and other conditions. The opinions expressed are not necessarily those of the entire firm. These materials are provided for informational purposes only. These opinions are not intended to be a forecast of future events, a guarantee of future results, or investment advice. Any statistics contained herein have been obtained from sources believed to be reliable, but the accuracy of this information cannot be guaranteed. Third-party marks are the property of their respective owners. FEF Distributors, LLC ("FEFD") (SIPC), a limited-purpose broker-dealer, distributes certain First Eagle products. FEFD does not provide services to any investor but rather provides services to its First Eagle affiliates. As such, when FEFD presents a fund, strategy or other product to a prospective investor, FEFD and its representatives do not determine whether an investment in the fund, strategy or other product is in the best interests of, or is otherwise beneficial or suitable for, the investor. No statement by FEFD should be construed as a recommendation. Investors should exercise their own judgment and/or consult with a financial professional to determine whether it is advisable for the investor to invest in any First Eagle fund, strategy, or product. Investors should consider investment objectives, risks, charges and expenses carefully before investing. The prospectus and summary prospectus contain this and other information about the Funds and may be viewed at www.firsteagle.com or by calling us at 800-7472008. Please read our prospectus carefully before investing. Investments are not FDIC insured or bank guaranteed and may lose value. The First Eagle Credit Opportunities Fund is offered by FEF Distributors, LLC, a subsidiary of First Eagle Investment Management, LLC, which provides advisory services. © 2023 First Eagle Investment Management, LLC. All rights reserved. |
| Footnotes
|
Editor's Note: The summary bullets for this article were chosen by Seeking Alpha editors.
