DGRS: Finding Dividend Growth In Small Caps

Summary
- WisdomTree U.S. SmallCap Quality Dividend Growth Fund executes a strategy based on dividends, earnings growth and profitability.
- It is well-diversified across sectors and holdings.
- Valuation ratios are similar to the Russell 2000 index but quality is much better.
- It has outperformed its closest competitor but lags large-cap dividend growth ETFs.
syahrir maulana
DGRS strategy and portfolio
WisdomTree U.S. SmallCap Quality Dividend Growth Fund (NASDAQ:DGRS) started investing operations on 07/25/2013 and tracks the WisdomTree U.S. SmallCap Quality Dividend Growth Index. It is a small cap version of the more popular WisdomTree U.S. Quality Dividend Growth Fund ETF (DGRW). It has 284 holdings, a distribution yield of 1.55% and a total expense ratios of 0.38%.
As described in the prospectus, eligible stocks are in
the bottom 25% of the market capitalization of the WisdomTree U.S. Dividend Index after the 300 largest companies have been removed. From this primary universe, the Index is comprised of the top 50% of companies with the best combined rank of growth and quality factors. The growth factor ranking is based on long-term earnings growth expectations, while the quality factor ranking is based on three year historical averages for return on equity and return on assets. The Index is dividend weighted annually.
An important note for dividend growth investors, for whom the fund’s name may be misleading: the strategy is focused on dividend stocks with expected earnings growth, not growing dividends! Anyway, the underlying index has a good chance to capture forward dividend growth, and it may be a better strategy than looking at the distribution history.
The fund invests exclusively in U.S. companies, about 56% in small caps and 44% in micro caps, according to Fidelity. The top 10 holdings, listed below, weigh 15.9% of asset value. Weights are calculated based on total dividend paid (not yield). The portfolio is well-diversified and risks related to individual companies are low.
Ticker | Name | Weight% | EPS growth %TTM | P/E TTM | P/E fwd | Yield% |
CONSOL Energy Inc. | 2.02% | 502.26 | 3.98 | 3.97 | 5.24 | |
Moelis & Company | 1.83% | -88.69 | 83.58 | 205.88 | 5.44 | |
Arch Resources, Inc. | 1.62% | -6.32 | 2.91 | 5.29 | 15.18 | |
Artisan Partners Asset Management Inc. | 1.58% | -28.86 | 12.61 | 12.43 | 7.64 | |
Scotts Miracle-Gro Company | 1.57% | 49.89 | N/A | 38.22 | 5.30 | |
LCI Industries | 1.53% | -82.93 | 37.32 | 26.55 | 3.39 | |
SL Green Realty Corp. | 1.48% | -258.55 | N/A | N/A | 9.93 | |
NewMarket Corporation | 1.43% | 92.36 | 12.88 | N/A | 1.94 | |
Kontoor Brands, Inc. | 1.42% | -16.00 | 13.64 | 10.86 | 3.89 | |
Patterson Companies, Inc. | 1.40% | 3.00 | 16.02 | 13.60 | 3.06 |
The portfolio is well-balanced in the top three sectors: financials (22.6% of asset value), consumer discretionary (21.1%) and industrials (20.3%). Other sectors are below 10%. Compared to the small-cap benchmark iShares Russell 2000 ETF (IWM), DGRS is much heavier in financials, consumer discretionary and materials. It underweights mostly technology, healthcare and real estate.
DGRS sector breakdown (Chart: author; data: WisdomTree, iShares)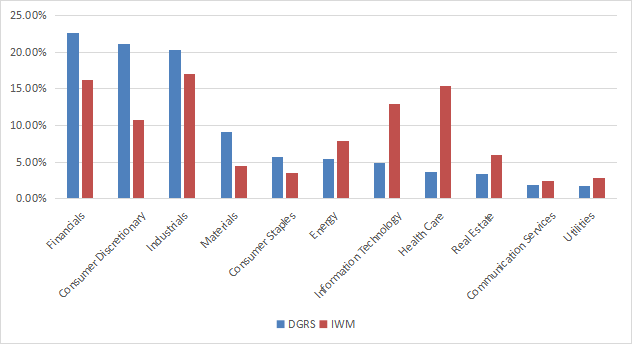
DGRS valuation and quality metrics
DGRS is close to IWM regarding valuation ratios, as reported in the next table. The price/sales and price/cash flow ratios are a bit better.
DGRS | IWM | |
Price/Earnings TTM | 12.82 | 12.29 |
Price/Book | 2.06 | 1.92 |
Price/Sales | 0.83 | 1.18 |
Price/Cash Flow | 8.03 | 8.83 |
Data: Fidelity
In previous articles, I have shown how three factors may help cut the risk in a dividend portfolio: Return on Assets, Piotroski F-score, and Altman Z-score. In my ETF reviews, risky holdings are companies with at least 2 red flags among: bad Piotroski score, negative ROA, unsustainable payout ratio, bad or dubious Altman Z-score, excluding financials and real estate where these metrics are less reliable.
Among the 284 holdings of DGRS, 28 are risky regarding my criteria and they weigh only 10.7% of asset value, which is a good point. According to my calculation, DGRS is superior to the benchmark in my three preferred quality metrics (see next table). The aggregate ROA is excellent relative to the Russell 2000.
DGRS | IWM | |
Altman Z-score | 3.52 | 2.54 |
Piotroski F-score | 5.17 | 4.52 |
ROA % TTM | 7.45 | -0.2 |
Performance
The next chart compares total returns since 8/1/2013 of DGRS, IWM and two large-cap dividend growth funds:
- Vanguard Dividend Appreciation Index Fund ETF (VIG),
- WisdomTree U.S. Quality Dividend Growth Fund ETF (DGRW).
DGRS is a bit ahead of the small-cap benchmark, but it has underperformed VIG and DGRW by a wide margin.
DGRS vs IWM, VIG, DGRW (Seeking Alpha)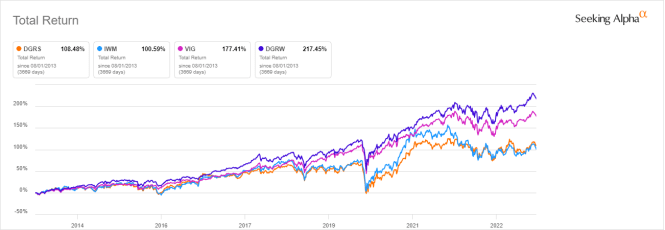
The next chart compares the 5-year returns of DGRS and its closest competitor, ProShares Russell 2000 Dividend Growers ETF (SMDV), reviewed here. DGRS has outperformed both the benchmark and its competitor on this time frame.
DGRS vs IWM, SMDV (Seeking Alpha)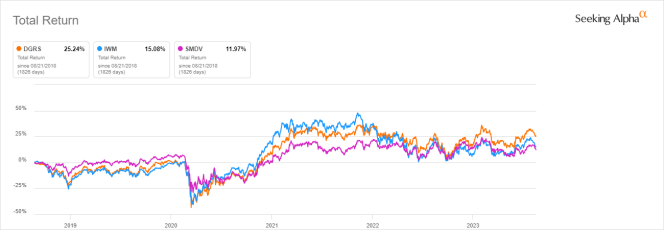
The annual sum of distributions has increased from $0.61 per share in 2014 to $1.16 in 2022. This is a 90% total growth rate, beating cumulative inflation by far (about 26% in the same time, based on CPI), but behind the growth rate of DGRW (132%).
DGRS distribution history (Seeking Alpha)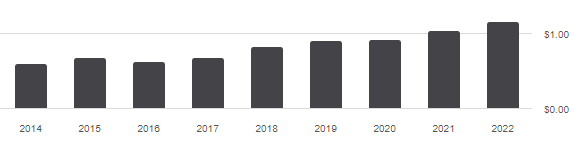
Takeaway
WisdomTree U.S. SmallCap Quality Dividend Growth Fund follows a quantitative strategy combining dividends, earnings growth and profitability factors. It is well-diversified across sectors and holdings. The fund shows average valuation ratios, but superior quality metrics. Profitability measured in aggregate ROA beats the benchmark by a wide margin. Price history since inception shows a total return similar to the Russell 2000, but behind large-cap dividend growth ETFs. DGRS has beaten its closest competitor SMDV in the last 5 years. Its dividend growth rate is very good, but it has underperformed its large-cap sibling DGRW in this regard.
Quantitative Risk & Value (QRV) features data-driven strategies in stocks and closed-end funds outperforming their benchmarks since inception. Get started with a two-week free trial now.

This article was written by

Step up your investing experience: try Quantitative Risk & Value for free now (limited offer).
I am an individual investor and an IT professional, not a finance professional. My writings are data analysis and opinions, not investment advice. They may contain inaccurate information, despite all the effort I put in them. Readers are responsible for all consequences of using information included in my work, and are encouraged to do their own research from various sources.
Analyst’s Disclosure: I/we have no stock, option or similar derivative position in any of the companies mentioned, and no plans to initiate any such positions within the next 72 hours. I wrote this article myself, and it expresses my own opinions. I am not receiving compensation for it (other than from Seeking Alpha). I have no business relationship with any company whose stock is mentioned in this article.
Seeking Alpha's Disclosure: Past performance is no guarantee of future results. No recommendation or advice is being given as to whether any investment is suitable for a particular investor. Any views or opinions expressed above may not reflect those of Seeking Alpha as a whole. Seeking Alpha is not a licensed securities dealer, broker or US investment adviser or investment bank. Our analysts are third party authors that include both professional investors and individual investors who may not be licensed or certified by any institute or regulatory body.