MTUM: Weak Relative Returns Persist Amid Mega-Caps' Underperformance

Summary
- The Momentum factor has underperformed in 2023, with investors favoring large-cap growth shares through May.
- Cyclical sectors have outperformed since June 1, with a recent jump in Treasury yields impacting the performance of the Information Technology sector.
- The iShares MSCI USA Momentum Factor ETF has endured relatively poor returns and is currently allocated to large-cap growth stocks.
- I have a hold rating on the fund ahead of Nvidia earnings on Wednesday.

gopixa
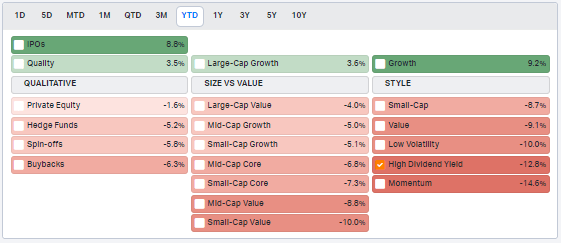
The Momentum factor has underperformed in 2023. With nearly 15 percentage points of relative losses YTD, investors have been better served focusing on large-cap growth shares this year. But could that be changing? I argue it already has. Since June 1, cyclical sectors have outperformed. More recently, since mid-July, a steep jump in Treasury yields has resulted in the Information Technology sector being the worst performer area and Energy being the best. Amid this regime of higher interest rates, I would prefer to own more cyclical and defensive firms rather than growth-heavy mega-caps (despite their ample free cash flow).
I reiterate my hold rating on the iShares MSCI USA Momentum Factor ETF (BATS:MTUM).
Momentum A Very Weak Factor in 2023
Koyfin Charts
According to the issuer, MTUM seeks to track the investment results of an index composed of U.S. large- and mid-capitalization stocks exhibiting relatively higher price momentum. It provides exposure to companies that have exhibited strong price momentum historically. The ETF is used to manage risk within a stock allocation and offers access to a factor that has historically influenced companies' risk and returns. The fund invests in momentum stocks of companies across diversified market capitalization.
With nearly $9 billion in assets under management, MTUM is a well-known fund, but it has endured relatively poor returns over the past few years care of unfortunately timed rebalances (which occur at the end of each May and November).
It is solid on expenses, though, with an annual expense ratio of just 0.15% while its dividend yield over the last year is 2.3% (expect the payout to be a bit smaller than that right now given its high weighting in growth-heavy sectors that do not make large distributions). Fund ETF earns a mediocre C momentum rating, though its liquidity profile is solid. The average volume is close to 400,000 shares and its 30-day median bid/ask spread is modest at just two basis points.
Digging into the portfolio, data from Morningstar reveal that MTUM is currently allocated to large-cap growth stocks. Before the May rebalance, it was more oriented into value areas, and since my review of the fund earlier this year, there is even more weight to the upper-right portion of the Style Box. Moreover, just 18% of the fund is considered SMID cap.
With a price-to-earnings ratio that is now north of 23, the 129-holding portfolio depends on high EPS growth. Nvidia (NVDA) reports Q2 results this Wednesday, and that is the largest single stock position, so expect potential volatility in MTUM price action later this week.
MTUM: Portfolio & Factor Profiles
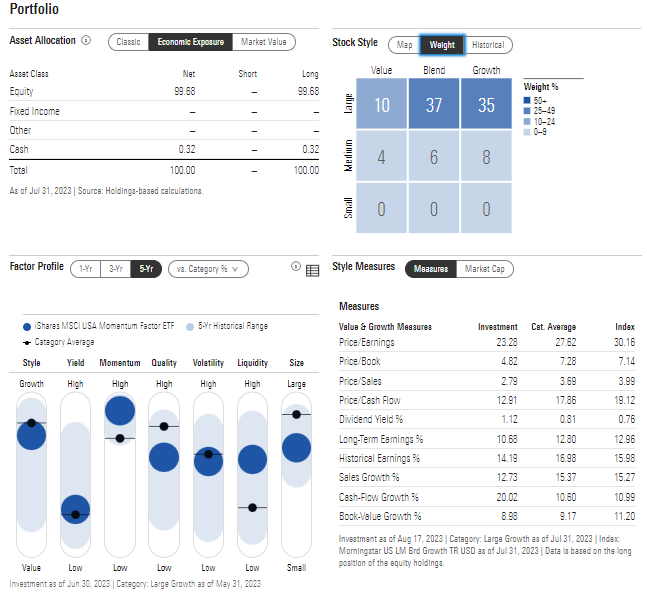
Morningstar
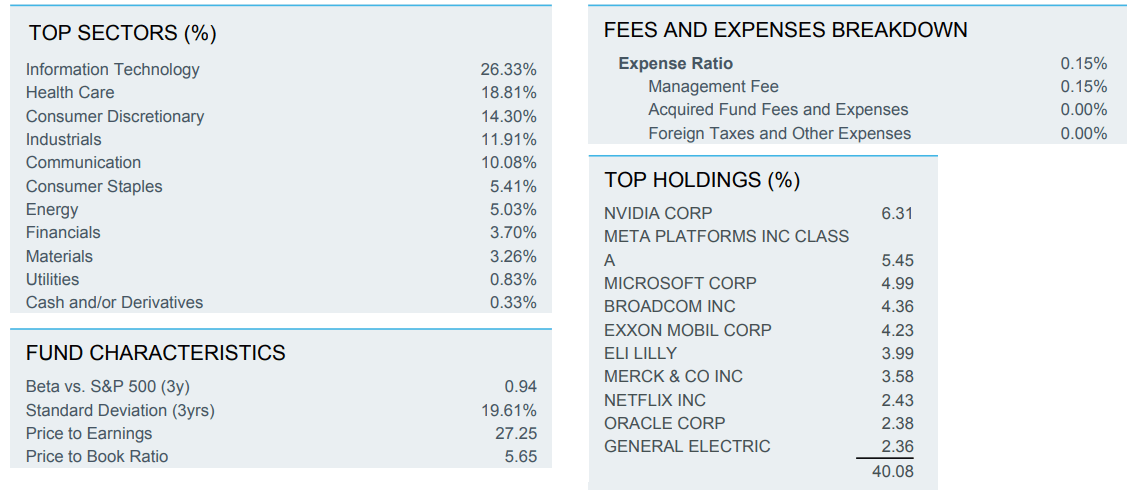
Along with NVDA being the top holding, the broader Information Technology sector commands the largest weight in MTUM at nearly 30% - that is close to the I.T.’s position in the S&P 500. There is an overweight to Health Care and Communication Services, while other sector percentages are close to those of the SPX. Its 30-day SEC yield is down to 0.9% as of August 18, 2023, while the portfolio’s beta is actually under 1, indicating lower volatility compared to the S&P 500.
MTUM: Tech Top Sector, NVDA Earnings Key This Week
iShares
Seasonally, MTUM tends to encounter volatility and some downside price action from late August through mid-October, according to data from Equity Clock. So, now may not be the best time to enter a new long position in the fund, but waiting until early Q4 to buy has historically been a prudent plan.
MTUM: Neutral Trends Through Mid-October
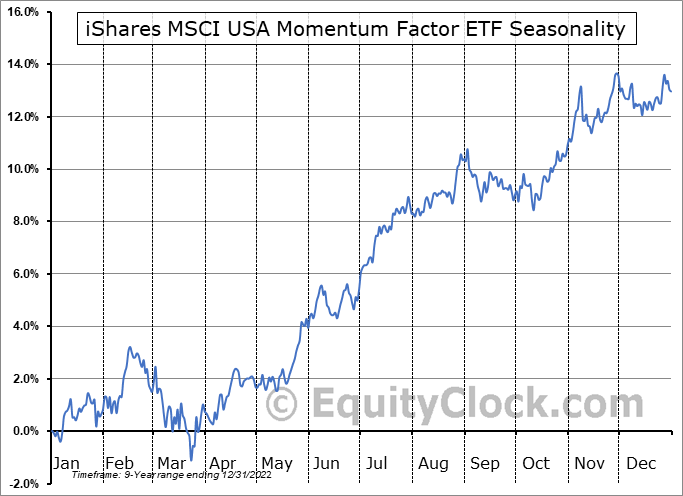
Equity Clock
The Technical Take
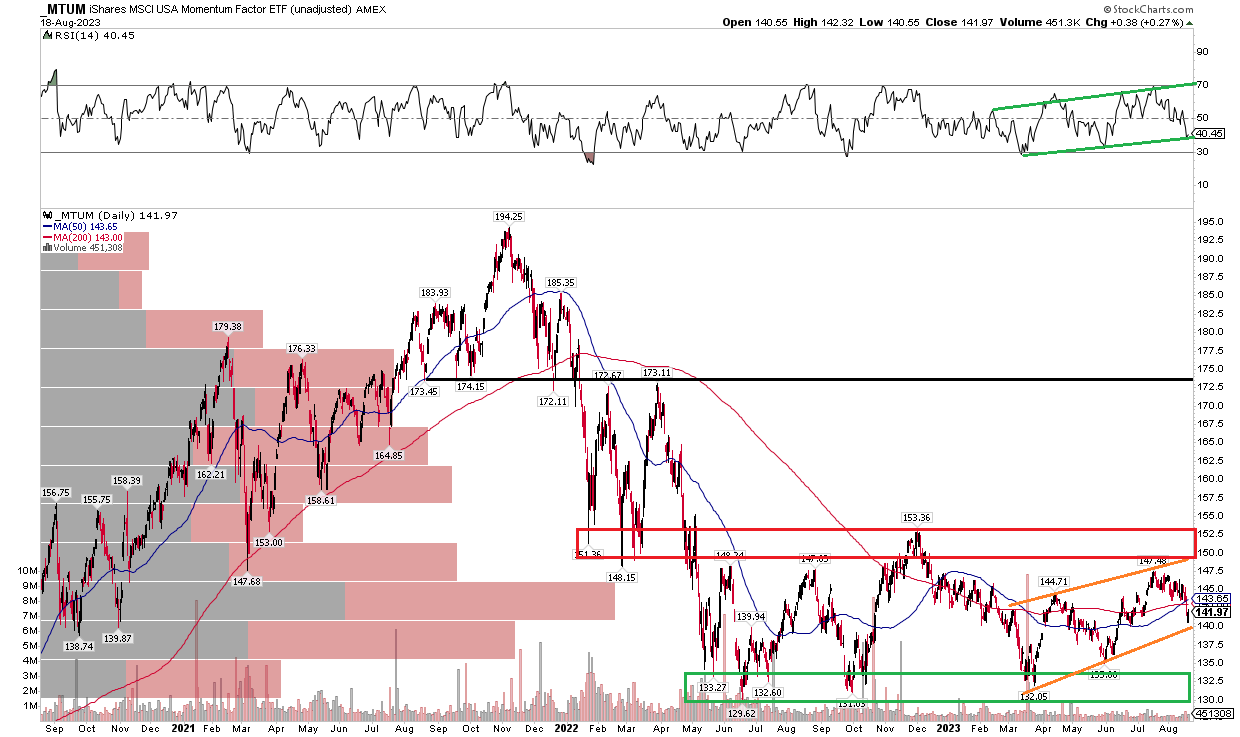
MTUM’s technical situation has improved since my Q2 review. Notice in the chart below that shares are now trending up, with a series of higher lows and higher highs off the March 2023 nadir. What’s more, the downtrend resistance line I described last time has been broken, and the ETF now eyes key resistance in the $150 to $154 zone. A rally above the December 2022 peak would help support the bullish case that a rally up to the early 2022 peak and Q3 2021 range lows in the low to mid $170s could be in play.
For now, though, a high amount of volume by price in the $140s could make for tough slogging for the bulls, the upper $120s to low $130s continues to see buying support. Finally, while the long-term 200-day moving average is flat in its slope, there is an uptrend in the RSI momentum index at the top of the chart, which buttresses the price uptrend.
Overall, there are encouraging signs here.
MTUM: Eyeing A New Uptrend, $153 Resistance
Stockcharts.com
Readers know I like to compare MTUM to both SPY and its Vanguard Momentum counterpart (VFMO). With relative weakness in small caps lately, MTUM has been outpacing VFMO, though negative alpha year-to-date remains. Compared to the S&P 500, MTUM remains near this year’s lows – a bad sign if you look to be overweight the momentum factor right now.
MTUM Underperforming SPY, VFMO YTD
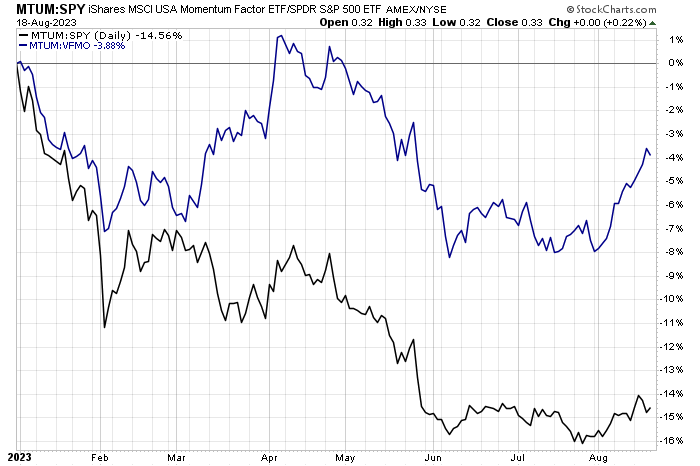
Stockcharts.com
The Bottom Line
I reiterate my hold rating on MTUM. I like that its absolute chart is encouraging, but relative strength remains soft, and the fund is allocated to areas that are richly valued amid the current rising-rate environment.
This article was written by

Analyst’s Disclosure: I/we have a beneficial long position in the shares of VFMO either through stock ownership, options, or other derivatives. I wrote this article myself, and it expresses my own opinions. I am not receiving compensation for it (other than from Seeking Alpha). I have no business relationship with any company whose stock is mentioned in this article.
Seeking Alpha's Disclosure: Past performance is no guarantee of future results. No recommendation or advice is being given as to whether any investment is suitable for a particular investor. Any views or opinions expressed above may not reflect those of Seeking Alpha as a whole. Seeking Alpha is not a licensed securities dealer, broker or US investment adviser or investment bank. Our analysts are third party authors that include both professional investors and individual investors who may not be licensed or certified by any institute or regulatory body.