PPA: Is This Aerospace And Defense ETF Set To Soar?

Summary
- The iShares U.S. Aerospace & Defense ETF tracks an Index with an impressive 25-year track record that beats the S&P 500 Index.
- Between 1998-2023, there were only five key six-month periods where PPA or its Index lagged SPY by more than 10%. However, there were ten periods where it outperformed by 10%.
- As a result, you'll find PPA's downside risk-adjusted returns to be excellent. It's also well-diversified, with Boeing Airlines accounting for 7.20% of the fund compared to 18.90% for PPA's competitor.
- PPA's fundamentals are moving in the right direction after a Q2 earnings season where nearly all holdings beat on sales and earnings. While its valuation could be slightly elevated, I believe it's a solid ETF to buy-and-hold for the long term.
- Looking for a portfolio of ideas like this one? Members of Hoya Capital Income Builder get exclusive access to our subscriber-only portfolios. Learn More »

phaisarn2517
Investment Thesis
The Invesco Aerospace & Defense ETF (NYSEARCA:PPA) has outperformed the Industrial Select Sector SPDR ETF (XLI) by 1.68% per year since its October 2005 launch and did so with less volatility. This track record alone suggests it's worth owning, and value investors should take note that PPA has lagged behind the market by 7.13% over the last six months. While its valuation may be slightly elevated, I find PPA to be a superior choice compared to two other Aerospace & Defense ETFs, and I look forward to explaining why I've rated it a "buy" in more detail below.
PPA Strategy, Peer Group, And Use of Backtested Data
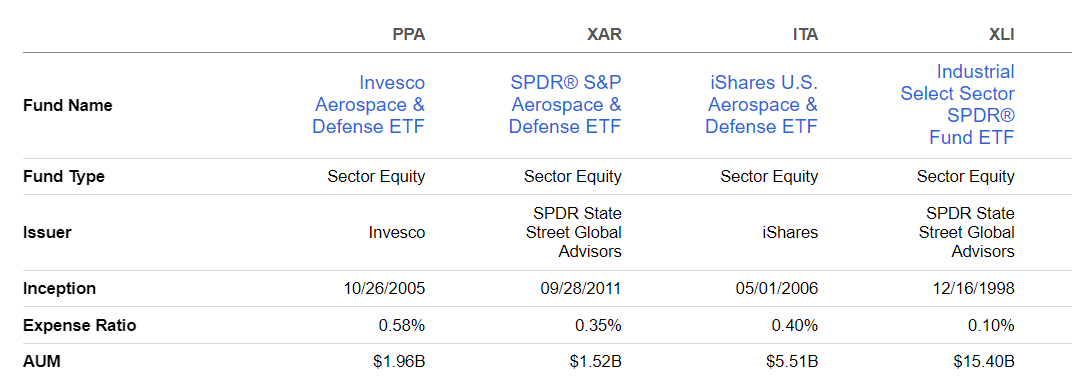
This article compares PPA with the SPDR S&P Aerospace & Defense ETF (XAR) and the iShares U.S. Aerospace & Defense ETF (ITA). I was prompted to analyze these three together as readers of my latest article on the Industrials Select Sector SPDR ETF (XLI) pointed out how many industries within the Industrial sector have significantly different profiles. The table below, courtesy of Seeking Alpha, compares these ETFs.
Seeking Alpha
PPA is the most established, with a launch date of October 26, 2005. However, iShares introduced ITA six months later and undercut PPA's fees by 0.18%, a strategy that proved successful. ITA's $5.51 billion in assets under management is 2.5x more than PPA's, and XAR's $1.52 billion figure is catching up to PPA's despite launching six years later.
PPA aims to track the performance of the SPADE Defense Index before fees. The Index is modified cap-weighted and typically holds 50 companies with products and services, including naval vessels, military aircraft, missiles, and missile defense. According to a press release, the Index launched on July 6, 2004. However, the Index provides annual returns to 1998 at this link, with daily price information available here. Usually, I don't emphasize backtested results, but I made an exception based on my e-mail exchange with the founder of the Index, Scott Sacknoff. Scott explained the rigorous quarter-by-quarter testing process performed almost two decades ago. Furthermore, the Index was designed to represent the defense sector's performance instead of other indexes created to support an ETF's launch. This legitimizes the backtested results, and as such, I will incorporate them into my analysis.
PPA Performance Analysis
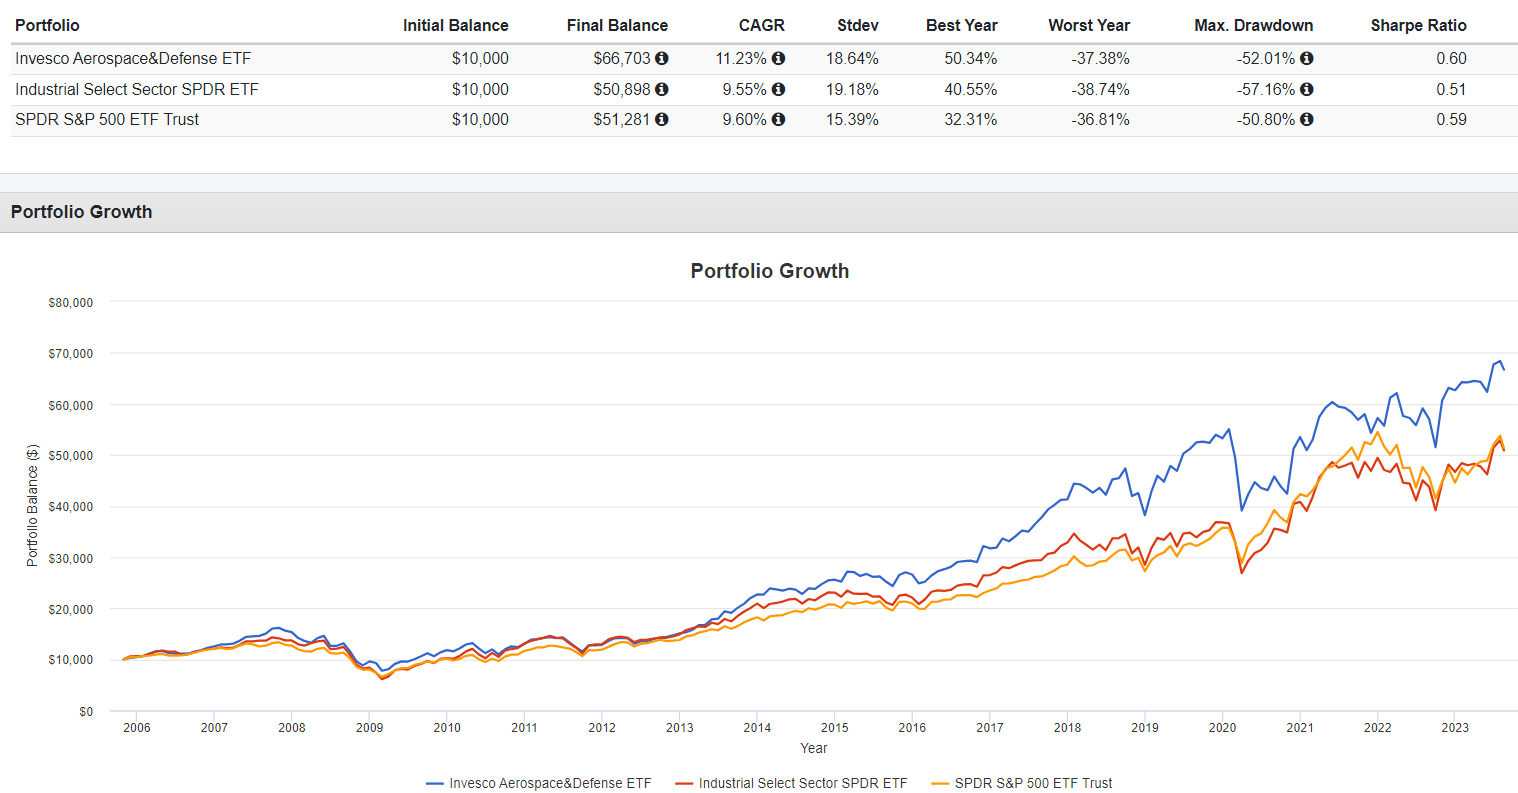
The following graph highlights PPA's 11.23% annualized gain since November 2005, 1.68% and 1.63% better than XLI and the SPDR S&P 500 ETF (SPY). Over this period, PPA's volatility (standard deviation) was slightly less than XLI's but more than SPY's. PPA also had a better maximum drawdown figure than XLI (52.01% vs. 57.16%), but both are still significant. For reference, the Utilities Select Sector SPDR ETF (XLU) declined by 38.05% over the Great Financial Crisis, so I wouldn't put PPA in the same category as a risk-reducer. Instead, it's just less volatile than the broader Industrial sector.
Portfolio Visualizer
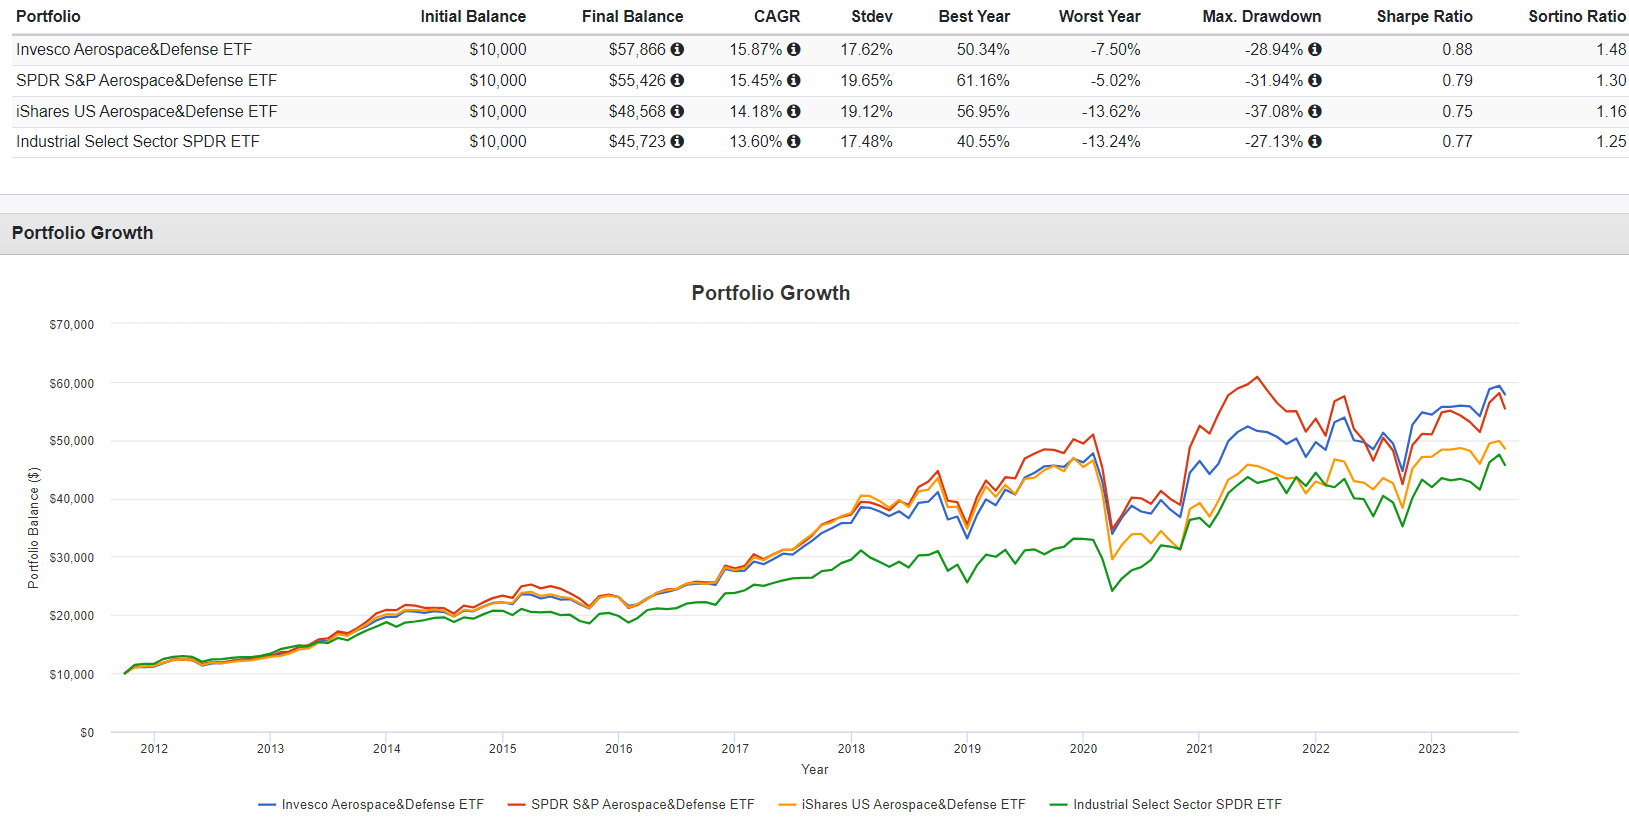
Since XAR's launch twelve years ago, PPA gained an annualized 15.87% vs. 15.45%, 14.18%, and 13.60% for XAR, ITA, and XLI. We also see a lower standard deviation for PPA compared to XAR and ITA, but I want to highlight PPA's substantially higher downside risk-adjusted returns, as measured by the Sortino Ratio. This metric is helpful for defensive investors because it recognizes that not all volatility is unwanted. A rational investor is only concerned with downside risk; they have no issue with stock prices rising abnormally high.
Portfolio Visualizer
Next, let's examine the additional returns provided by SPADE Indexes compared with the S&P 500 Index. Please note that these are only Index returns, which do not include fees.
- 1998: 6.63% vs. 26.67%
- 1999: 15.31% vs. 19.53%
- 2000: 4.98% vs. -10.14%
- 2001: 0.94% vs. -13.04%
- 2002: -2.87% vs. -23.37%
- 2003: 37.27% vs. 26.38%
- 2004: 20.47% vs. 8.99%
- 2005: 5.30% vs. 3.00%
The Defense Index lagged by 20% in 1998 and 4% in 1999 before outperforming by 11-20% from 2000-2004. It's also noteworthy how 2008 was the only year the Index declined substantially (38.03%). The Index declined by 8.15% in 2018, but losses were less than 3% in 2002, 2011, and 2020. Meanwhile, the S&P 500 lost 10% or more in five years (2000, 2001, 2002, 2008, and 2022), so notwithstanding PPA's higher standard deviation, I believe it's a safer investment.
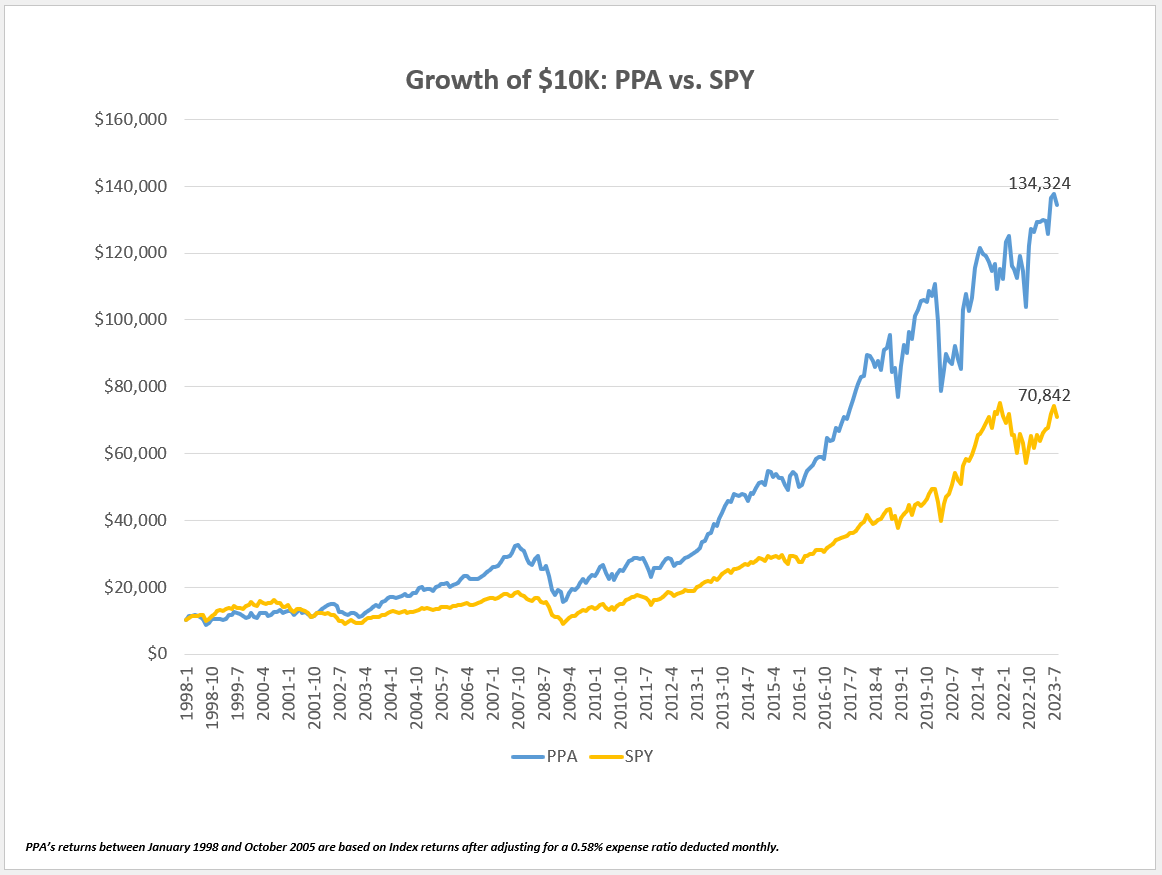
Finally, I've compiled monthly Index return data from January 1998 to October 2005 and adjusted it for PPA's 0.58% expense ratio. I then combined this data with PPA's actual returns from November 2005 onwards to provide a complete performance picture. Here is a chart showing the growth of $10,000, with additional statistics to follow.
The Sunday Investor
PPA's ending balance would be $134,324 compared to $70,842 for SPY. These values translate to annualized returns of 10.65% and 7.93%, with 18.60% and 15.55% standard deviation figures. Furthermore, I calculated when PPA trailed SPY by 10% or more over six months. Surprisingly, there were only five periods worth noting:
- March 1998 to August 1998: 16.49% (-24.61% vs. -8.13%)
- August 1999 to January 2000: 14.91% (-9.23% vs. 5.68%)
- February 2009 to July 2009: 12.79% (8.05% vs. 20.84%)
- March 2020 to August 2020: 26.60% (-7.44% vs. 19.16%)
- June 2021 to November 2021: 19.18% (-10.01% vs. 9.17%)
However, there were ten distinctive periods when PPA outperformed SPY by 10% or more, as follows:
- February 1999 to July 1999: 13.66% (18.22% vs. 4.56%)
- September 2000 to February 2001: 21.12% (2.95% vs. -18.17%)
- December 2001 to May 2002: 28.18% (22.78% vs. -5.40%)
- April 2007 to September 2007: 14.21% (22.63% vs. 8.42%)
- May 2013 to October 2013: 13.68% (24.90% vs. 11.21%)
- April 2017 to September 2017: 11.03% (18.65% vs. 7.62%)
- January 2019 to June 2019: 13.28% (31.61% vs. 18.32%)
- October 2020 to March 2021: 11.69% (30.93% vs. 19.24%)
- January 2022 to June 2022: 17.54% (-2.44% vs. -19.98%)
- September 2022 to February 2023: 11.52% (12.68% vs. 1.16%)
This analysis reveals how PPA is more likely to experience periods of substantial outperformance than underperformance. Furthermore, there isn't a performance link with bull and bear markets. PPA outperformed SPY in periods of market decline (#2, #3, and #9) and beat in periods when the market gained 10% or more (#5, #7, and #8).
For the six months ending August 18, 2023, PPA trails SPY by 7.13% (3.86% vs. 10.99%). If history is any guide, there's an above-average chance PPA will outperform moving forward.
PPA Fundamental Analysis
The following table highlights selected fundamental metrics for PPA's top 25 holdings, totaling 84% of the portfolio. The Boeing Company (BA) is PPA's top stock with a 7.20% weighting, between XAR's 4.44% and ITA's 18.90%.
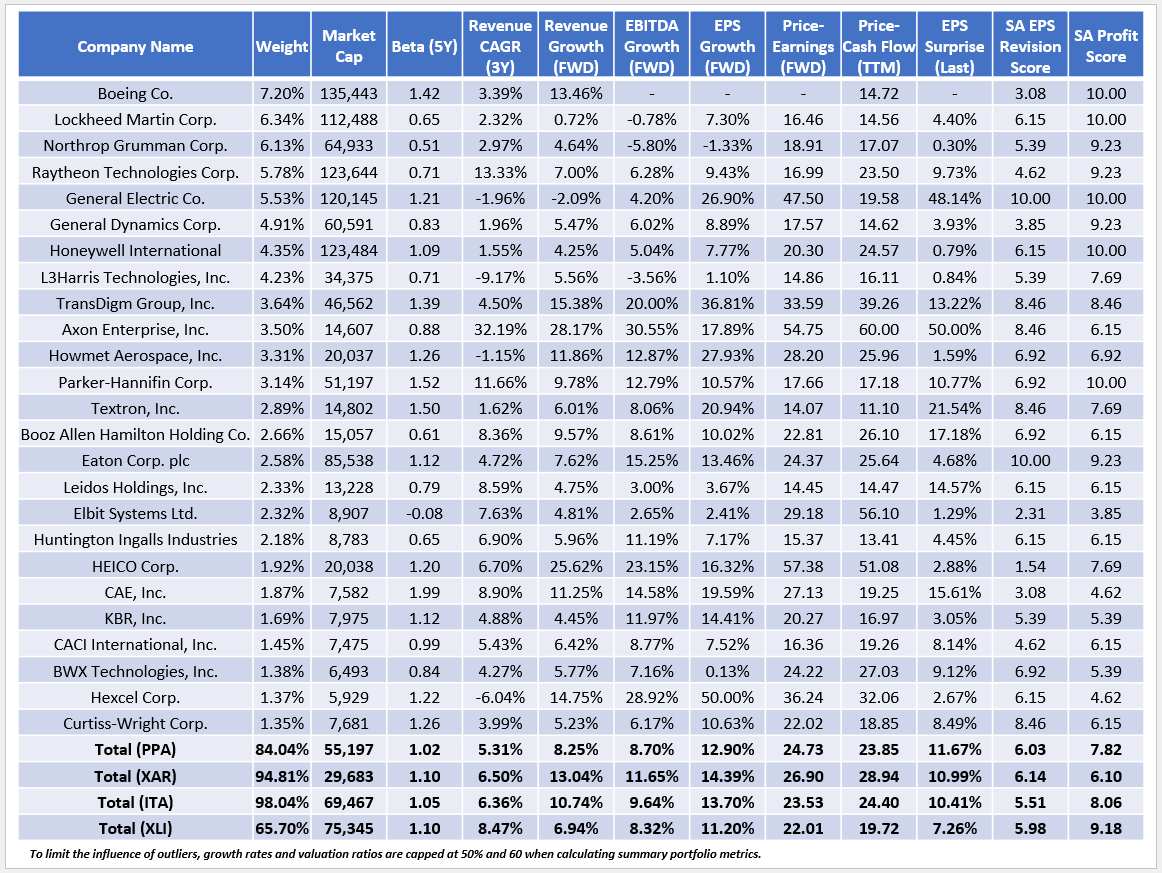
The Sunday Investor
First, I want to highlight the three Aerospace & Defense ETFs' lower profitability scores. PPA's and ITA's are close at 7.82/10 and 8.06/10, while the equal-weight XAR is low at 6.10/10. This dynamic makes sense as smaller companies are typically less profitable. XAR's low $29.7 billion weighted average market cap supports this concept. In XLI, the weighted average profitability scores for its industries are as follows:
- Aerospace & Defense: 9.16/10
- Agricultural & Farm Machinery: 10/10
- Air Freight & Logistics: 9.86/10
- Building Products: 8.33/10
- Cargo Ground Transportation: 8.99/10
- Construction & Engineering: 6.15/10
- Construction Machinery & Heavy Transportation Equipment: 9.15/10
- Data Processing & Outsourced Services: 7.69/10
- Diversified Support Services: 9.23/10
- Electrical Components & Equipment: 8.89/10
- Environmental & Facilities Services: 9.23/10
- Human Resource & Employment Services: 9.59/10
- Industrial Conglomerates: 9.72/10
- Industrial Machinery & Supplies & Components: 8.60/10
- Passenger Airlines: 8.70/10
- Rail Transportation: 10/10
- Research & Consulting Services: 7.54/10
- Trading Companies & Distributors: 9.48/10
You might wonder how XLI's Aerospace & Defense industry could have a 9.16/10 Profit Score while PPA's is only 7.82/10. The main reason is XLI holds only 11 Aerospace & Defense stocks, while PPA holds 30, plus 23 in 12 other industries. These additional stocks have market capitalizations between $613 million and $20 billion and profit scores between 2.31/10 and 7.69/10. I mention this to ensure readers know that with PPA, you get an all-cap fund, while XLI holds only large caps. Generally, that means better growth potential but also greater risk. PPA's five-year beta is 1.02 compared to 0.93 for the Aerospace & Defense stocks in XLI.
We see that growth potential in PPA's estimated sales, EBITDA, and EPS growth rates of 8.25%, 8.70%, and 12.90%, which are all better than what XLI features. However, they're noticeably lower than what XAR and ITA offer. Boeing reported an earnings beat of $0.12 per share this quarter, resulting in a 5.85% share price gain since. This was bullish for ITA, as it overweights the stock. However, the company still reported a loss of $0.25 per share, and investors might find PPA's 7.20% weighting more reasonable than ITA's 18.90%. Effectively, ITA is a strong bet on a Boeing turnaround, as the stock is still down 35.38% over the last five years.
In exchange for lower growth, PPA investors get a cheaper trailing price-cash flow valuation than ITA (23.85x vs. 24.40x), though its more expensive on forward price-earnings (24.73x vs. 23.53x). Morningstar, which calculates valuation ratios using the weighted average harmonic mean method, tells a similar story on price-earnings: 21.57x vs. 20.43x. However, what's not evident to many investors is that these figures exclude companies with negative earnings, specifically Boeing. After applying Morningstar's cap of 60 to non-profitable stocks, PPA's forward price-earnings ratio jumped to 27.67x. Meanwhile, ITA's spiked to 31.99x. It's a crucial reminder to investors to consider profitability in conjunction with an ETF's posted valuation ratios. The calculation is misleading since it only applies to 77% of ITA's constituents.
It's also evident that PPA's constituents had a solid earnings season, surprising on earnings by 11.67% on a weighted average basis. The following table summarizes the earnings season results for PPA's top 25 holdings and shows how all beat analyst expectations this quarter. Furthermore, all but Honeywell International (HON) and KBR (KBR) beat on revenue.
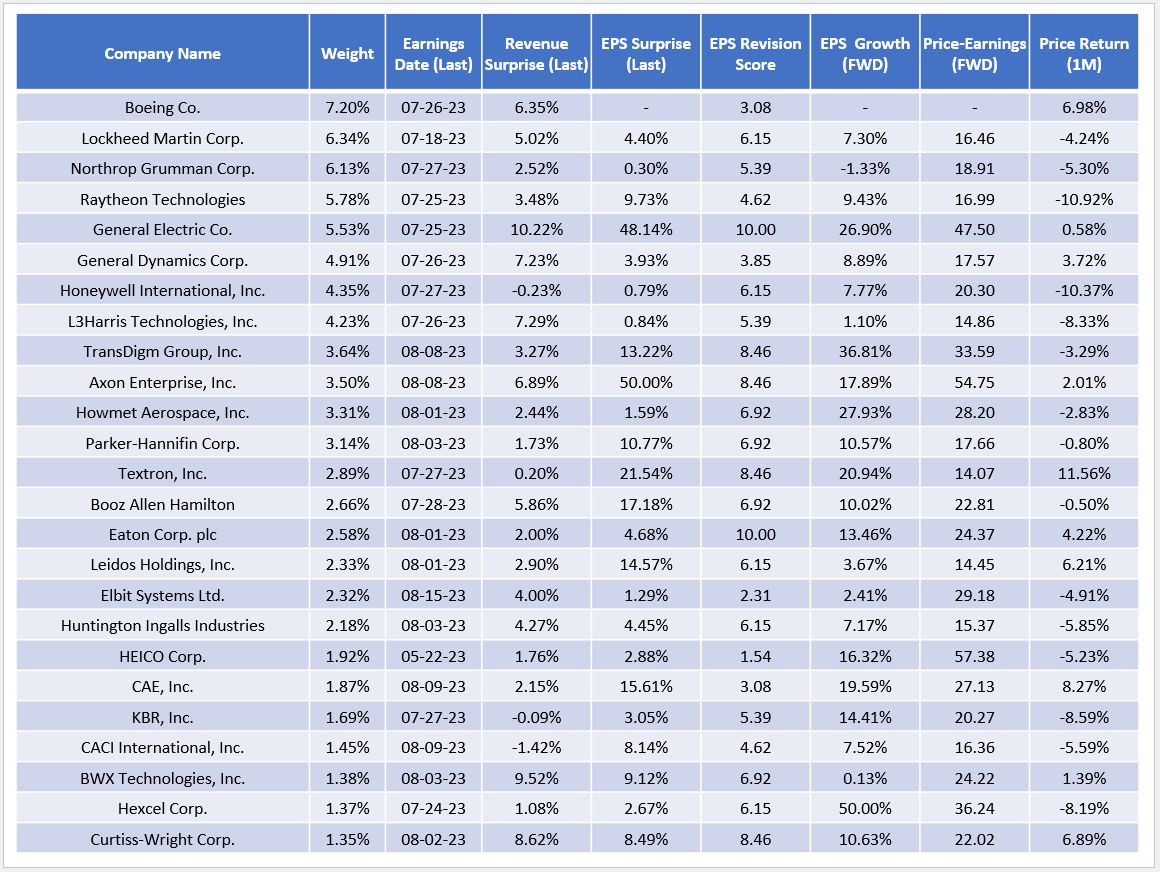
The Sunday Investor
In contrast, Yardeni Research reports 75.0%, 78.1%, and 63.4% of large-, mid-, and small-cap Industrial stocks reported a positive earnings surprise this quarter. This is evidence the Aerospace & Defense industry is leading the Industrial sector, and PPA's 6.03/10 Seeking Alpha EPS Revision Score is a substantial improvement over its 5.37/10 score four months ago. In short, PPA's fundamentals are moving in the right direction.
Investment Recommendation
PPA is a top-performing Aerospace & Defense fund that tracks an Index with a 25-year history. Flaws include a relatively high 0.58% expense ratio, low net assets, and a somewhat high valuation relative to large-cap Industrial stocks. However, the positives outweigh the negatives. Specifically:
1. The SPADE Defense Index experienced more periods of substantial outperformance over the S&P 500 Index than underperformance. Also, the Index has outperformed in both rising and falling markets.
2. In years where the Index underperformed, losses were limited. Except for 2008 and 2018, the Index declined in just three years (2002, 2011, and 2020), and the decline was less than 3%.
3. PPA is a well-diversified ETF, with 84% of assets in the top 25 compared to 95% and 98% for XAR and ITA. Boeing has a 7.20% weighting, which is substantial but doesn't dominate the ETF, as is the case with ITA.
4. Boeing also is not included in either ETF's price-earnings ratio because it is not expected to turn a profit over the next year. After adjusting for this, PPA's valuation is more attractive than ITA's.
5. PPA's 7.82/10 Profit Score is substantially better than XAR's 6.10/10, making it a relatively safer fund to own over the long term.
Given these points, I've rated PPA as a long-term "buy." The timing might be wrong, as PPA will likely decline if the broader stock market sells off. However, it's trailed SPY by 7.13% over the last six months, and if history is any guide, this should provide buyers with a decent margin of safety moving forward. Thank you for reading, and I look forward to your comments below.
The Sunday Investor Joins Income Builder
The Sunday Investor has teamed up with Hoya Capital to launch the premier income-focused investing service on Seeking Alpha. Members receive complete early access to our articles along with exclusive income-focused model portfolios and a comprehensive suite of tools and models to help build sustainable portfolio income targeting premium dividend yields of up to 10%.
Whether your focus is High Yield or Dividend Growth, we’ve got you covered with actionable investment research focusing on real income-producing asset classes that offer potential diversification, monthly income, capital appreciation, and inflation hedging. Start A Free 2-Week Trial Today!

This article was written by

I perform independent fundamental analysis for over 850 U.S. Equity ETFs and aim to provide you with the most comprehensive ETF coverage on Seeking Alpha. My insights into how ETFs are constructed at the industry level are unique rather than surface-level reviews that’s standard on other investment platforms. My deep-dive articles always include a set of alternative funds, and I am active in the comments section and ready to answer your questions about the ETFs you own or are considering.
My qualifications include a Certificate in Advanced Investment Advice from the Canadian Securities Institute, the completion of all educational requirements for the Chartered Investment Manager (CIM) designation, and a Bachelor of Commerce degree with a major in Accounting. In addition, I passed the CFA Level 1 Exam and am on track to become licensed to advise on options and derivatives in 2023. In November 2021, I became a contributor for the Hoya Capital Income Builder Marketplace Service and manage the "Active Equity ETF Model Portfolio", which as a total return objective. Sign up for a free trial today! Hoya Capital Income Builder.
Analyst’s Disclosure: I/we have a beneficial long position in the shares of SPY either through stock ownership, options, or other derivatives. I wrote this article myself, and it expresses my own opinions. I am not receiving compensation for it (other than from Seeking Alpha). I have no business relationship with any company whose stock is mentioned in this article.
Seeking Alpha's Disclosure: Past performance is no guarantee of future results. No recommendation or advice is being given as to whether any investment is suitable for a particular investor. Any views or opinions expressed above may not reflect those of Seeking Alpha as a whole. Seeking Alpha is not a licensed securities dealer, broker or US investment adviser or investment bank. Our analysts are third party authors that include both professional investors and individual investors who may not be licensed or certified by any institute or regulatory body.