Bulls Back Off

Summary
- This month’s negative tone continued in the past week as the S&P 500 collapsed through its 50 DMA. Not surprisingly, the weakness has put a dampener on sentiment.
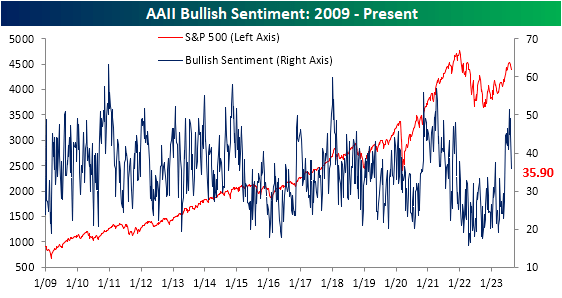
- The latest investor sentiment survey from AAII showed only 35.9% of respondents reported as bullish.
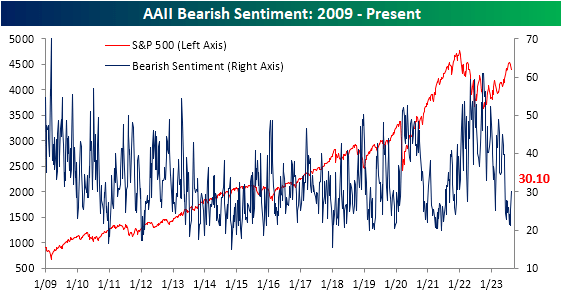
- Bearish sentiment picked up some of the difference this week, rising 4.6 percentage points to 30.1% and is the highest reading since the first week of June.
peterschreiber.media
This month’s negative tone continued in the past week as the S&P 500 collapsed through its 50 DMA. Not surprisingly, the weakness has put a dampener on sentiment.
The latest investor sentiment survey from AAII showed only 35.9% of respondents reported as bullish.
That is down for a second week in a row from 49% two weeks ago, and the 13.1 percentage point drop during that span ranks as the largest since the back half of February when bullish sentiment fell by more than 15 percentage points.
It is an even more pronounced drop from 50%+ reading that was put in place the week of July 20th.
Bearish sentiment picked up some of the difference this week, rising 4.6 percentage points to 30.1% and is the highest reading since the first week of June.
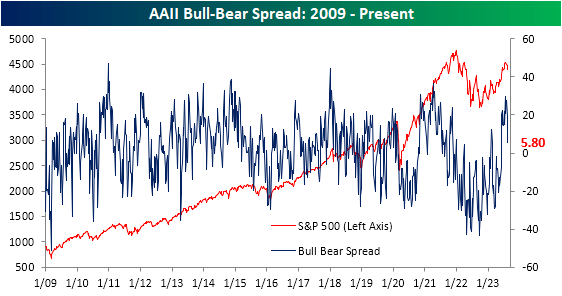
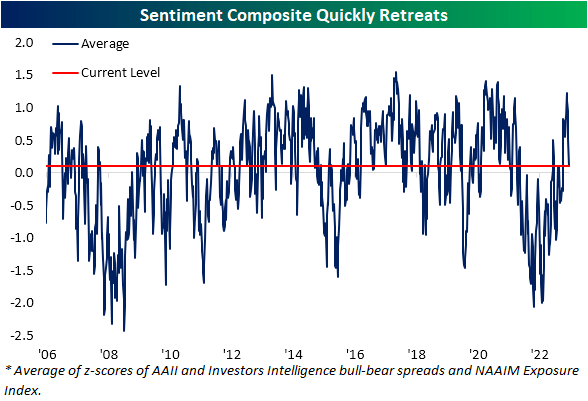
With inverse moves in bullish and bearish sentiment, the bull-bear spread has fallen sharply to 5.8 after ten consecutive weeks of double-digit positive readings (what had been the longest such streak in over two years, as shown in the second chart below).
In other words, sentiment continues to favor bulls, but by a much narrower margin than what has been seen in the past few months.
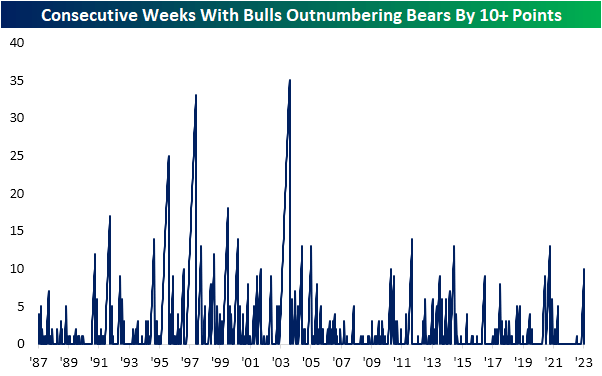
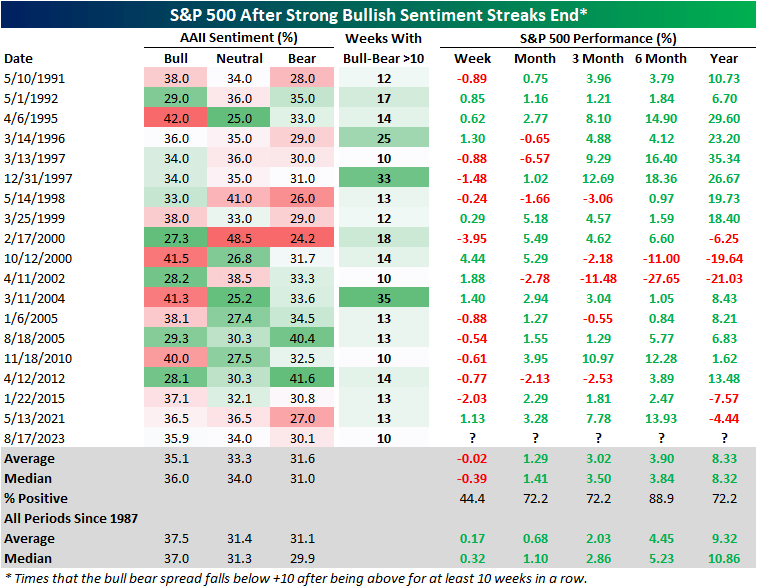
In the table below, we show every other instance in the AAII survey’s history in which streaks of at least ten weeks or more of bulls outnumbering bears by at least ten percentage points have come to an end.
As shown above and below, these sorts of streaks tend to happen every few years and typically when they end, bullish and bearish sentiment are not far off from their overall historical averages.
As for how the S&P 500 has tended to perform going forward, short-term performance has been weak, with an average decline one week later.
However, performance one month to one year out is much more consistently positive. That being said, average/median returns six months to one year out have been smaller than the norm.
Finally, we would note that the AAII survey was not the only sentiment indicator to have taken a bearish turn in recent weeks. Other weekly sentiment gauges like the Investors Intelligence survey of newsletter writers and the NAAIM Exposure Index have also turned lower.
In the case of the former, the percentage of respondents reporting as bullish is back below 50% for the first time since the end of May. The latter similarly shows active managers are the least exposed to equities since the end of May.
Combined with the AAII survey, our sentiment composite shows investors are only slightly more bullish than what has historically been normal.
Editor's Note: The summary bullets for this article were chosen by Seeking Alpha editors.
This article was written by

Recommended For You
Comments (1)
