NuVasive: 6.6% Spread With Globus Deal Still Not Enough

Summary
- NuVasive continues to push sideways in lieu of the FTC's decision on its prospective merger with Globus Medical.
- The deal spread between the offer and market price of both entities remains in situ.
- The firm's financial and economic characteristics aren't enough of a catalyst to get me over the line here.
- Net-net, reiterate hold.
naphtalina/iStock via Getty Images
Investment briefing
Much of the equity performance in NuVasive, Inc. (NASDAQ:NUVA)'s equity stock hinges on the outcome of its merger with Globus Medical (GMED). I covered this extensively in the last publication (see it here). Since then, the Federal Trade Commission ("FTC") has entered the party, and although fashionably late, it has put a pause on the duo's deal celebrations for now. I'll discuss the most recent developments here today, along with the company's latest numbers, and additional investment findings.
Net-net, the probabilities of the deal closing by Q3 this year-the planned timeframe by NUVA and GME-are looking slimmer, and this may or may not present an opportunity to arbitrage the merger spread. There does appear to be some value for those investors inclined to merger arbitrage strategies, but not this particular strategist. My investment cortex tells me to hold off on buying NUVA, a position I've maintained since my July 2022 publication. In that vein, I continue to rate NUVA a hold. But I'll be watching the outcome of the potential merger very closely, nonetheless.
Figure 1.
Data: Updata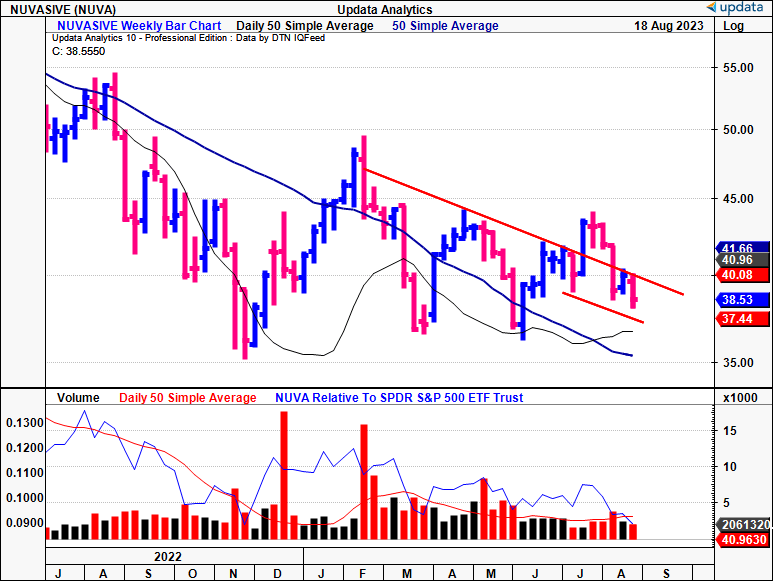
Latest NUVA developments
1. Q2 FY'23 insights
The company booked Q2 net sales of $317.8mm, marking a 2.4% rise on the report and a 3.1% bump excluding all Forex headwinds. The divisional breakdown is as follows:
- In Spinal, U.S. Spinal Hardware sales landed at $174.1mm, up 5.5% YoY. The U.S. Cervical division continued its upward bias with >20% growth, led by volumes of the simplified cervical disc and in Reliance Cervical.
- Offsetting this, U.S. surgical support was down 9.3% YoY and pulled to $65.1mm. The downsides stemmed from lower biologics attachment rates and changes in the payer mix at NuVasive Clinical Services ("NCS").
Figure 2. NUVA Q2 top-line disaggregation-revenue clip hurt by weakness in surgical support, offset by U.S. spinal numbers.
Sources: Author, Company filings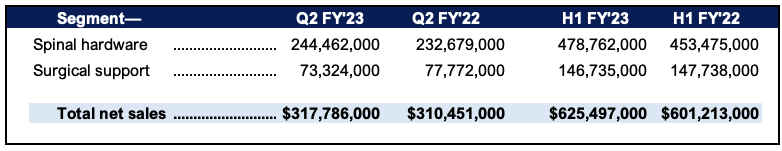
Critically, revenues have been flat on a sequential basis dating back to 2020 [Figure 3]. Despite the fault line in revenue clip, the pace of cash collections has slowed quite meaningfully in the same time. Figure 3 exemplifies the issue. Here the percent of operating cash flow backing revenues is shown as a function of the reported top line. Two things are immediately obvious:
- The degree of OCF behind revenues ("cash revenues") has fallen from highs of 25% to 11% last quarter, with two periods below 0%. There is an element of seasonality to this, along with inventory contributions. Nevertheless, the trend is lower on aggregate.
- The firm's average cash flows each quarter have tightened as well and this speaks to a tighter cash conversion cycle, where more cash it tied up in working capital, versus being freed up for additional growth initiatives.
Consequently, it's a challenge to foresee NUVA reinvesting heavily to pull additional growth levers it mentioned on the earnings call, including the launch of NuVasive Tube System and next-generation posterior expandable cage, MOD XPL in the T-lift division of spinal hardware.
Figure 3.
BIG Insights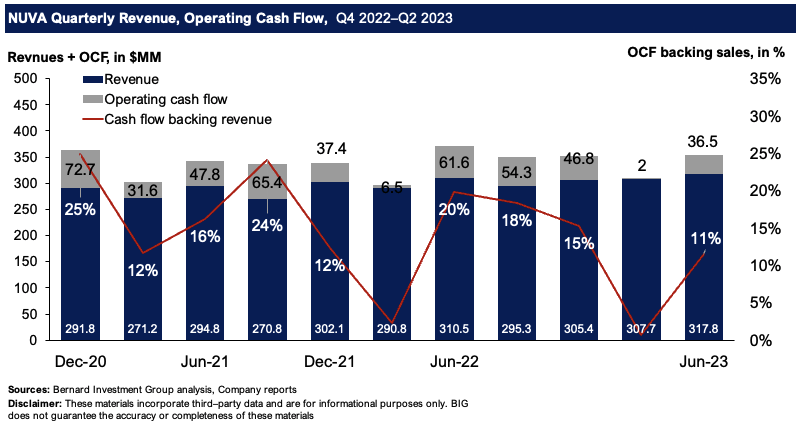
Moving down the P&L, the firm lost ~60bps of gross at the margin, clipping 71.8% for the quarter. This stemmed from the reduction in NCS sales mentioned earlier, ultimately compressing the contribution of the higher margin segment.
When scaling gross profit as a function of total asset growth, we get what's known as gross capital productivity. Figure 4 represents this for NUVA on a rolling TTM basis since Q4 2020. Here the rolling TTM gross profit is divided by the total asset base each quarter to illustrate the amount of gross produced on these assets each period. You can see that NUVA is leaning up on assets and now takes $2.09Bn to produce $228.3mm in gross last period. This translates to $0.42mm for every $1 invested in assets. Critically, this number has pushed up from $0.27 in 2020, and from $0.39 last year. This suggests the pullback in asset growth hasn't hurt the company's gross capital productivity.
Figure 4.
BIG Insights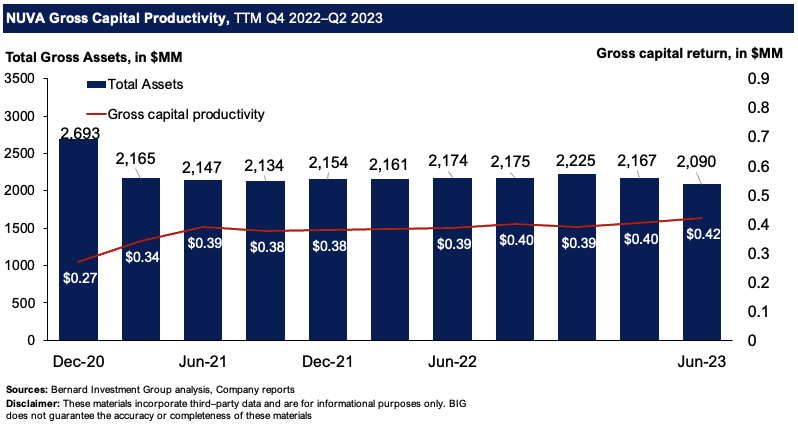
2. Recent developments on GMED merger
As a reminder, the pair agreed on an all-scrip merger worth $3Bn, where NUVA shareholders are to receive 3/4 of 1 share of GMED stock for every 1 share of NUVA stock they own. NUVA shareholders approved the deal in April.
But a month later in May, the FTC sent a 2nd request for more details on the deal, extending the waiting period under the HSR Act. In July, more reports surfaced noting the deal remains under the FTC's lens due to potential antitrust concerns. As noted by Seeking Alpha in July, the deal spread remains fairly wide. At the time, it had spiked to $3.31/share. It has since slipped back down to $2.57/share with weakness on GMED's end as I write, suspect to movements with daily machinations of the market. Closer inspection of the directional moves in each stock reveals both have tracked each other relatively closely as we've rolled through the year [Figure 5].
Figure 5.
Data: Updata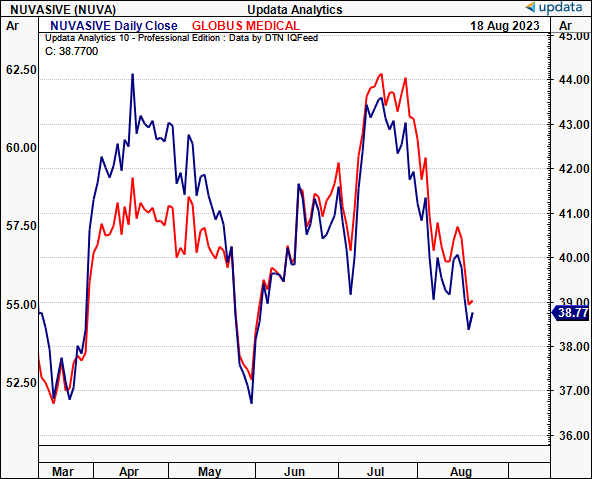
An analysis by Wells Fargo (WFC) also indicated that the merger's combination might undergo FTC scrutiny due to competitive concerns. The Herfindahl-Hirschman Index ("HHI")-a measure of market concentration and market competitiveness in M&A activity-reportedly increased around 250 points due to the merger. As the HHI increase intensifies, so does the likelihood of the FTC's competitive concerns. WFC opined this correlation to elevated regulatory scrutiny thanks to heightened competitive concerns as a result of the merger.
Figure 6.
BIG Insights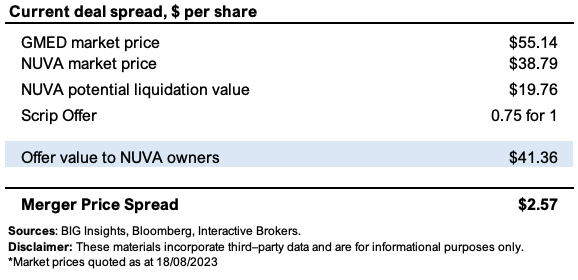
Figure 7.
BIG Insights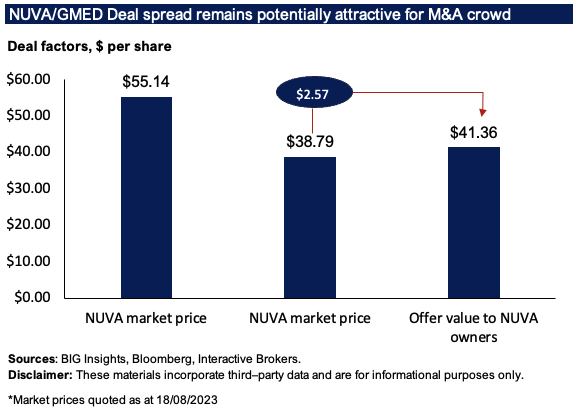
Sentiment
I'm looking at sentiment in NUVA's stock in two ways here, gauging the prospect of it catching a bid up to the merger value.
One, looking at the market-generated data, trend analysis isn't positive for a reversal in my opinion. The daily cloud chart shows the price line and lagging line below the cloud, having tested this level for ~2 weeks before breaking to the downside. A move to $40 and then $42 would be key psychological levels in order to see more positive sentiment in price action.
Figure 8.
Data: Updata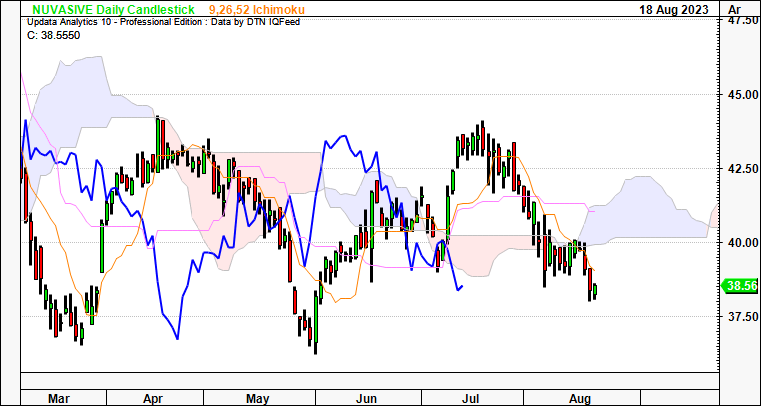
The latest price action could in fact see NUVA rally to the $51 mark if the below point and figure studies are correct. The thrust in earlier in the year was conducive to this. However, one cannot ignore the $30 downside target thrown off in late July. Given the price action above, there is confidence in this downside target in my opinion. This supports a neutral view on price action.
Figure 9.
Data: Updata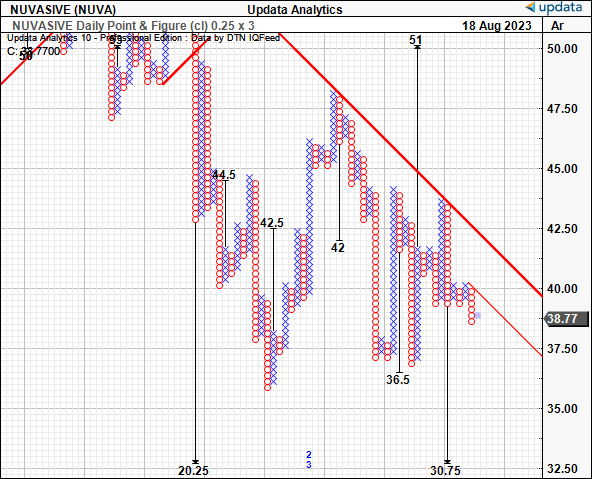
Two, options-generated data shows investors are bullishly positioned in the stock with heavy demand in September calls at a $50 strike depth. This shows actual capital at risk with investors speculating on a run to this level. There is some validity in using options data in forecasting. The M6 financial forecasting competition, held earlier in the year, is a quantitative modelling competition that challenges entrants to forecast market returns. It provides a money prize for the best performance and highest risk-adjusted returns. In a twist of events, Peter Cotton, Senior VP and Chief Data Scientist at Intech Investment Management LLC, completely trumped the competition of complex quantitative prediction models on its head, by using the implied volatilities of options markets to derive a superior set of outcomes, beating >97% of participants in doing so. The theory was, as Cotton says, that "Markets > models". Hence, the validity of using options data in gauging price visibility in the first place.
Valuation and conclusion
The stock still sells at ~17x forward earnings and 9x forward EBITDA. These are cheap in my view, but are they correctly so? Take a look at the value the market puts on NUVA's net asset value. It valued it at $2.26 in market value for every $1 in NAV as I write. This isn't so attractive in my opinion, given the potential liquidation values listed earlier. Hence, the dynamic really hinges on what GMED's stock price does, creating an investment conundrum given the pair's correlations. Is NUVA worth $41 the offer calculus spun off in Figure 6? Probably not, in my eyes. At 17x 2023 consensus earnings, you get to $37.57/share, a discount to where NUVA sells today. This confirms the neutral view here. I am also not one of the M&A arbitrage crowd, despite the potentially lucrative gains that can be made. In short, NUVA continues pacing along in lieu of the pending GMED deal, and there's no other major catalysts that I foresee in driving its stock price higher. Much of the deal's prospects hinges on what GMED does these next few months, that, and the outcome of the FTC's potential lawsuit against the pair. We will have to wait until further clarifications are obtained from this in order to build an informed opinion. In that vein, reiterate hold.
This article was written by

Analyst’s Disclosure: I/we have no stock, option or similar derivative position in any of the companies mentioned, and no plans to initiate any such positions within the next 72 hours. I wrote this article myself, and it expresses my own opinions. I am not receiving compensation for it (other than from Seeking Alpha). I have no business relationship with any company whose stock is mentioned in this article.
Seeking Alpha's Disclosure: Past performance is no guarantee of future results. No recommendation or advice is being given as to whether any investment is suitable for a particular investor. Any views or opinions expressed above may not reflect those of Seeking Alpha as a whole. Seeking Alpha is not a licensed securities dealer, broker or US investment adviser or investment bank. Our analysts are third party authors that include both professional investors and individual investors who may not be licensed or certified by any institute or regulatory body.