Cargojet Stopped Growing And Only Trades At 6.9x TTM P/E

Summary
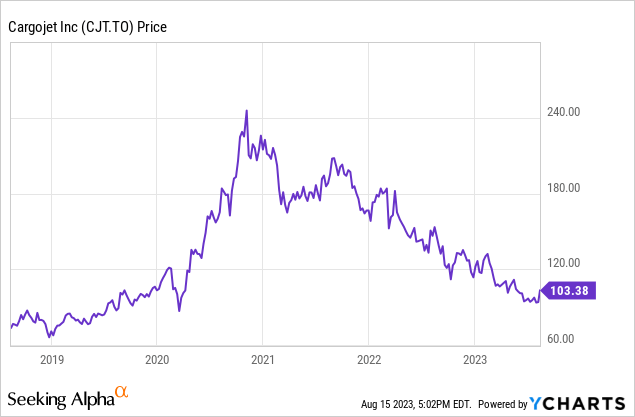
- Cargojet's stock price has dropped around 33% from its 52-week-high, bringing the company back to pre-COVID levels amid plateauing revenues.
- Investors are not paying for growth at only 6.9x TTM P/E but should take note of the profitability and financial structure of the company.
- Cargojet's profitability metrics are below desired levels, and its capital structure has seen increased debt and share issuance in order to grow, leaving interest coverage around only 2.0x.
Kyryl Gorlov/iStock via Getty Images
Cargojet (OTCPK:CGJTF)(TSX:CJT:CA) has become a Canadian success story in the growing on demand global delivery market over the past couple decades. The company thrived during COVID as competitor passenger carrier traffic, and its associated underbelly cargo room being sold to customers, dropped from the supply-side in the transport industry. Consumers still were at home with a lot of online shopping to do, so traffic for Cargojet held up nicely. These tailwinds helped drive Cargojet's stock price above $240 near the end of 2020. That market enthusiasm has faded, and the stock is now down around 33% from 52-week highs, bringing the company back to pre-COVID levels amid shrinking revenues YoY.
Quick Intro to the Company
Since being founded in 2001, Cargojet has become Canada's leading provider of time sensitive domestic network air cargo services. The company operates its business across North America transporting time sensitive air cargo each business night utilizing its fleet of all-cargo aircraft. The company’s co-load network strategy consolidates cargo received from various customers and transports such cargo to the appropriate destination in a timely and safe manner. The company prides itself on its customer relationships and ability to efficiently co-load planes with various customer orders in a regular route network.
The company’s revenues are generated from its domestic network air cargo service between 16 major Canadian cities each business night. In addition to their Canadian roots, the company operates an international route between Newark, New Jersey, USA and Hamilton, Bermuda. This provides a five-day per week air cargo service for multiple customers and is patterned after the domestic business that Cargojet has built in Canada. Customer contracts contain variable surcharges for uncontrollable costs (including ability to pass through increases in fuel costs) guaranteed volume minimums and CPI-based annual price increases.
Latest Results
Cargojet's latest results show the company continuing to have a tough time with diluted EPS of $1.68 down a whopping 82% compared to Q2 2022 and YTD diluted EPS of $3.35 down 43% (all financial values are in Canadian Dollars, unless stated otherwise). Revenues of $209.7 million in Q2 2023 were down 15% compared to $246.6 million in Q2 2022 causing year-to-date revenues of $441.6 million to now be down 8% compared to the prior year.
The decrease in total revenue was due primarily to a $7.2 million decrease in domestic network revenues, a $1.1 million decrease in all-in charter revenues and a $25.2 million decrease in fuel surcharge. The decrease in domestic network revenues was due primarily to a decrease in e-commerce and B2B volumes during the period, partially offset by contractual customers’ consumer price index increases.
Gross profits show an exaggeration of the decline, down 30% to $42.5 million for the quarter and 31% to $88.0 million for the year-to-date period. On the expense side, selling, general, and administration expenses for the six month YTD period went in the opposite direction, growing 15% to $33.3 million. All of this led to operating profits for the quarter and six-month period that were down 48% and 45% to $26.9 million and $53.7 million, respectively. The rise in interest rates and continued issuance of debt caused interest expenses to reach $13.5 million for the quarter, up 125% and 82% for the quarter and YTD period respectively.
Profitability & Growth at Cargojet
Cargojet's place in the airline cargo industry leave the company open to the same highly competitive and low-barrier to entry market of airlines in general. As can be seen below, Cargojet has only been able to achieve a return on equity of 5.4% and return on invested capital of 9.1% over the past five years. This level of profitability is below my rule of thumb of 15% ROE and 9% ROIC, giving me doubt if, in my opinion, the company will be able to maintain its intrinsic value over the next business cycle.
Profit and Growth Highlights at CargoJet (compiled by author from company financials)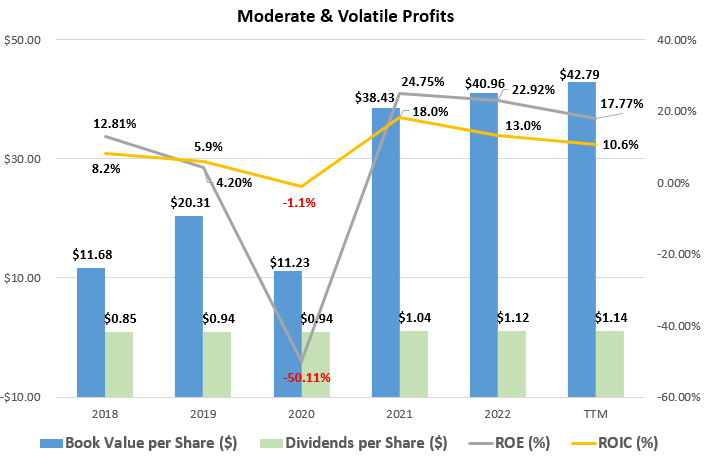
The lower ROE is driven by the 2020 negative earnings of $87.8 million due to a $157.1 million loss on derivatives during the irrational oil market early in COVID. It is normal operations for airlines to hedge their fuel costs and while COVID was an odd time for the industry, Cargojet also benefited from revenue upside in these hedges in 2021 and 2022 of $64.9 million and $85.6 million respectively. So including both the bad and goods years in the average profitability seems appropriate.
Cargojet had been growing revenues steadily prior to the past year at a CAGR of 17.5% since 2018, but they have also been issuing shares, as we will touch on more later. On a per share basis since 2018, revenue CAGR has been a more modest 6.9% as seen in the graph below along with cash flow from operations and capital expenditures over the past 5 years. While the mid-term growth rates look appealing, the peak in revenues over the past years makes me hesitant. Fortunately, at 6.9x TTM P/E investors are not really paying for that growth.
Per Share Financials at CargoJet (compiled by author from company financials)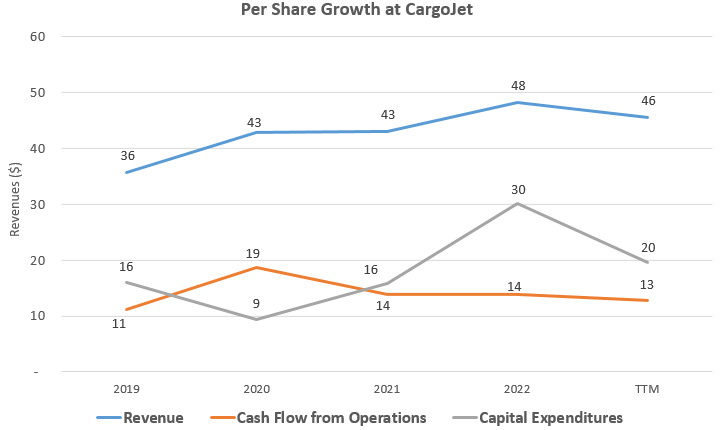
How About The Capital Structure?
Cargojet has added around $326 million (+80%) of debt in recent years while also issuing more share in the capital structure, as can be seen below. The interest coverage (including lease payments) of 2.03x the financial leverage is starting to look a little shaky for a cyclical company with low profitability. This 2.03x coverage leaves little room for any mid-term revenue weakness and further or prolonged higher interest rates.
Interest Coverage and Shares Outstanding (compiled by author from company financials)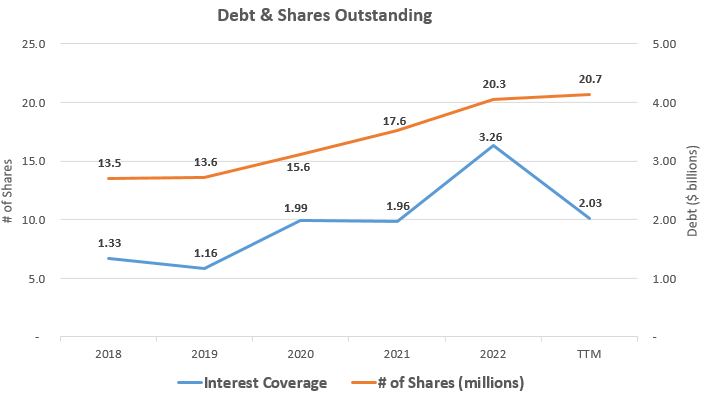
Also notable from the above graph is that Cargojet has been continually issuing shares every year, with the share count increasing a whopping 53% since 2018. The per share growth figures mentioned earlier still point to growth considering this dilution, I would like to see a company that is more profitable, or less aggressive, and able to finance their expansion internally.
To counter the high leverage, some might be quick to point to the client list and minimum volume contracts mentioned by management, where most customers pre-purchase a guaranteed space and weight allocation on the Company’s network and a corresponding guaranteed daily revenue amount is paid to Cargojet. While the company does benefit from some minimum level in these contracts, is still volatility in bad economic times and these contracts do rollover and are open to competitive pressure. The volatility of revenue is best-described from the company's own MD&A as seen below.
Although a significant portion of domestic network revenues are fixed due to guaranteed customer allocations, Cargojet’s revenues will generally rise and fall with the overall level of customer volume typically expressed in pounds. - Q2 2023 MD&A
Helping the liquidity situation, Cargojet also has a sizable amount of hybrid debt outstanding that is convertible to equity at a 5% discount at the option of the company. In a worse case economic environment scenario for Cargojet, the conversion of this debt to equity could be utilized to maintain liquidity, but would seriously dilute shareholders in the process.
Debt Outstanding at Q2 2023 (from company financial statements)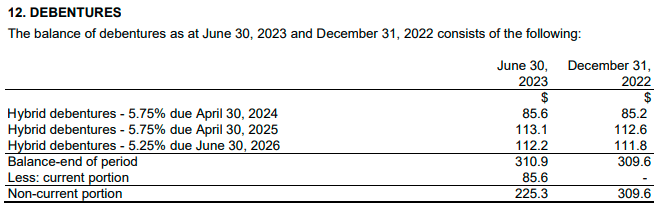
Takeaway For Investors
Cargojet's profitability metrics like ROE and ROIC are below my desired levels at 5.4% and 9.1% respectively, and its capital structure has seen increased debt and share issuance. The company operates in the highly competitive airline market with low barriers to entry and is also subject to economic cycles. The competitive pressures and economic cycles seem to be showing up now, with the peak in revenue over the past year at a time when the company has expanded quickly. Investors are not paying for growth at only 6.9x TTM P/E but should take caution of the financial and operating leverage of the company with a low cash flow profile.
Editor's Note: This article discusses one or more securities that do not trade on a major U.S. exchange. Please be aware of the risks associated with these stocks.
This article was written by

Analyst’s Disclosure: I/we have no stock, option or similar derivative position in any of the companies mentioned, and no plans to initiate any such positions within the next 72 hours. I wrote this article myself, and it expresses my own opinions. I am not receiving compensation for it (other than from Seeking Alpha). I have no business relationship with any company whose stock is mentioned in this article.
While the information and data presented in my articles are obtained from company documents and/or sources believed to be reliable, they have not been independently verified. The material is intended only as general information for your convenience, and should not in any way be construed as investment advice. I advise readers to conduct their own independent research to build their own independent opinions and/or consult a qualified investment advisor before making any investment decisions. I explicitly disclaim any liability that may arise from investment decisions you make based on my articles.
Seeking Alpha's Disclosure: Past performance is no guarantee of future results. No recommendation or advice is being given as to whether any investment is suitable for a particular investor. Any views or opinions expressed above may not reflect those of Seeking Alpha as a whole. Seeking Alpha is not a licensed securities dealer, broker or US investment adviser or investment bank. Our analysts are third party authors that include both professional investors and individual investors who may not be licensed or certified by any institute or regulatory body.