Retail Sales Jump Despite Cooling Inflation In Goods That Retailers Sell

Summary
- Retail sales, including at food services and drinking places, jumped 0.7% in July from June.
- The growth in retail sales came despite a sharp decline of inflation in the goods that retailers sell.
- The three-month moving average of retail sales rose 0.6% from the prior month and was up 2.3% year-over-year.
AlexSecret
Retail sales, including at food services and drinking places, jumped 0.7% in July from June, after the upwardly revised 0.3% increase in June, and the 0.7% increase in May. Compared to a year ago, retail sales rose 3.2%, seasonally adjusted. Not adjusted, retail sales were $703 billion in July.
The growth in retail sales came despite a sharp decline of inflation in the goods that retailers sell, such as motor vehicles, gasoline, electronics, etc., with some actual price declines. And it came despite the shift of spending from goods - which is what the retailers here sell - to services.
This growth in July from June was driven by the huge growth rates among the #2 and #3 largest categories of retailers:
- Non-store retailers (mostly ecommerce): + 1.9%
- Food services & drinking places: +1.4%.
Retail sales are not a measure of consumer spending. They're a measure of how well retailers are doing. We track consumer spending separately, which also includes services, which retailers don't sell, and it's adjusted for inflation.
The charts below show the three-month moving average to squash the artificial drama of the monthly ups and downs that can obscure the trends.
The three-month moving average of retail sales rose 0.6% from the prior month and was up 2.3% year-over-year:
Census Bureau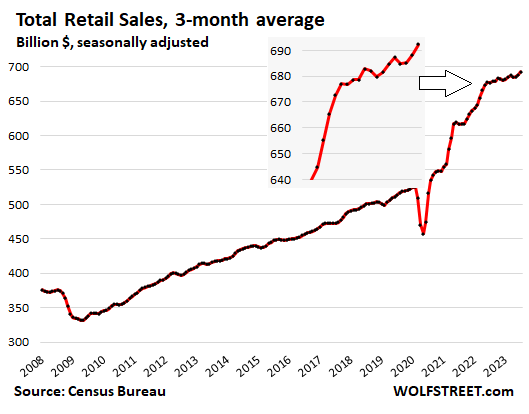
Retail sales by category, 3-month moving average, seasonally adjusted.
New and Used Vehicle and Parts Dealers (20% of total retail sales):
- Sales: $133 billion
- From prior month: +0.7%
- Year-over-year: +6.3%
Census Bureau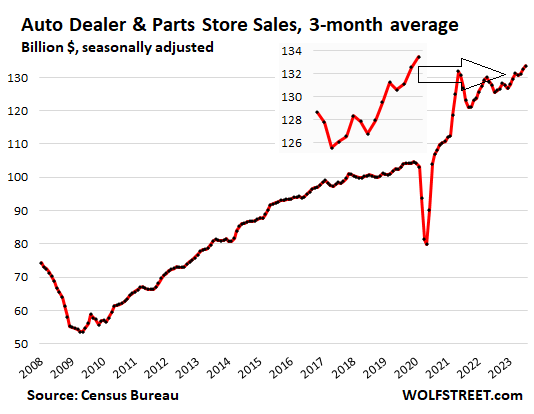
Ecommerce and other "non-store retailers" (17% of total retail sales), ecommerce retailers, ecommerce operations of brick-and-mortar retailers, and stalls and markets:
- Sales: $115 billion
- From prior month: +1.5%
- Year-over-year: +9.0%
Census Bureau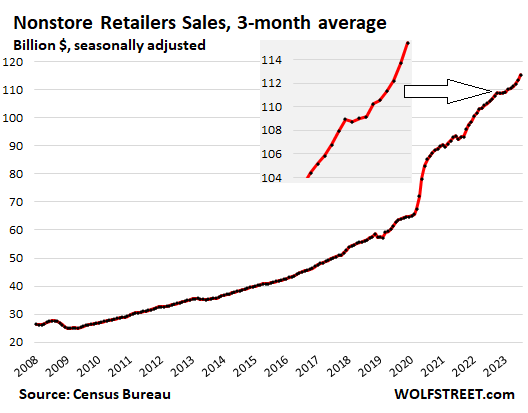
Food services and drinking places (13% of total retail), includes restaurants, cafeterias, bars, etc. Americans are spending more here ($90 billion in July) than at grocery & beverage stores ($82 billion, next chart down):
- Sales: $90 billion
- From prior month: +1.2%
- Year-over-year: +10.4%
Census Bureau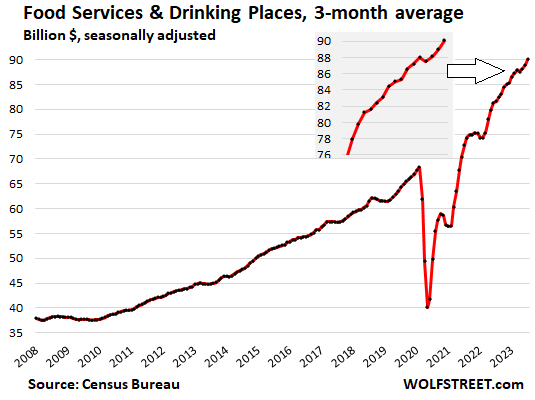
Food and Beverage Stores (12% of total retail). Sales leveled off as grocery prices leveled off at high levels in recent months:
- Sales: $82 billion
- From prior month: +0.2%
- Year-over-year: +2.2%
Census Bureau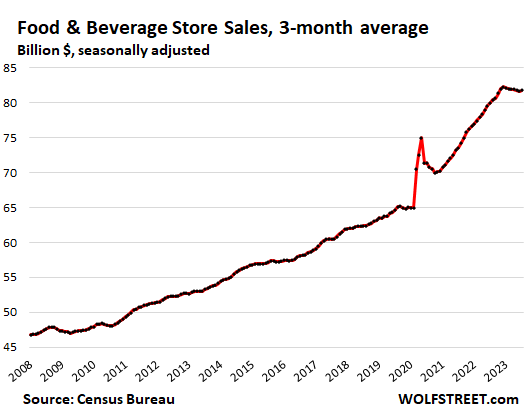
General merchandise stores, without department stores (9% of total retail):
- Sales: $62 billion
- From prior month: +0.5%
- Year-over-year: +2.8%
Census Bureau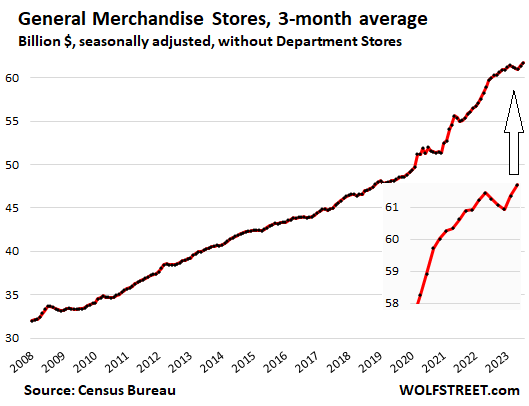
Gas stations (8% of retail):
- Sales: $52 billion
- From prior month: -1.3%
- Year-over-year: -21.7%
This chart shows the CPI for gasoline (green, right axis) and sales in billions of dollars at gas stations, including other merchandise that gas stations sell (red, left axis). Changes in sales are mostly driven by price changes, not because people drive more or less:
Census Bureau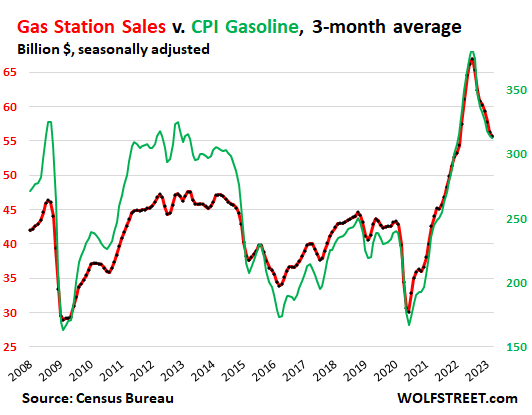
Building materials, garden supply and equipment stores (6% of total retail):
- Sales: $42 billion
- From prior month: +0.2%
- Year-over-year: -3.0%
Census Bureau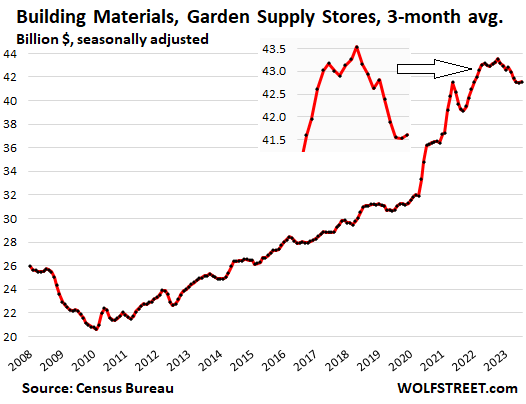
Clothing and accessory stores (3.7% of retail):
- Sales: $26 billion
- From prior month: +0.4%
- Year-over-year: +0.4%
Census Bureau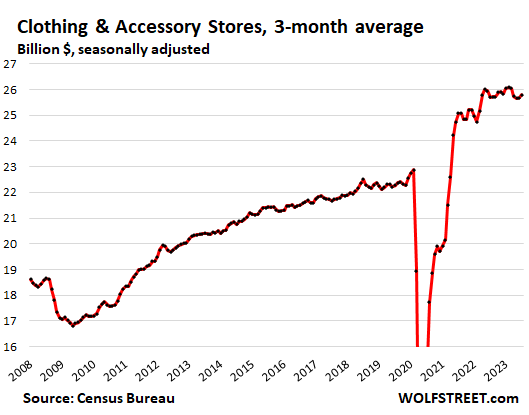
Miscellaneous store retailers, includes cannabis stores (2.2% of total retail): Specialty stores, from art-supply stores to wine-making supply stores.
- Sales: $15.5 billion
- Month over month: +0 %.
- Year-over-year: +2.3%
Census Bureau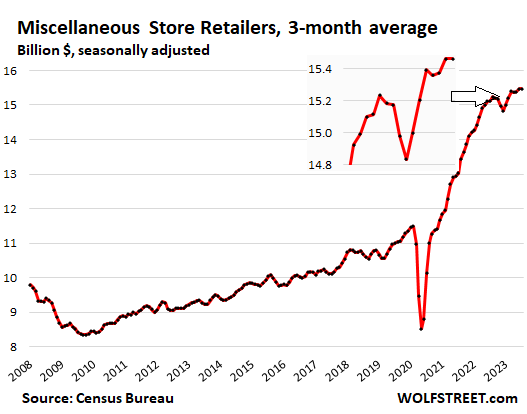
Furniture and home furnishing stores (1.6% of total retail):
- Sales: $11.1 billion
- From prior month: -0.4%
- Year-over-year: -6.2%
Census Bureau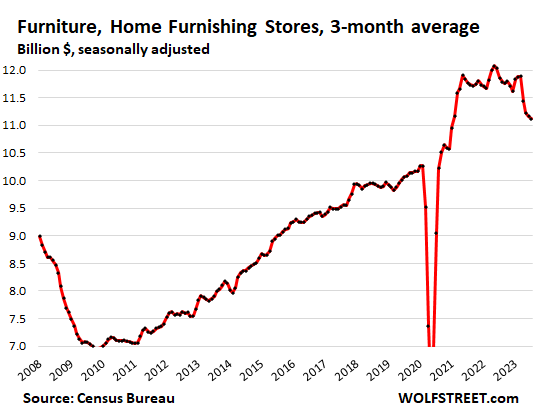
Department stores (1.6% of total retail sales, down from around 10% in the 1990s). Online sales by department store chains are included in the ecommerce retail sales chart above.
- Sales: $11.0 billion
- From prior month: -0.4%
- Year-over-year: -4.1%
- From peak in 2001: -40% despite 21 years of inflation.
Census Bureau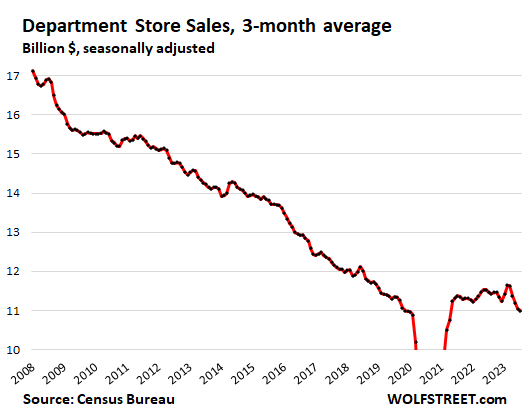
Sporting goods, hobby, book and music stores (1.2% of retail):
- Sales: $8.6 billion
- Month over month: +0.4%
- Year-over-year: +0.4%.
Census Bureau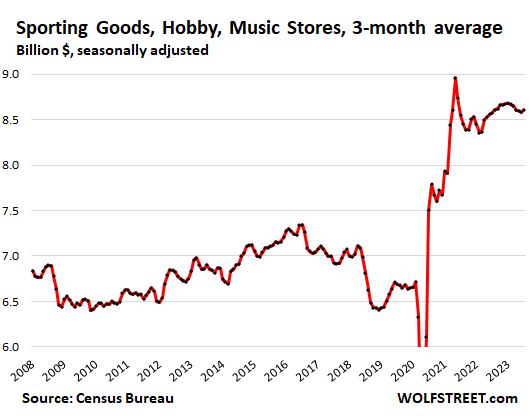
Editor's Note: The summary bullets for this article were chosen by Seeking Alpha editors.
This article was written by
