BOIL: Downgrading To A Hold On Heightened Roll Decay

Summary
- The ProShares Ultra Bloomberg Natural Gas ETF (BOIL) provides 2x leverage to front-month natural gas futures prices.
- Although fundamentals have developed as I expected with an extremely hot summer driving natural gas demand, the BOIL ETF has only eked out a small gain.
- This is because BOIL suffers from futures roll decay and volatility decay.
- Looking forward, we are entering a pronounced period of high futures roll decay, so I am downgrading BOIL to a hold.
marketlan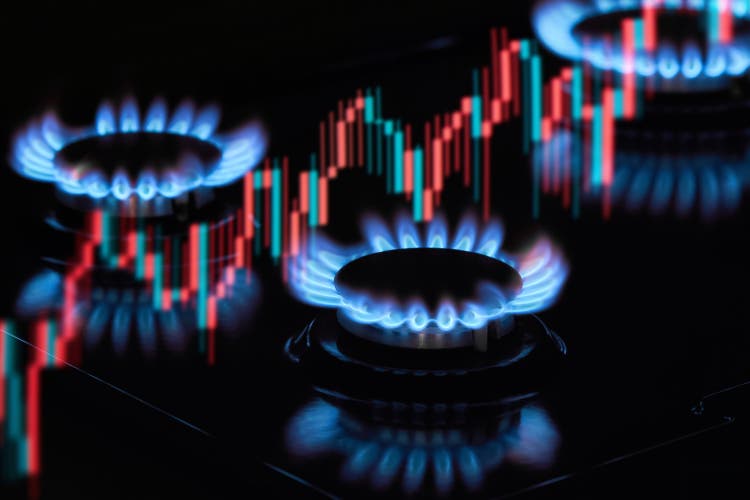
A few months ago, I wrote a bullish article on the ProShares Ultra Bloomberg Natural Gas ETF (NYSEARCA:BOIL). It was one of the rare times I would recommend the BOIL ETF as a buy, due the structural challenges of the fund.
I was expecting a very hot summer due to a developing El Niño, and believed that would translate into higher natural gas demand. So far, my fundamental thesis has proven to be correct, and the BOIL ETF has eked out a small gain (Figure 1).
Figure 1 - BOIL has delivered a small gain since my article (Seeking Alpha)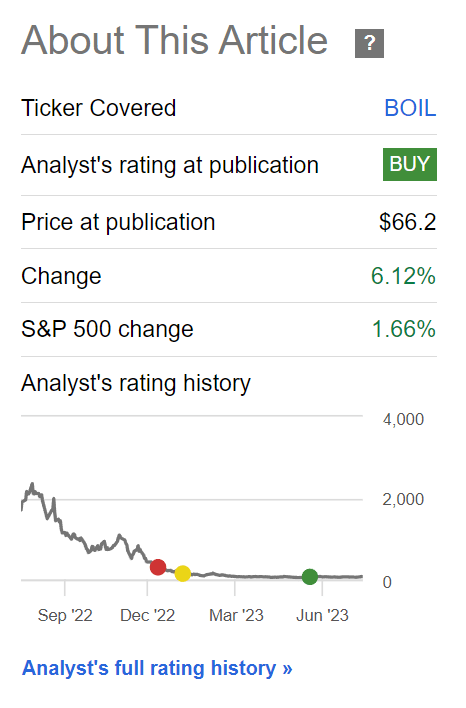
Given we are nearing the end of the timeframe I had posited in my article, do I still consider the BOIL ETF a buy at this time?
Brief Fund Overview
The ProShares Ultra Bloomberg Natural Gas ETF seeks to provide daily returns that are twice the return of the Bloomberg Natural Gas Subindex ("Index"), an index that reflects the daily performance of a rolling position in front-month natural gas futures. As the futures contracts near expiry, the index mechanically replaces expiring contracts with later expirations in a ‘futures roll’.
Figure 2 shows the current holdings of the BOIL ETF, which consists of futures positions and total return swaps struck with investment banks like Citigroup and Goldman Sachs.
Figure 2 - BOIL ETF holdings (proshares.com)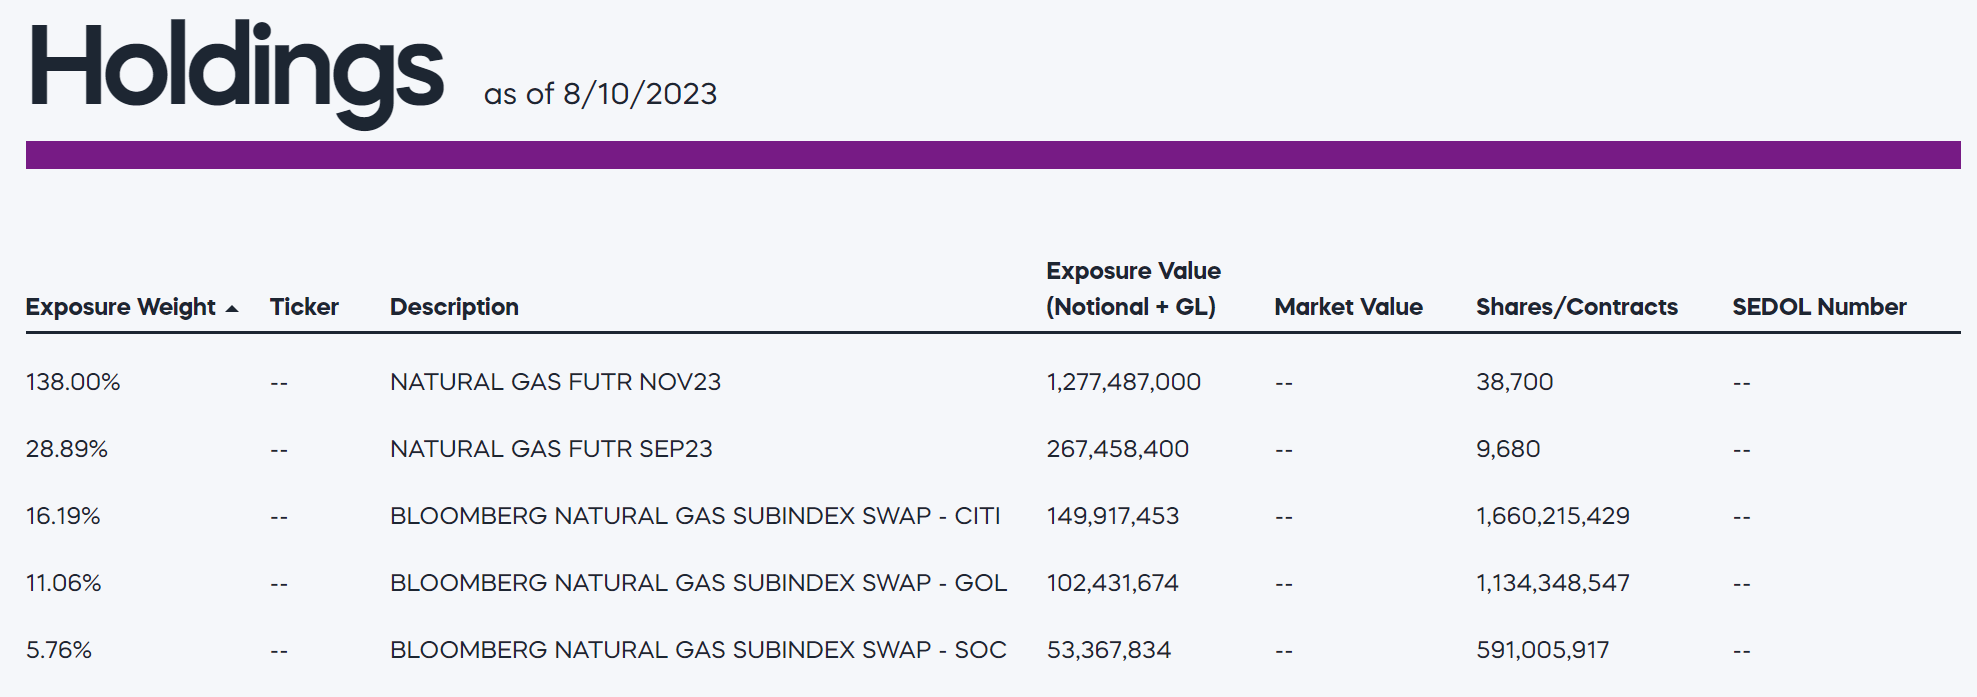
Fair warning, the BOIL ETF is not suitable for long-term investors. The main problem with the BOIL ETF (and other futures-based ETFs) is that future prices tend to be in contango, where prices farther out in maturity are more expensive.
Every time one of the near month natural gas futures expire, the BOIL ETF must mechanically sell the expiring future and buy a more expensive future contract as a replacement. This mechanical 'roll' process leads to the ETF suffering futures 'roll decay' over time.
To compound the issue, the BOIL ETF is leveraged, providing twice the daily exposure to natural gas futures prices. From one of my prior articles:
Levered ETFs have 'positive convexity' in the direction of their exposures. This means that one's exposure to a given underlying asset grows if the price action is in one's favour. For example, assume you invested $100 in BOIL. If the underlying index returns 5% on day 1, the position will grow to $110 (2 times 5% return). If the index returns 5% on day 2, the position will grow to $121. This is more than twice the theoretical 2-day compounded return of 10.25% or $120.50.
However, if the return experience is +5% followed by -5%, investors end up with $99.00, significantly less than twice the 2-day compounded loss of 0.25% or $99.50. This loss is due to 'volatility decay'. While 'volatility decay' may appear small on a 1-day basis, over the long-run, this can turn into very significant slippage, especially for a volatile underlying asset class like natural gas futures.
The combination of 'roll decay' and 'volatility decay' have caused the BOIL ETF to deliver exceptionally poor long term average annual returns of -55.0% since inception (Figure 3).
Figure 3 - BOIL ETF has delivered -55% long term average annual returns (Proshares.com)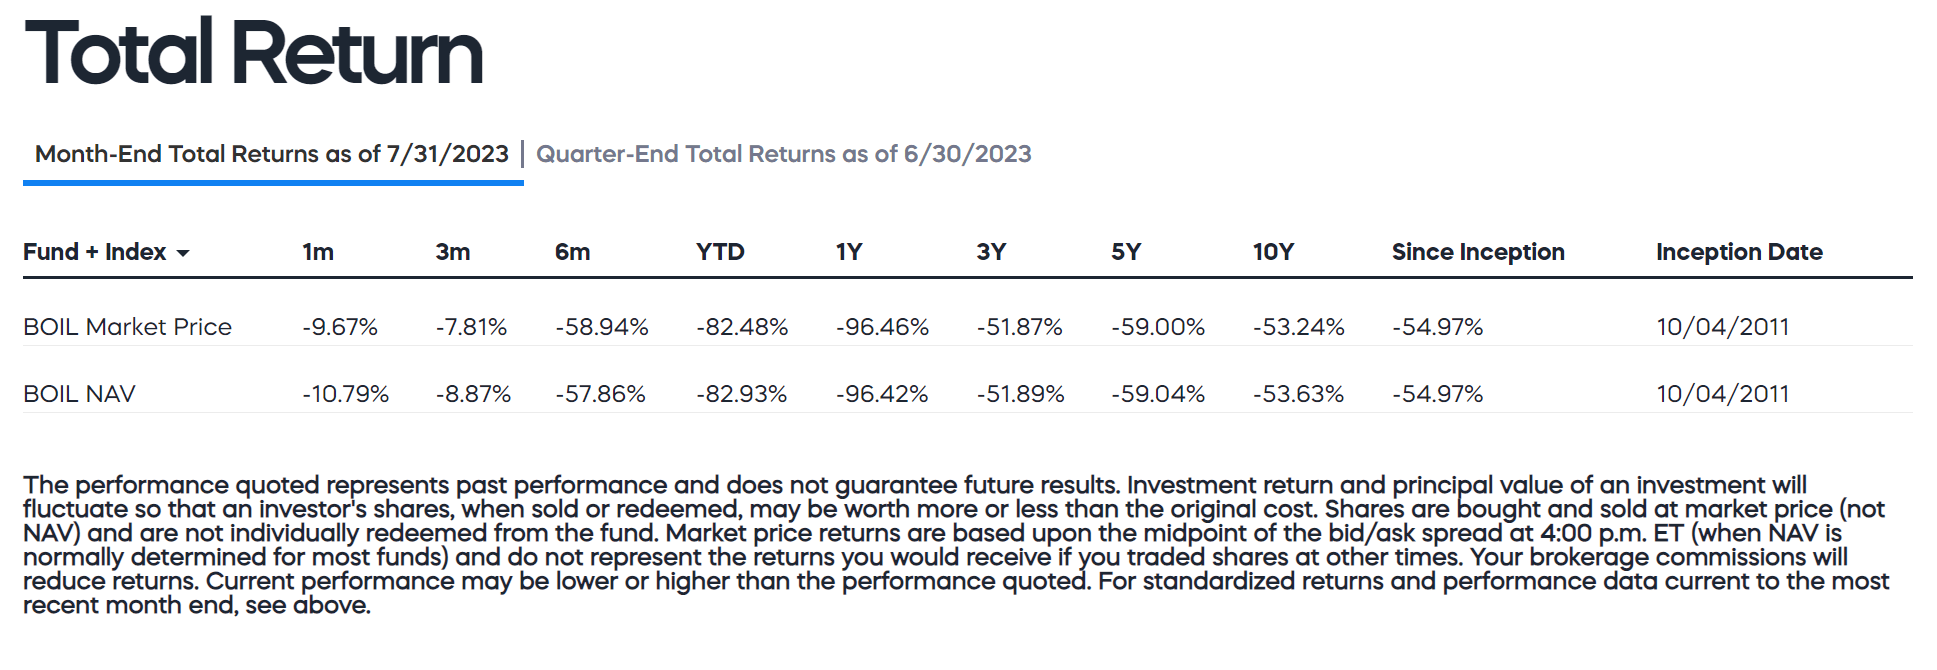
Record Breaking Temperatures Cause Large Gas Demand
As I commented on earlier, the primary reason I was bullish on the BOIL ETF for a short term trade was because I believed we were going to experience an exceptionally hot summer season driven by a developing El Niño. El Niño tends to cause hotter and dryer weather across the U.S. and Canada (Figure 4).
Figure 4 - El Nino tends to create hot and dry weather in North America (NOAA)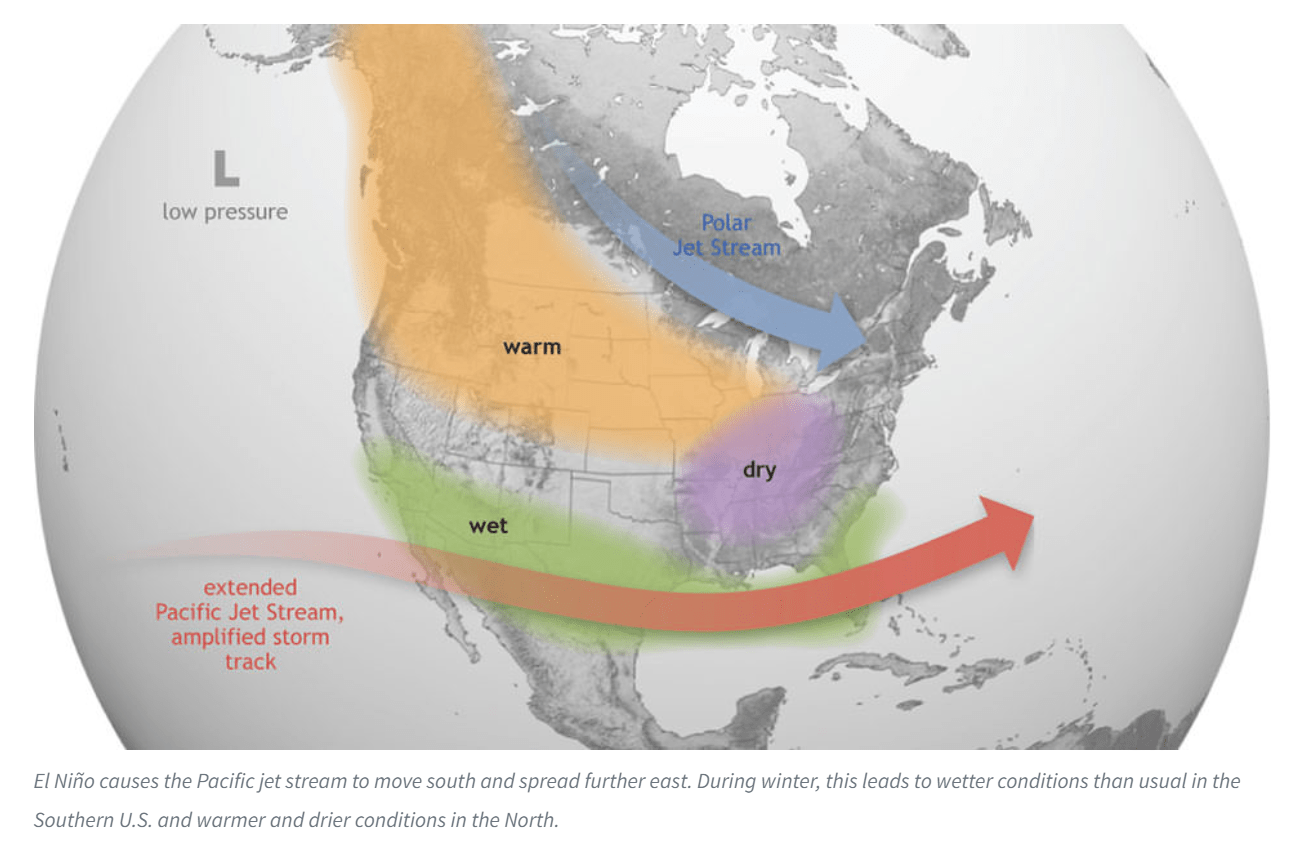
So far, July 2023 has been the 'hottest month ever recorded on Earth' with recordbreaking heatwaves across the U.S. causing El Paso, Texas, to record 38 days of temperatures above 100 degrees Fehrenheit and Phoenix, Arizona, to become the first major city to average 100 degrees for the entire month of July. Temperatures are so high that in parts of Arizona, people are being treated for burns from falling down on the hot pavement.
Due to the searing heat, electricity demand is soaring as air conditioning systems have to be constantly running. Since a large portion of electricity is produced from natural gas power plants, that translates into larger demand for natural gas. For example, according to the EIA, the Houston area saw 187 cooling degree days ("CDDs") in the week ended August 9th, 20 more CDDs than the prior week and 42 more than normal. In fact, many parts of the U.S. have seen higher than normal CDDs in the past few weeks (Figure 5).
Figure 5 - Many parts of US have seen high CDDs (EIA)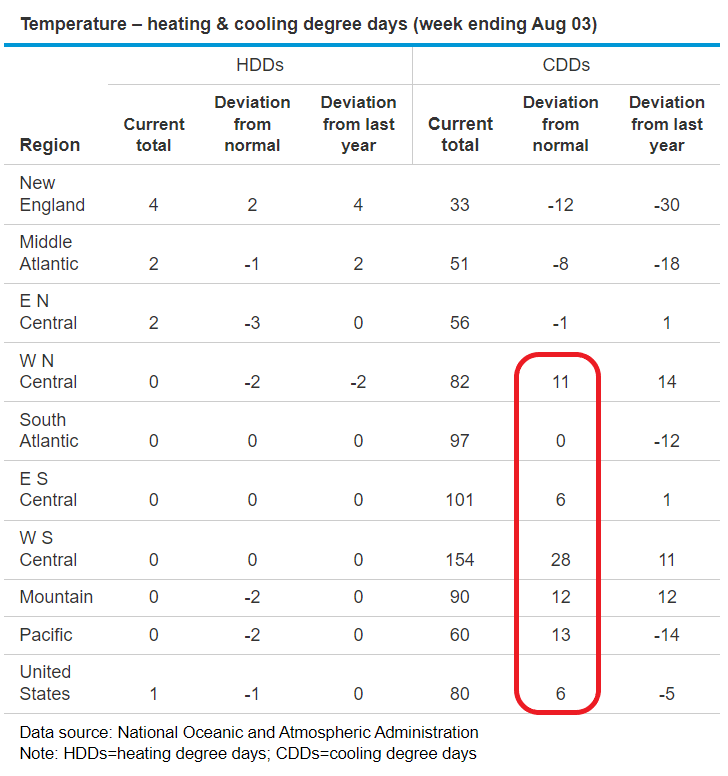
Inventories Well Stocked Due To Record Production
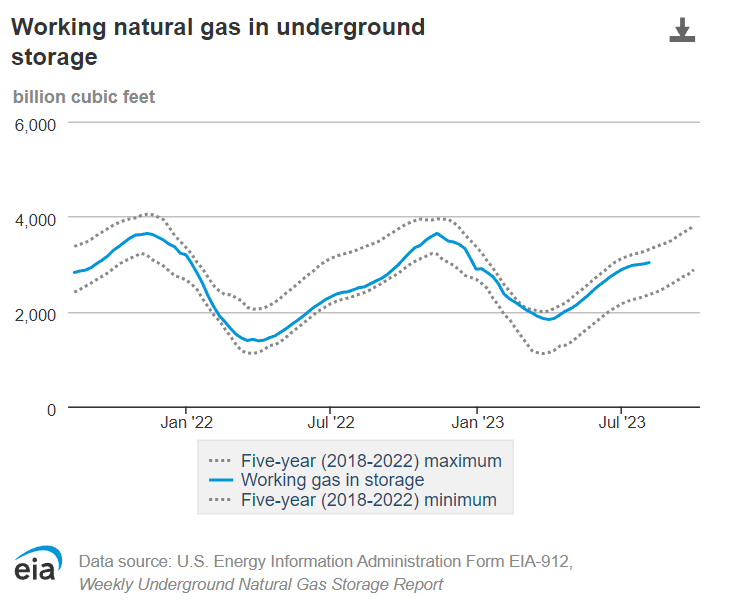
However, despite soaring demand for natural gas to power air conditioners, natural gas prices have been generally kept in check due to record natural gas production (Figure 6), leaving inventories well stocked for this time of year (Figure 7).
Figure 6 - U.S. shale dry gas production at a record (EIA) Figure 7 - Storage levels in-line with history despite record heat (EIA)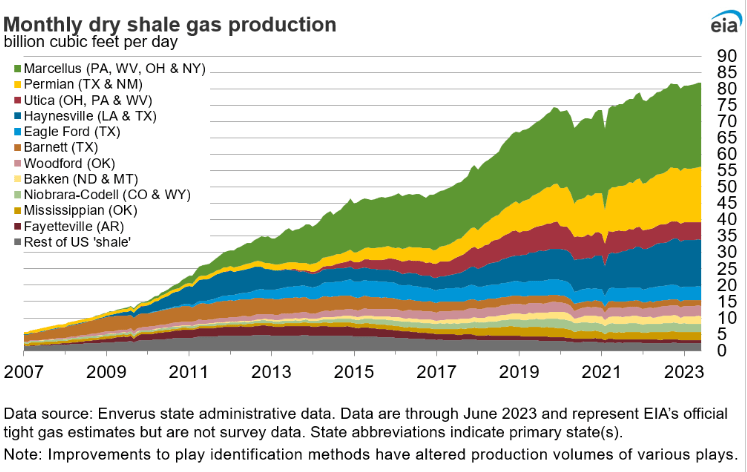
LNG Demand Continues To Boom
The other leg of my bullish natural gas thesis is the continued boom in natural gas demand to fuel the global liquified natural gas ("LNG") trade. Recall in 2022, the Russia / Ukraine war disrupted Russian natural gas supplies into Europe and Europeans turned to global supplies via seaborne LNG. This caused natural gas prices in North America to spike to over $10 / MMBtu and was the main driver of BOIL's amazing early 2022 performance.
As the Ukraine war drags on, U.S. exports of LNG will continue to increase, pending export capacity (Figure 8). This should provide a long-term tailwind to U.S. natural gas prices, and hence the BOIL ETF.
Figure 8 - Global LNG demand continues to boom (EIA)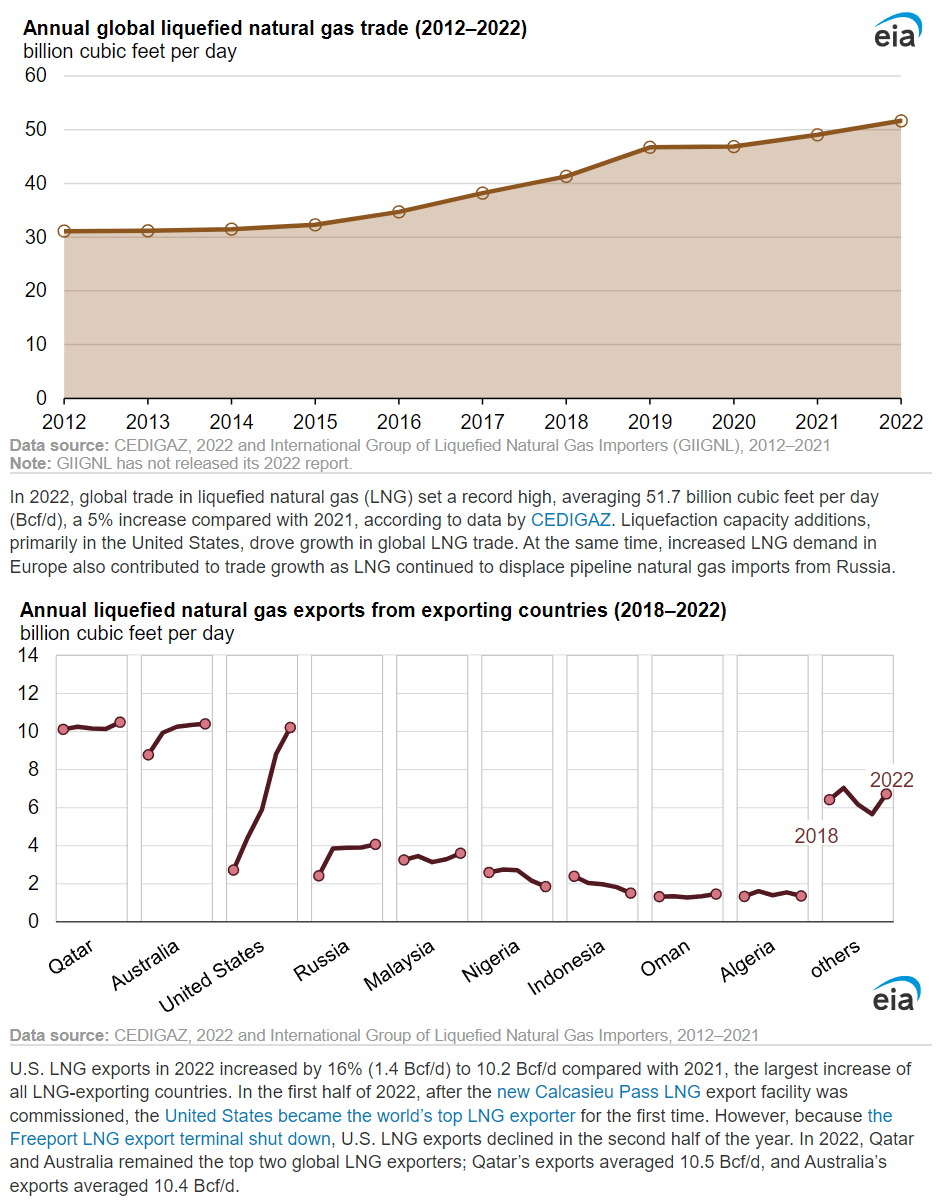
Australia LNG Strikes Pose Upside Risk To Gas Prices
One interesting wrinkle in the LNG story is that some Australian LNG workers are campaigning to go on strike for better pay and working conditions. Globally, Australia is a top 3 LNG export nation (Figure 8 above), and any supply disruptions out of Australia poses upside risks to natural gas prices.
In fact, news of the strike action on August 9th caused front-month Dutch TTF gas prices to surge by 40% and U.S. Henry Hub gas prices to soar by 6.6%. As the Australian LNG workers prepare to vote on the jobs action, natural gas market watchers will be anxiously waiting on the results.
If Australian LNG workers go on a prolonged strike, the world could see a scramble for spot LNG shipments, as many LNG contracts are long-term in nature and the Australian producers will have to replace striking shipments from the spot market to ensure delivery to their customers.
Seasonality In A Lull Till The Fall
Heading into September, natural gas speculators will be switching from betting on summer CDDs to winter heating degree days ("HDDs"). Typically, we see a July to September lull before strong, pronounced positive seasonality kicks in from September to November as traders bet on storage levels for the upcoming winter season (Figure 9).
Figure 9 - Natural gas seasonality (Equityclock.com)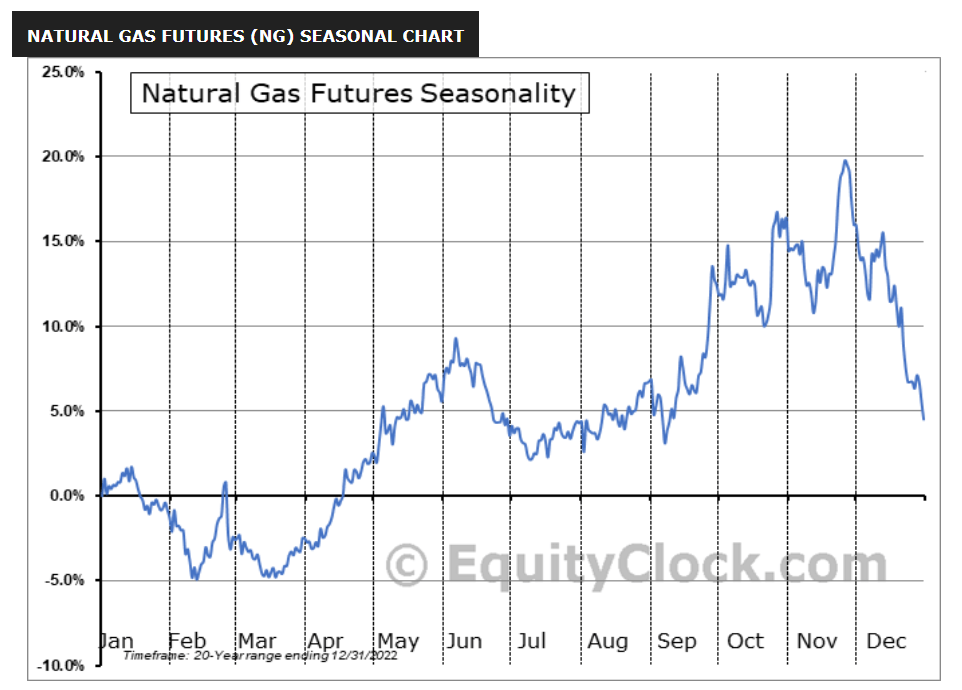
Risks To BOIL
While the bullish case for natural gas remains compelling, the risks are also large for the BOIL ETF. As I noted earlier, despite fundamentals developing pretty much as I expected, spot natural gas prices have only increased ~15-20% from mid-June, and the BOIL ETF has underperformed spot natural gas prices (Figure 10).
Figure 10 - Spot natural gas prices have increased ~15-20% since mid-June (stockcharts.com)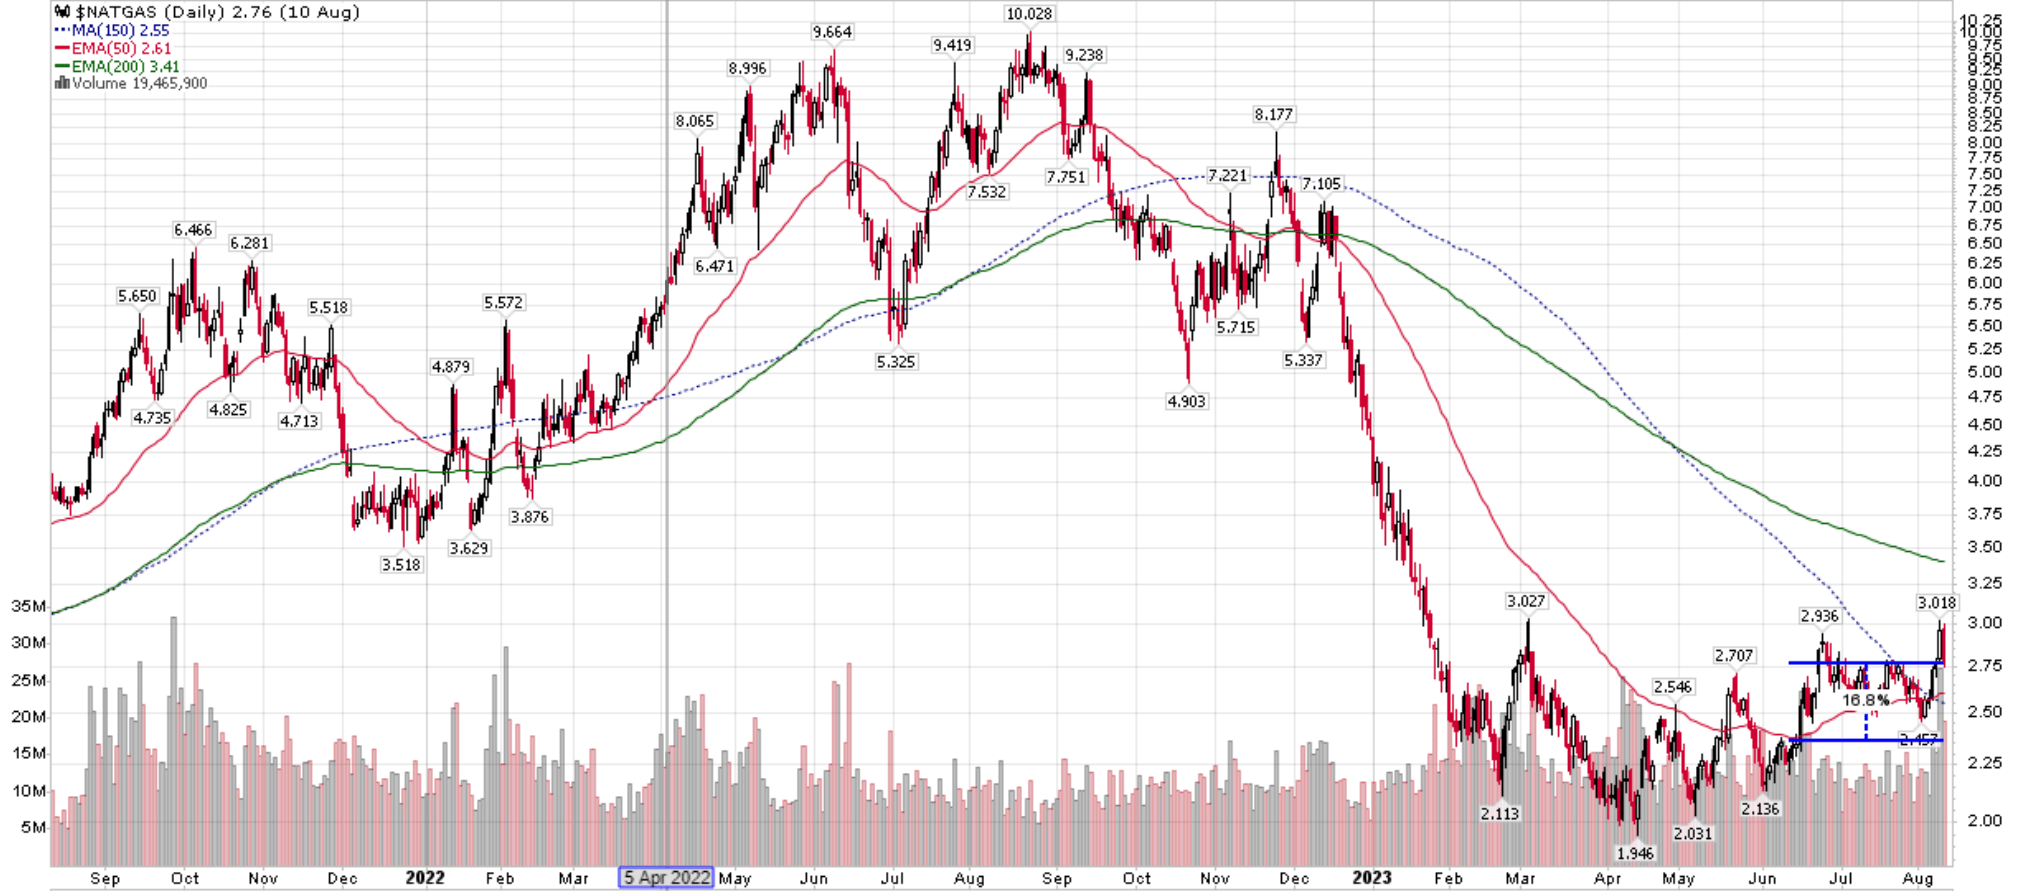
This is because of the futures roll decay and volatility decay I have mentioned above.
Looking forward, the futures spread between September/October futures contracts and November futures is large, at 15-20% respectively (Figure 11). As the BOIL ETF is currently rolling from near month September to November futures (see Figure 2), it is experiencing large roll decays.
Figure 11 - Natural gas futures prices (CME)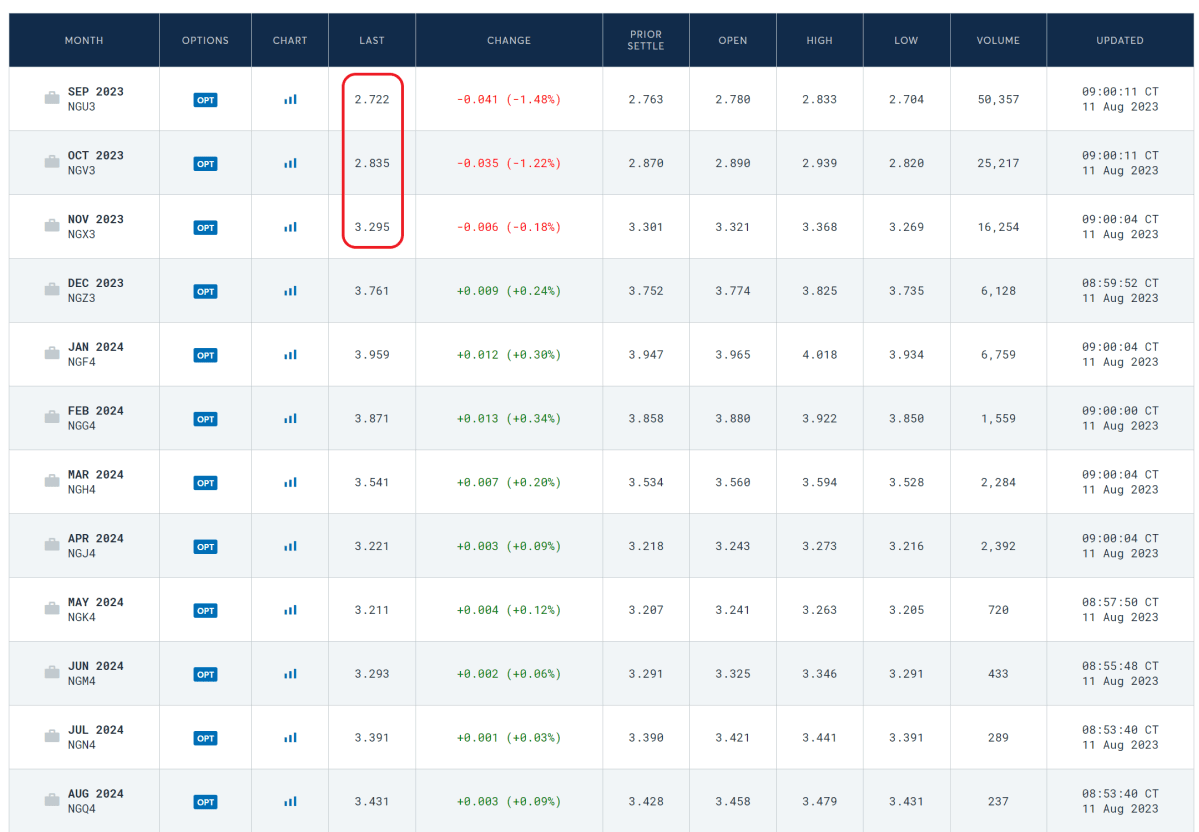
The contango does not get better, as November also has a large spread to December, and December has a large spread to January. So natural gas prices need to spike along the whole curve in order for the BOIL ETF to overcome the large roll decay.
Conclusion
While the fundamentals remain supportive of spot natural gas prices, I believe the current period of heightened 'roll decay' will be detrimental to BOIL's performance, and so I am downgrading the BOIL ETF to a hold. Adventurous speculators who expect a spike in natural gas prices may find the fundamentals more attractive than the technical decay and buy the BOIL.
This article was written by

Analyst’s Disclosure: I/we have no stock, option or similar derivative position in any of the companies mentioned, and no plans to initiate any such positions within the next 72 hours. I wrote this article myself, and it expresses my own opinions. I am not receiving compensation for it (other than from Seeking Alpha). I have no business relationship with any company whose stock is mentioned in this article.
Seeking Alpha's Disclosure: Past performance is no guarantee of future results. No recommendation or advice is being given as to whether any investment is suitable for a particular investor. Any views or opinions expressed above may not reflect those of Seeking Alpha as a whole. Seeking Alpha is not a licensed securities dealer, broker or US investment adviser or investment bank. Our analysts are third party authors that include both professional investors and individual investors who may not be licensed or certified by any institute or regulatory body.