CVS is transitioning its stores to offer on-site basic medical care and is back near its 2019 low valuation levels.
Recent acquisitions have underwhelmed the market, but we expect CVS to focus on consolidation, integration, and organic growth.
Our technical analysis of CVS meshes well with the fundamental backdrop and is pointing higher.
Looking for a helping hand in the market? Members of Stock Waves get exclusive ideas and guidance to navigate any climate. Learn More »
By Levi Produced with Avi Gilburt
CVS appears to be in a position where its fundamentals are aligning with the technicals to provide us with a higher probability pick. Let’s look at that fundamental snapshot as well as what we would need to see to further confirm that a major low has indeed been struck.
The Fundamentals
Lyn Alden regularly provides our members with deep dives into the fundamentals of dozens of companies. See below an excerpt from her recent report on CVS:
“CVS is a health insurer, pharmacy benefit manager, and retail pharmacy/convenience/healthcare center combined. Over time, CVS is transitioning more of its square footage in its stores to on-site basic medical care.
However, the stock is now back near its 2019 low valuation levels, with signs of a momentum shift. It’s definitely one to watch.
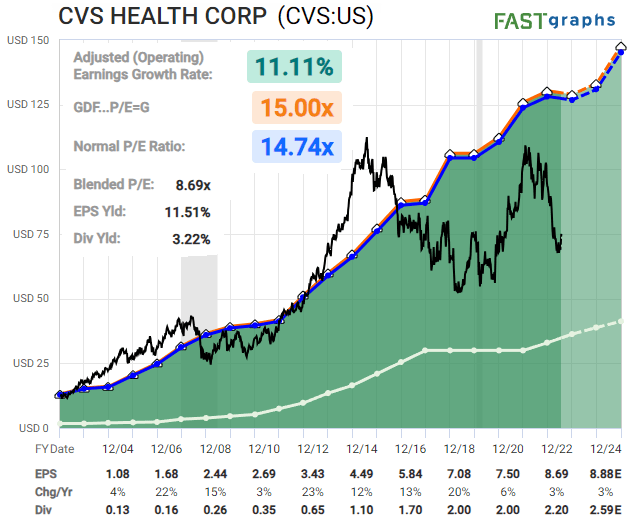
FastGraphs
It’s a funny analysis if you compare this CVS FASTGraph to the Apple (AAPL) FASTGraph near the beginning of this report. Both stocks have had stagnant fundamentals for two years (orange/blue lines going sideways), and during that time, Apple’s stock price surged higher while CVS’s dropped hard. Apple is trading at nearly 4x as high of a price/earnings ratio as CVS at the moment. Now, I do think Apple should have a higher earnings multiple, maybe even twice as high, but four seems excessive and the power of sentiment on these stocks has been impressive.
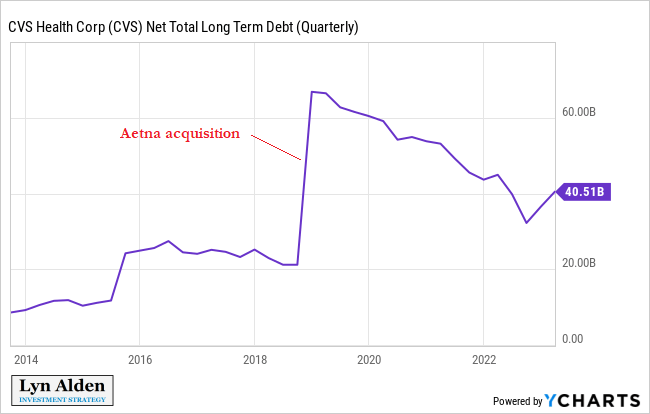
Ever since its Aetna acquisition, CVS had been in a period of financial consolidation and simplification, focused on debt reduction, share buybacks, and resumed dividend growth. This changed a bit over the past year when they acquired Signify Health and Oak Street Health for a combined price of over $18 billion. This has been in contrast to the prior period of debt reduction and share buybacks to make a leaner structure, and the acquisitions were not cheaply priced.
YCharts
In my view, the market has been underwhelmed by these recent acquisitions, and so I think the correction in price was partly warranted. CVS already has a lot of complexity in their business, and so directing cash flow toward organic growth, dividends, share repurchases, and debt reduction would be the simpler path going forward than adding yet more external businesses under their already enormous umbrella. In addition, the pharmacy benefits business has been facing some regulatory scrutiny as of late.
However, I expect the company to once again move back to a strategy of consolidation, integration, and organic growth, now that these additional moving parts have been added, and thus I like the risk/reward ratio of CVS within the context of a diversified portfolio.”
This is a compelling base on which to build our premise. So, what do we need to see from the price on the chart to further cement this?
The Technical Viewpoint
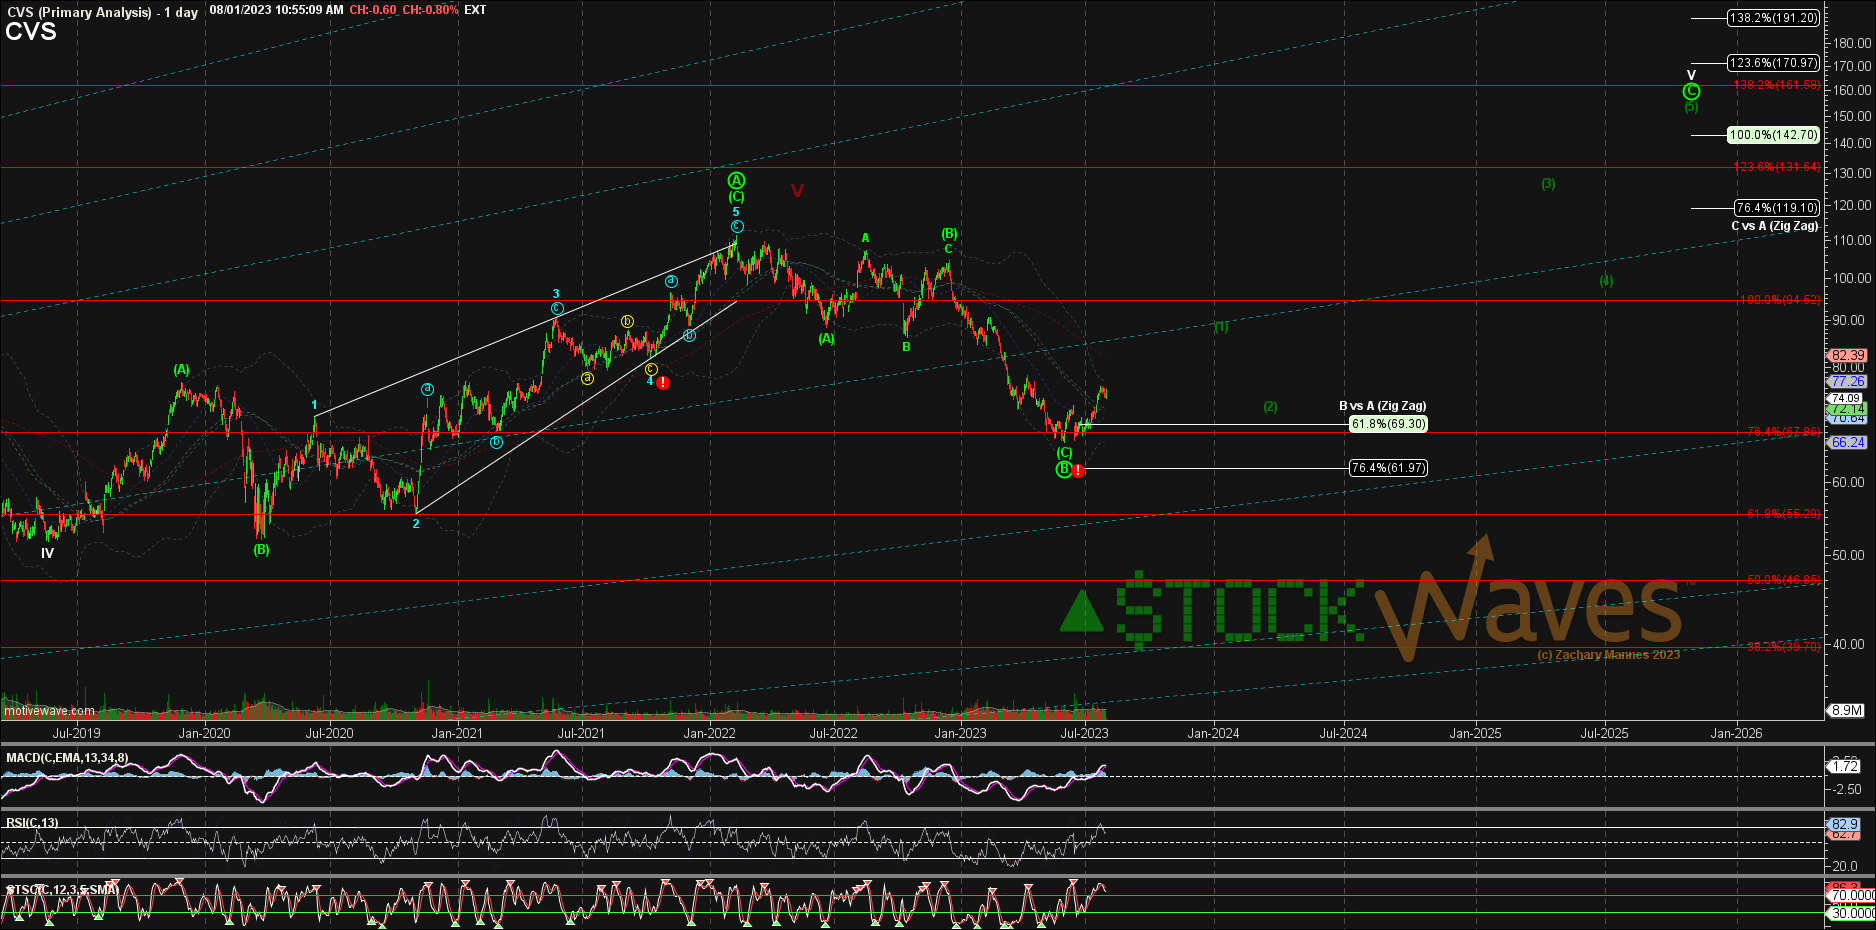
The highest probability setup for a longer term position in CVS will be once the [1]-[2] completes as illustrated on the chart. It’s likely that the wave [2] pullback will come back to this current area of price.
by Zac Mannes - StockWaves / MotiveWave
Some investors/traders choose to take a long position while wave [1] is yet underway. Others will opt for their long entry once it appears that wave [2] is completing. That’s up to each person’s risk vs reward point of view and their own style.
Regardless of style, we can discuss what appears to be the probable path forward and what we would prefer to see to further confirm that a major low is indeed in place.
To begin, we must understand where we find ourselves in the bigger picture. Why is this so important? Because it's the context of this bigger point of view that tells us what the structure of the following wave should be. In this case, since we have just completed a [C] wave of a larger Primary B wave, the next leg up should be Primary C of an even bigger Cycle ‘V’ and be in 5 waves.
That’s the upper altitude view. Nearer to the ground, we're anticipating wave [1] to complete in the $86-$90 level with the wave [2] to follow. Typically, a 2nd wave will retrace anywhere from 38% to 62% of wave 1. Why do we say this? Thousands upon thousands of charts over many years have provided us with a plethora of examples.
Risk: Should price instead move below $62, we would reassess the near term bullish expectations.
Why Must We Eat All Of This Alphabet Soup?
Well, you don’t actually have to eat it. But, it’s rather basic once you figure out the letters and nomenclature. It's this styling of naming the waves that tells us where we find ourselves at any given moment in time.
As well, the markets display self-similarity at all degrees. This means that their structures are fractal in nature and will repeat from the smaller scale to the larger scale. It's this very feature that gives Elliott Wave theory, when correctly applied, its power. We are observing human crowd behavior unfold before our very eyes.
We have an extensive Education library available at Elliott Wave Trader. As well, we want to teach others this methodology. Three times a week we have beginner and intermediate level videos where we show the exact way we count the waves and give in-depth analysis techniques. This methodology, if you give it the chance, will change the way you invest forever. More on that can be found here.
There are many ways to analyze and track stocks and the market they form. Some are more consistent than others. For us, this method has proved the most reliable and keeps us on the right side of the trade much more often than not. Nothing is perfect in this world, but for those looking to open their eyes to a new universe of trading and investing, why not consider studying this further? It may just be one of the most illuminating projects you undertake.
(Housekeeping Matters)
If you would like notifications as to when our new articles are published, please hit the button at the bottom of the page to "Follow" us.
Lemon_tm
STOCK WAVES: Where fundamental analysis meets technical analysis for highest-probability investment opportunities!
"Thus far, the best stock-picking service I've seen--and I've been doing this for 35+ years! (Gunfighter)
"Stock Waves has produced more gains in the past month(+) than many sites do in years or decades." (Keto)
"The amount of trades I've been able to take resulting in 100%+ returns is nothing short of amazing. If you do not have Stockwaves, you are only doing yourself a disservice." (dgriff617)
High-probability investing where fundamentals and technicals align
Stock Waves highlights the highest-probability investment opportunities where technicals and fundamentals align.
Over the years, as a service at ElliottWaveTrader.net, Stock Waves has been guiding members with analysis of individual stocks with the expertise of three industry-leading technical analysts.
In January 2020, Stock Waves rolled out a service within Seeking Alpha’s Marketplace. In addition to our team of Zac Mannes, Garrett Patten, and Harry Dunn, we added Lyn Alden Schwartzer as a Stock Waves analyst to provide her fundamental analysis on individual stock opportunities we see in the coming years.
When it comes to fundamental analysis, Lyn's deep dives on individual stocks are second to none. Blending a background in engineering and finance, Lyn digs for value with a dispassionate, scientific approach that has been uncannily accurate in forecasting stock moves and trends.
Meanwhile, Zac, Garrett and Harry have for years applied a winning strategy developed by renowned Elliottician Avi Gilburt. This method of prognosticating movement in markets and stocks based on wave counts has resulted in consistent returns of over 65% in their earnings calls alone!
Having been providing our services to thousands of our members and hundreds of money manager clients at ElliottWaveTrader, we are excited to be able to bring this higher level of analysis of individual stocks to the Seeking Alpha audience as well.
Analyst’s Disclosure:I/we have no stock, option or similar derivative position in any of the companies mentioned, and no plans to initiate any such positions within the next 72 hours. I wrote this article myself, and it expresses my own opinions. I am not receiving compensation for it. I have no business relationship with any company whose stock is mentioned in this article.
Seeking Alpha's Disclosure: Past performance is no guarantee of future results. No recommendation or advice is being given as to whether any investment is suitable for a particular investor. Any views or opinions expressed above may not reflect those of Seeking Alpha as a whole. Seeking Alpha is not a licensed securities dealer, broker or US investment adviser or investment bank. Our analysts are third party authors that include both professional investors and individual investors who may not be licensed or certified by any institute or regulatory body.
Recommended For You
Comments
Disagree with this article? Submit your own. To report a factual error in this article, . Your feedback matters to us!
To ensure this doesn�’t happen in the future, please enable Javascript and cookies in your browser.