S&P 500: No Surprises - Week Starting 7th August (Technical Analysis)

Summary
- A pullback in the S&P 500 was expected for technical reasons and the Fitch downgrade provided the catalyst.
- The narrative has quickly shifted bearish, but this should provide an opportunity to buy for a recovery.
- When and where to buy this dip, and what to expect from a rally.
cemagraphics
The S&P 500 (SPY) fell to a low of 4474 this week after Fitch downgraded the US credit rating. While this was a surprise catalyst, the pullback was no surprise at all and met the expectations set out in last week's article, and indeed the week before, which called for "the largest pullback since early May."
Next week's focus is when and where to buy this dip, and what to expect if there is a recovery. Can the S&P500 resume its rally directly to new highs?
To answer these questions, a variety of tried and tested technical analysis techniques will be applied to the S&P 500 in multiple timeframes. The aim is to provide an actionable guide with directional bias, important levels, and expectations for price action. The evidence will then be compiled and used to make a call for the week(s) ahead.
S&P 500 Monthly
Despite all the bearish noise over recent weeks, the monthly chart once again provides a useful bullish bias. The strong close of the July monthly bar created a 'weak' high which should be exceeded before any significant correction develops. At some point in August (perhaps September), we can look for 4607 to be exceeded.
The situation is almost a replica of the end of June / start of July: the June bar closed at the highs and was followed by an early dip in July which then reversed higher and continued to new highs by the 12th of the month.
SPX Monthly (Tradingview)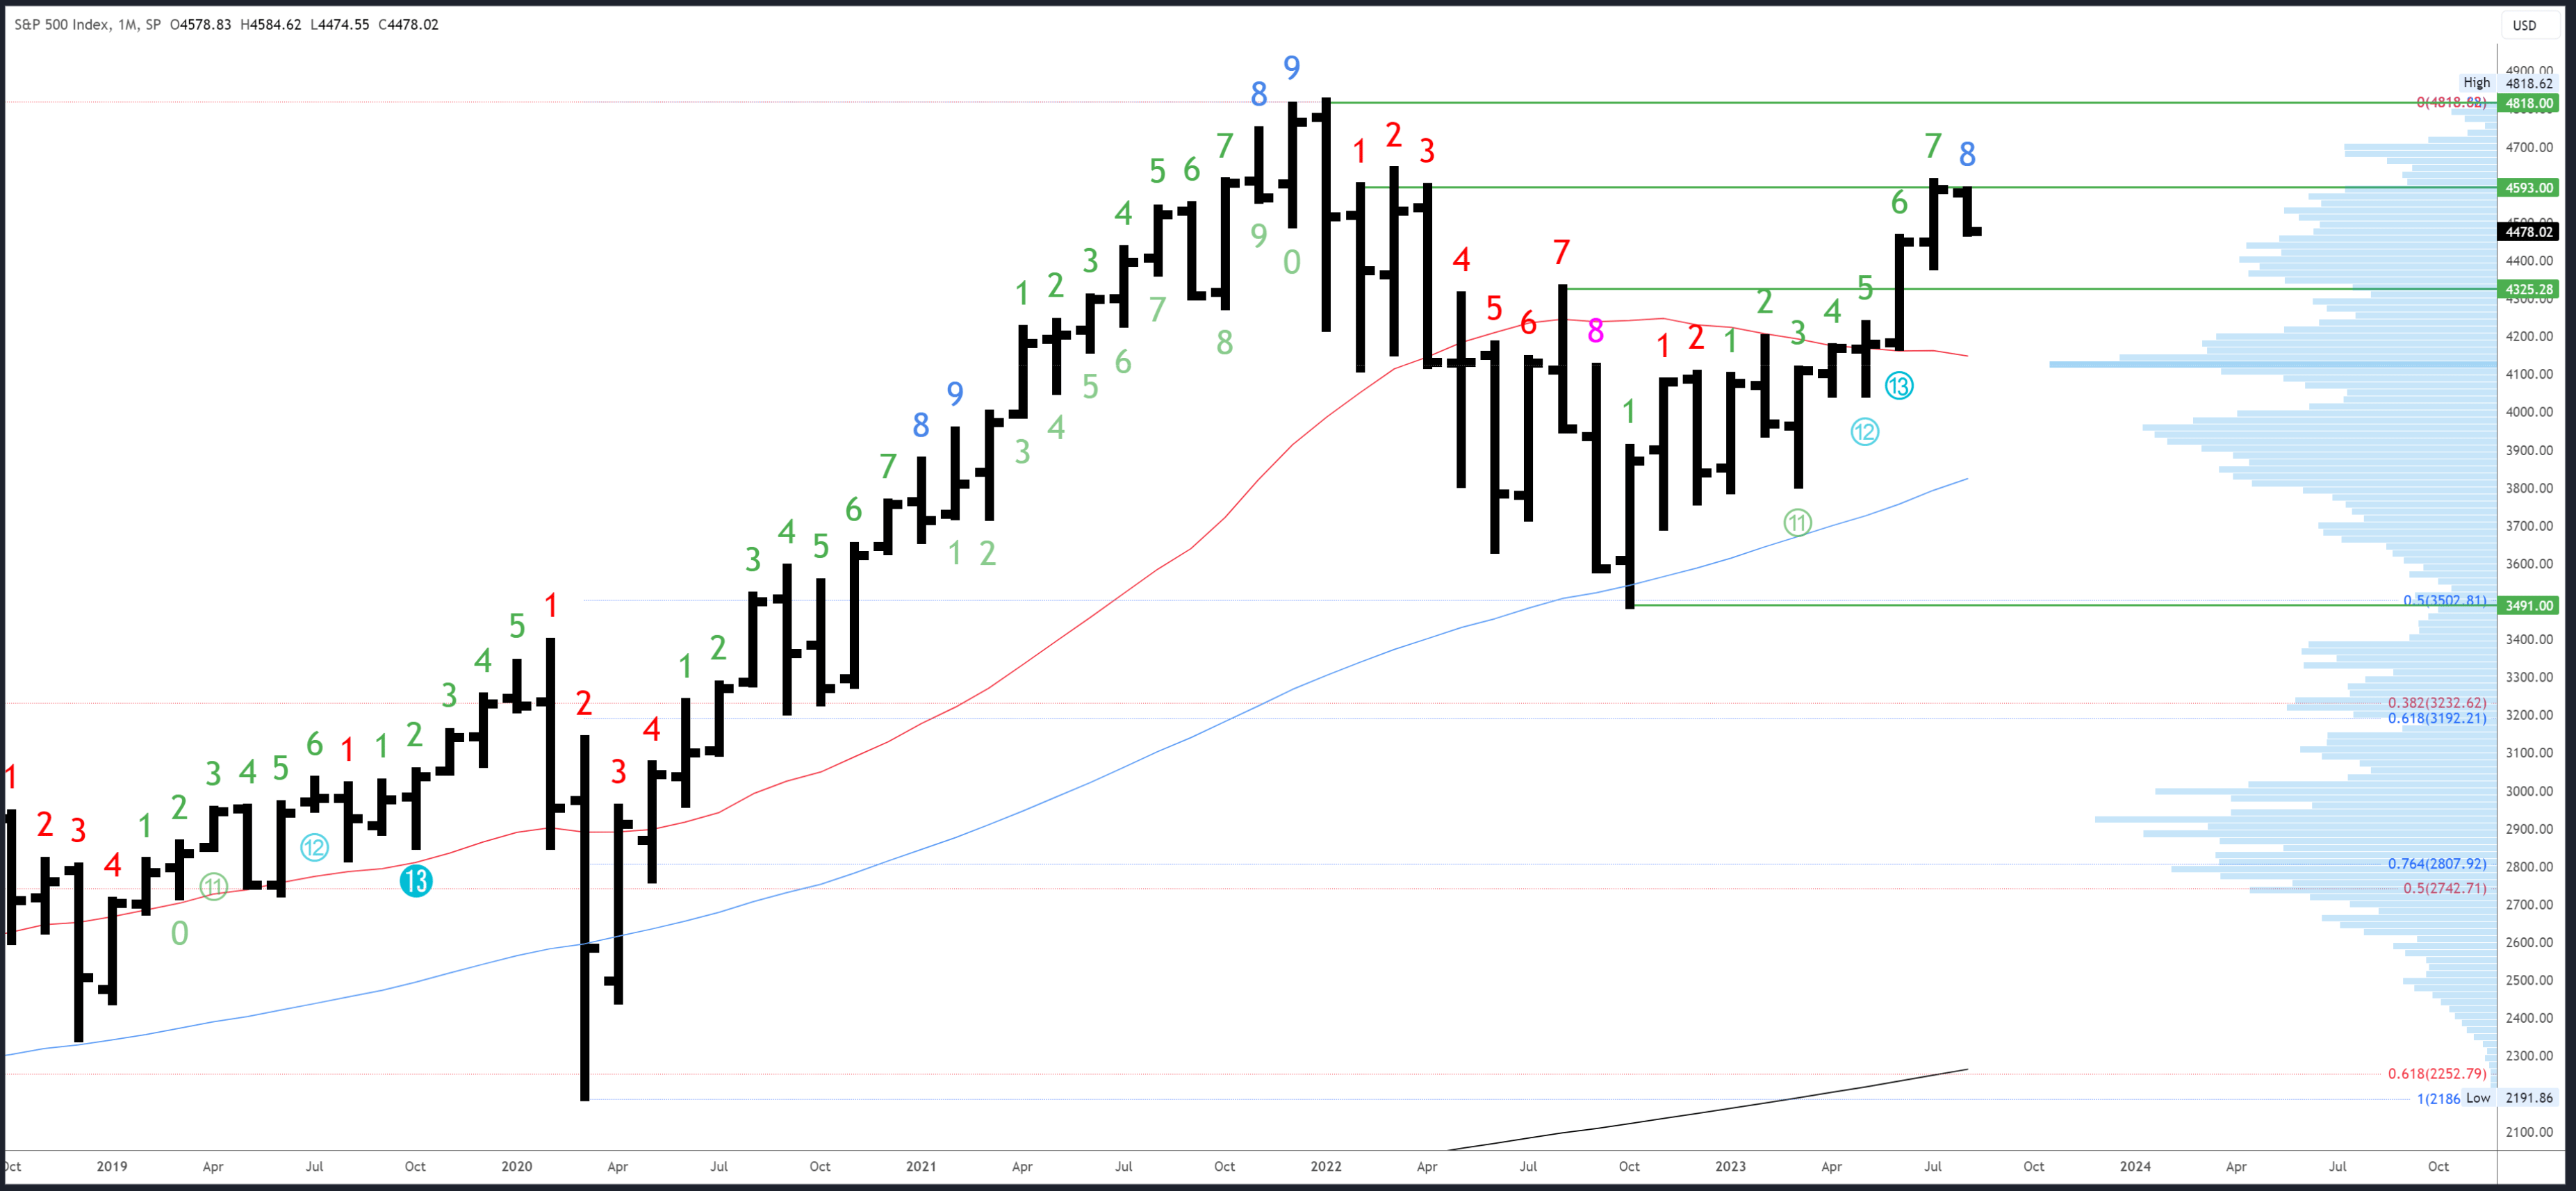
Monthly resistance is 4593-4607. 4637 is the next level above, then the all-time high of 4818.
4450-58 is the first reference on the downside at the June close/July open and the June high. 4385 is also potential support at the July low, with 4325 a level of interest below.
The monthly Demark exhaustion signal has now moved on to bar 8 of a possible 9 in August. We can expect a reaction on either bar 8 or 9 (or even the month after bar 9), but usually only when higher highs are made.
S&P 500 Weekly
The Demark exhaustion signal has finally had an effect and this week's bar was clearly bearish with a lower high, lower low, and a lower close. Furthermore, the weak close at the lows gives a bias for continuation early next week, but only to below 4474.5 where a reversal could develop.
SPX Weekly (Tradingview)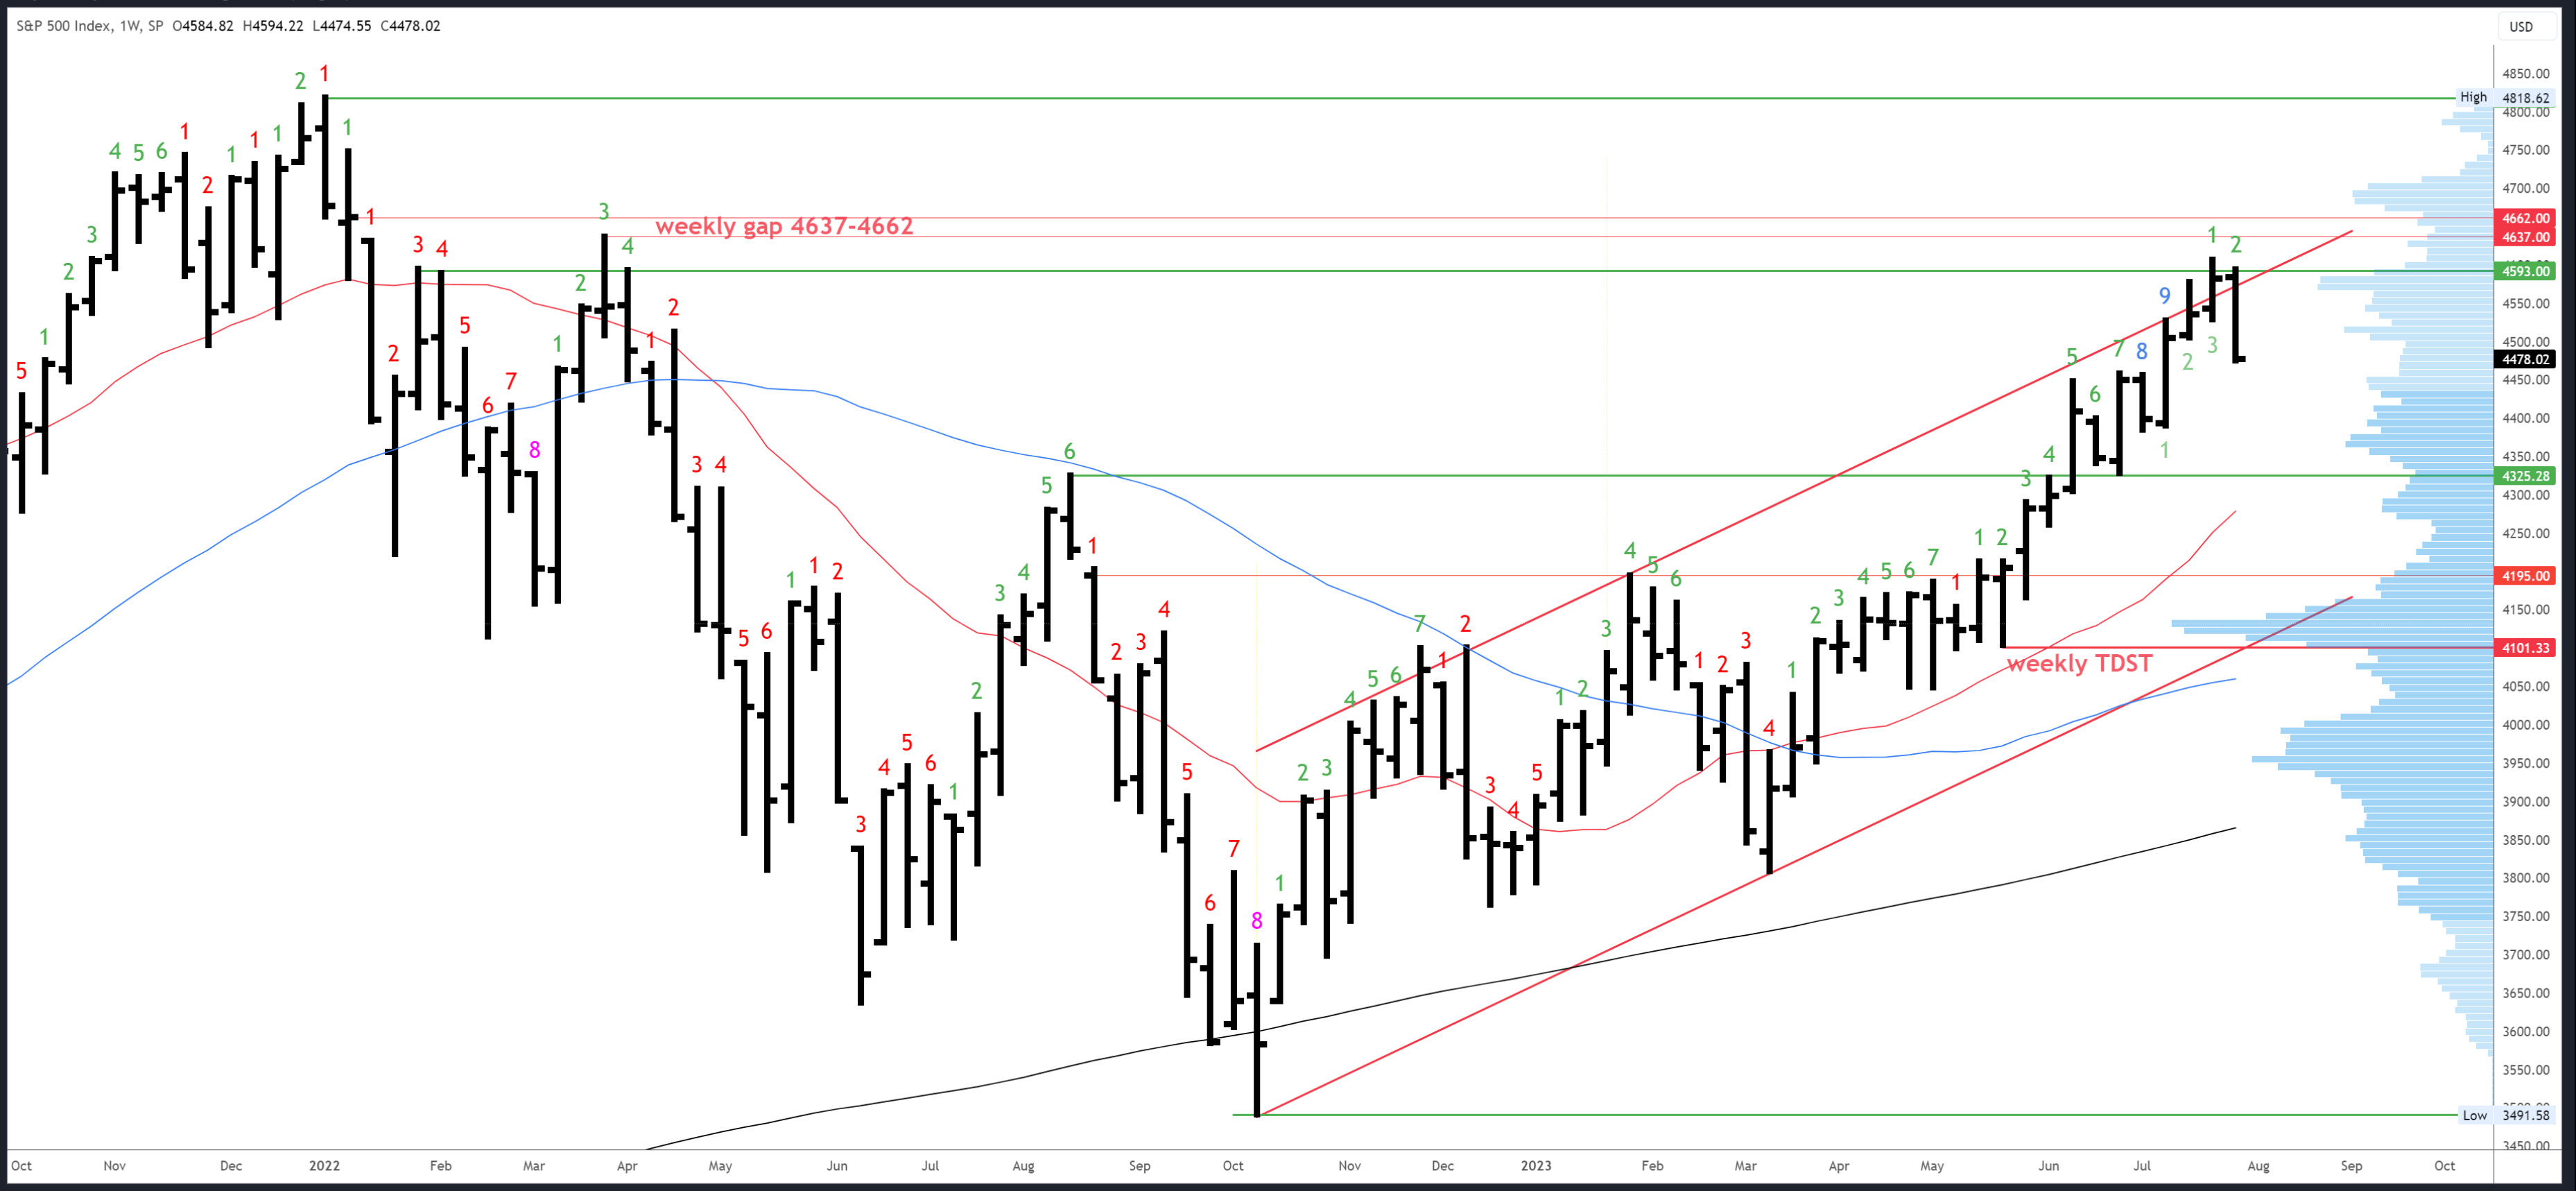
4607 is the first obvious resistance. Above that, the weekly gap from 4637-62 is the next target and could fill later in August.
The break-out area of 4448-58 is initial support, followed by 4385-89 and 4325.
An upside (Demark) exhaustion count has completed on bar 9 (of 9). A new count will be on bar 3 (of 9) next week but is unlikely to continue to completion.
S&P 500 Daily
Tuesday's 'gap and go' and Friday's 'engulfing' bar were bearish developments, as was the break in the 20dma which could not be reclaimed during Friday's failed rally.
Friday's drop to 4474 nearly reached minor support at the 4472 gap fill from the 12th July. However, there is a bias for at least a lower low and the ideal target remains the 4448-58 area.
Should 4448 break early in the week, there is good support at the 50dma and channel confluence around 4400 (and rising).
SPX Daily (Tradingview)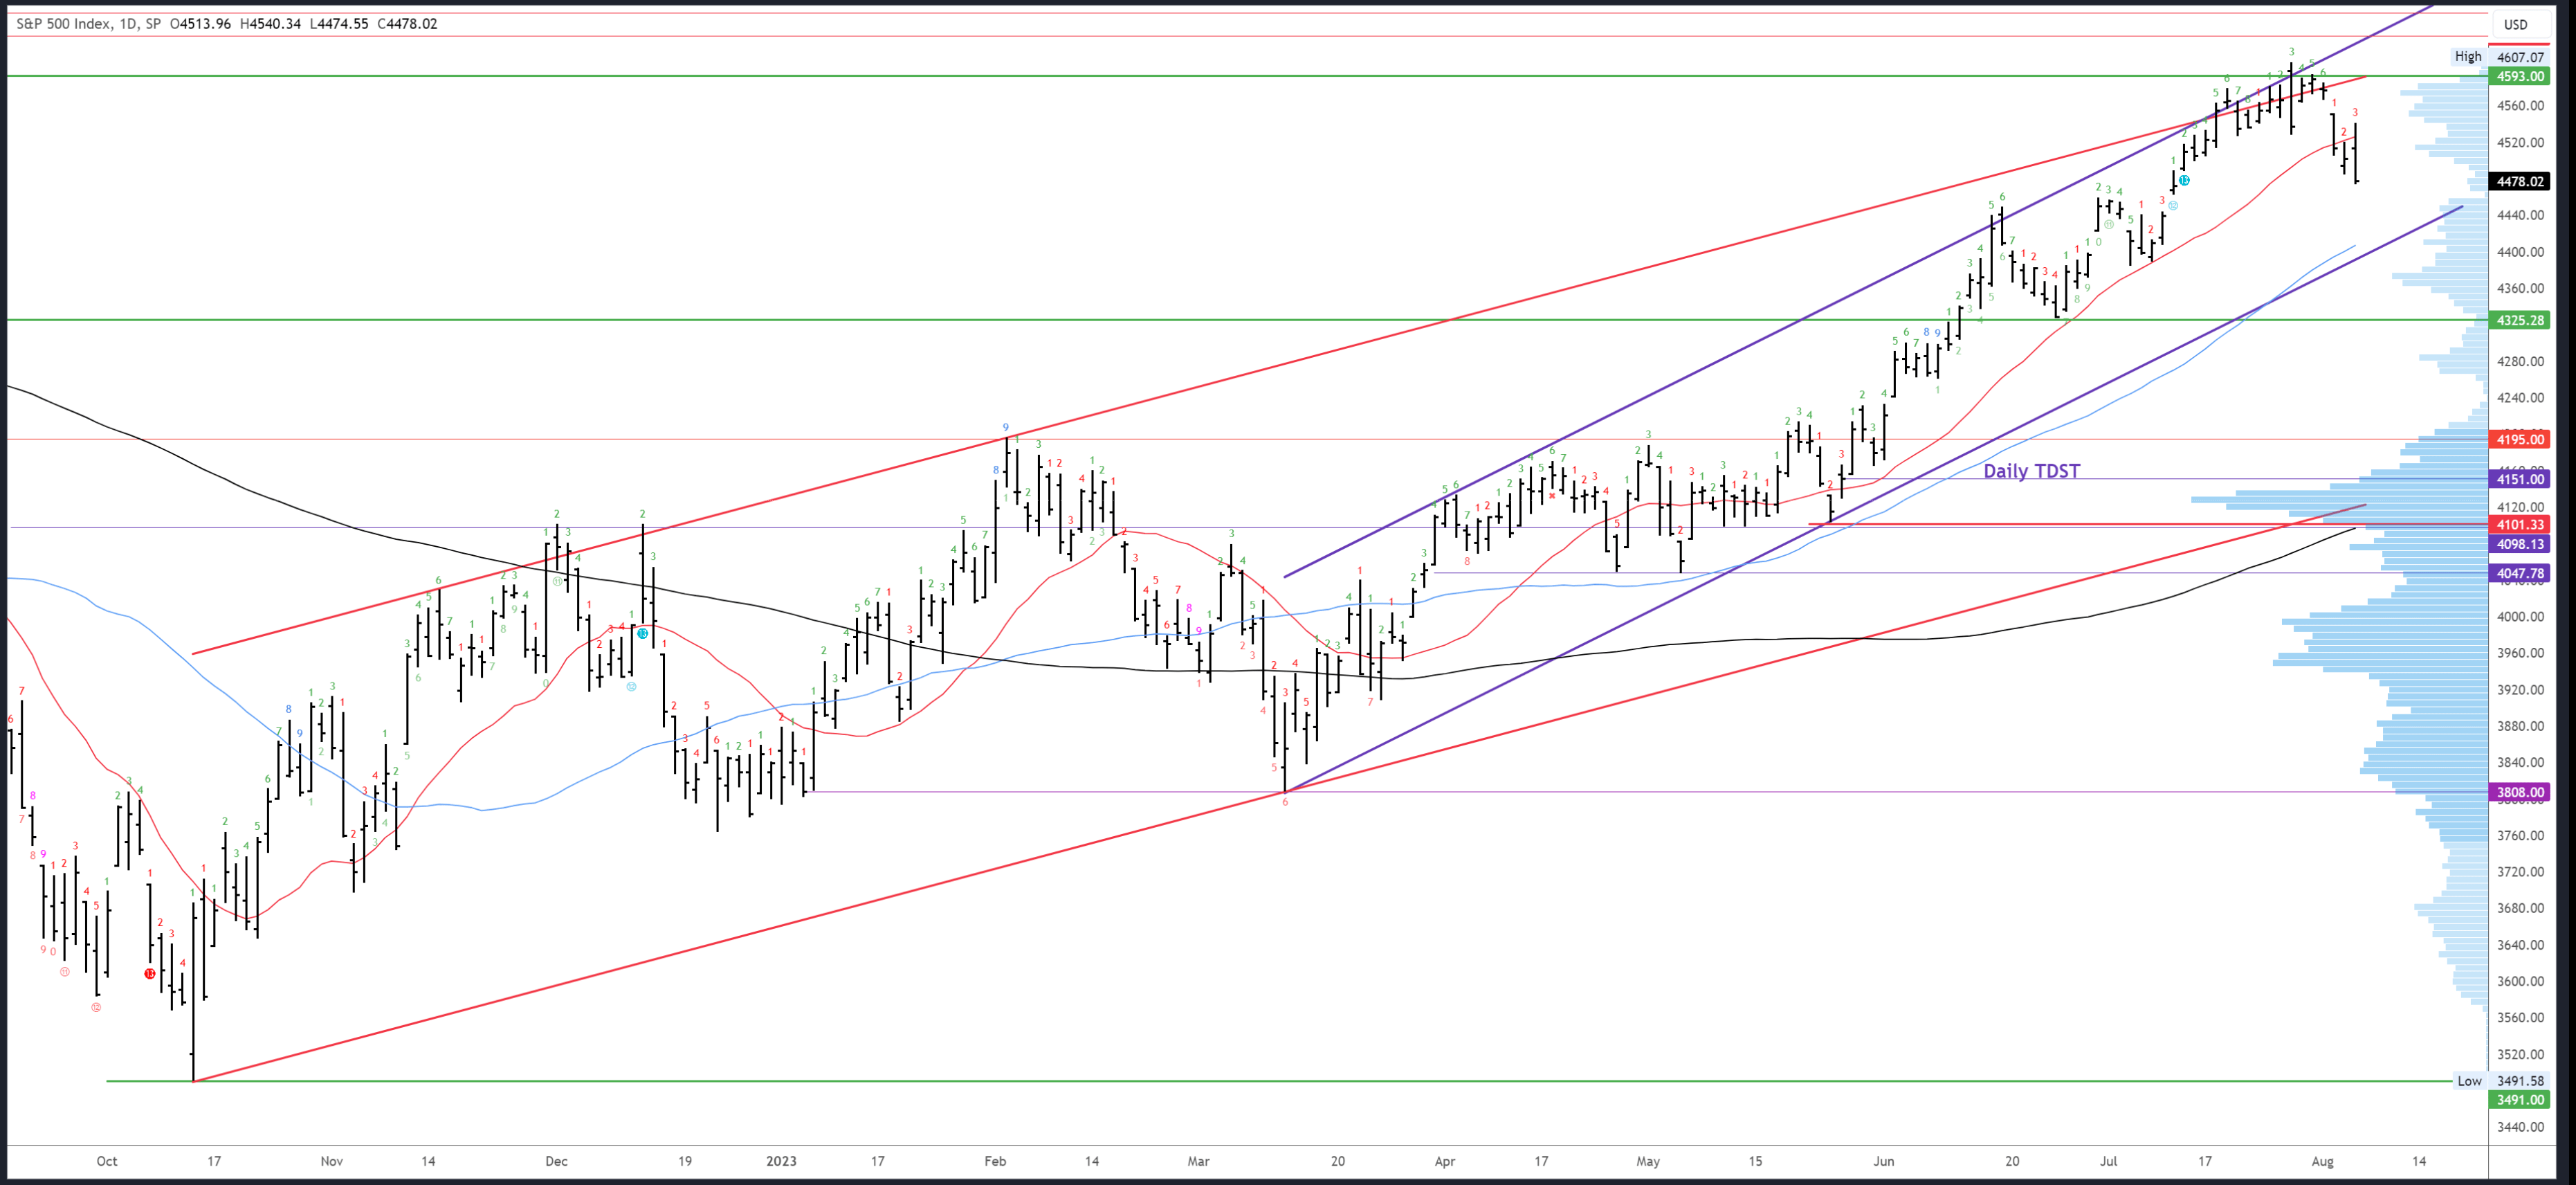
Initial resistance is 4540-51, then 4593.
A downside Demark exhaustion count will be on bar 4 (of 9) on Monday. Should weakness continue, bar 8 could register on Friday and lead to a bounce.
Events Next Week
It was all looking so good for the bulls. The Fed could well be finished its hiking cycle and the soft/no landing view has been gaining traction from a number of analysts (JP Morgan shifted to no recession on Friday). Bullish complacency called for a contrarian view and as I said in last week's comments section, "I can't see a reason for a reversal which usually tells me one is close." Then, the Fitch downgrade came out of nowhere.
While the downgrade highlighted some concerning points about US government debt, these are not new issues and not an immediate concern. It did cause a logical jump in yields, which weighed further on stocks, but this move may have run its course, especially following Friday's NFP reversal.
NFP itself caused a 'strange' reaction: yields put in a nasty downside reversal, but then so did stocks. It seems the weak NFP headline number was too weak and recession fears could make a comeback. This is typical timing now that the consensus call is for no recession.
Next week's calendar is light until the end of the week. CPI and unemployment claims are due on Thursday, while PPI and Consumer Sentiment are on Friday. Bulls need data to come in just right: too weak and recession worries come to the fore, too strong and yields could jump.
Probable Moves Next Week(s)
Next week could be a tale of two halves. The weak close on Friday has set the S&P500 up for an initial drop which could test the ideal target at 4448-58. A reversal in this area (or even just from a lower low under 4474) should set up stronger action over the rest of the week. 4551 is the initial upside target, and 4593 possible later.
Recent price action has echoes of early July, especially the failed NFP rally.
SPX Repeating Price Action (Tradingview)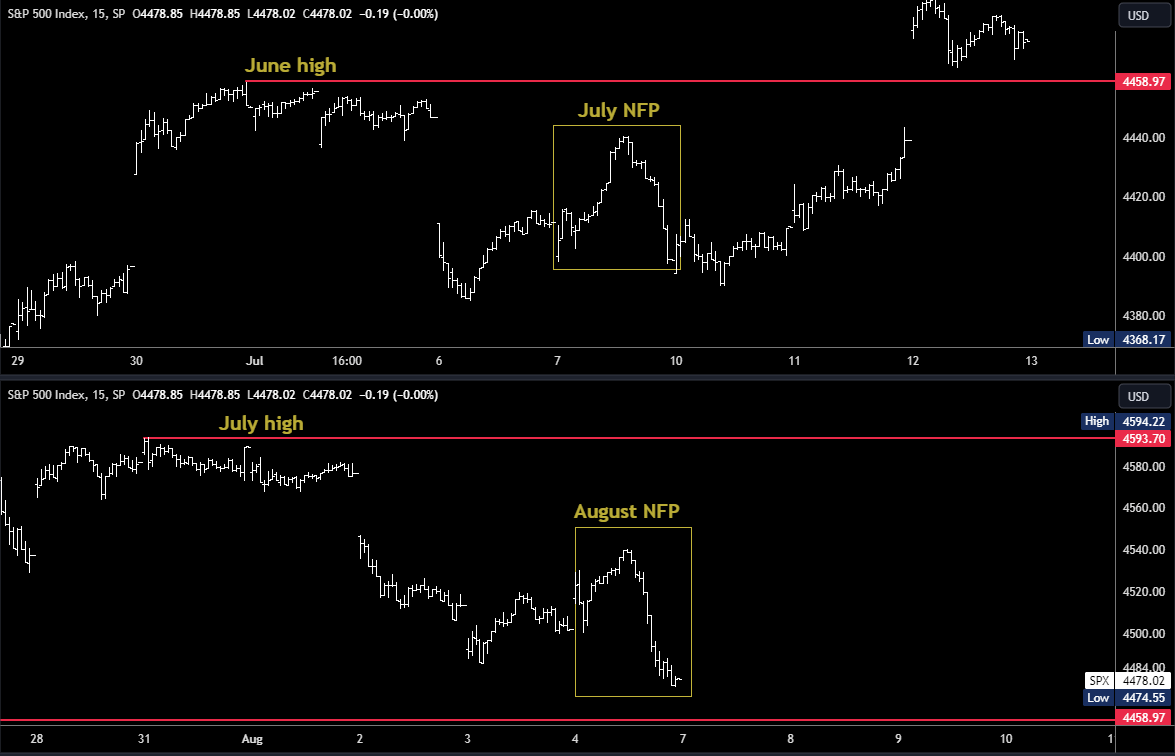
This comparison provides a visual guide to expectations. However, this time I do not expect new highs directly. A second phase of this correction should unfold later in the month.
Should 4448-58 break, or Monday close weak again, the daily channel/50dma confluence is likely the next target. This is around 4400 on Monday and rising approximately 5 points a day.
While I expect a period of weaker corrective action in the first half of August, longer-term I do not think the top is in at 4607. The weekly gap from 4637-62 is a viable target later this month or in September, and a healthy consolidation in the coming weeks and months could eventually propel the S&P 500 to new all-time highs.
This article was written by

Analyst’s Disclosure: I/we have no stock, option or similar derivative position in any of the companies mentioned, and no plans to initiate any such positions within the next 72 hours. I wrote this article myself, and it expresses my own opinions. I am not receiving compensation for it (other than from Seeking Alpha). I have no business relationship with any company whose stock is mentioned in this article.
Seeking Alpha's Disclosure: Past performance is no guarantee of future results. No recommendation or advice is being given as to whether any investment is suitable for a particular investor. Any views or opinions expressed above may not reflect those of Seeking Alpha as a whole. Seeking Alpha is not a licensed securities dealer, broker or US investment adviser or investment bank. Our analysts are third party authors that include both professional investors and individual investors who may not be licensed or certified by any institute or regulatory body.
Recommended For You
Comments (1)
